_________________________________________________
Voted #1 Blog and #1 Brokerage Services on TraderPlanet for 2016!!
_________________________________________________
Get Real Time updates and more on our private FB group!
Dear Traders,
Today’s action in Silver, gold, SP and NQ lead me to write the quick piece below.
Few words on BREAKOUT trading.
The concept is one of many different traders use.
Some like to use COUNTRER TREND trading.
others look at ORDER FLOW, some will use support and resistance mainly and hopefully more traders will master a few different techniques and use the appropriate one depending on the type of trading day that is developing in front of their eyes.
The concept of break out trading looks for the market to “snap out” of a certain trading range and continue moving in that direction. The toughest part is to filter out the “fake breakouts” and recognize early enough which breakouts have the potential to be a powerful one.
A few tips to explore:
Look for a breakout on a smaller time frame that will coincide with a longer time frame CURRENT trend. So you may look at a daily trend and look for a breakout on the hourly chart?
You may trade smaller time frames and look for breakouts that will coincide with the 30 minute chart time frame.
Last but not least ( for today only of course as I am sure there are MUCH more than the short few pointers I am sharing….) try utilizing different type of charts and do your homework in regards to which breakouts seem to work better than others. Look at RANGE BAR charts, explore VOLUME charts, maybe even take a look at Renko bars and other types as well.
To access a free trial to the ALGOS shown in the chart along with other tools? (Slanted arrows possible buy, diamonds = possible exit/ tighten stops) visit and
sign up for a free trial for 21 days with real-time data.
Good Trading
Trading Futures, Options on Futures, and retail off-exchange foreign currency transactions involves substantial risk of loss and is not suitable for all investors. You should carefully consider whether trading is suitable for you in light of your circumstances, knowledge, and financial resources. You may lose all or more of your initial investment. Opinions, market data, and recommendations are subject to change at any time when it comes to Futures Trading.
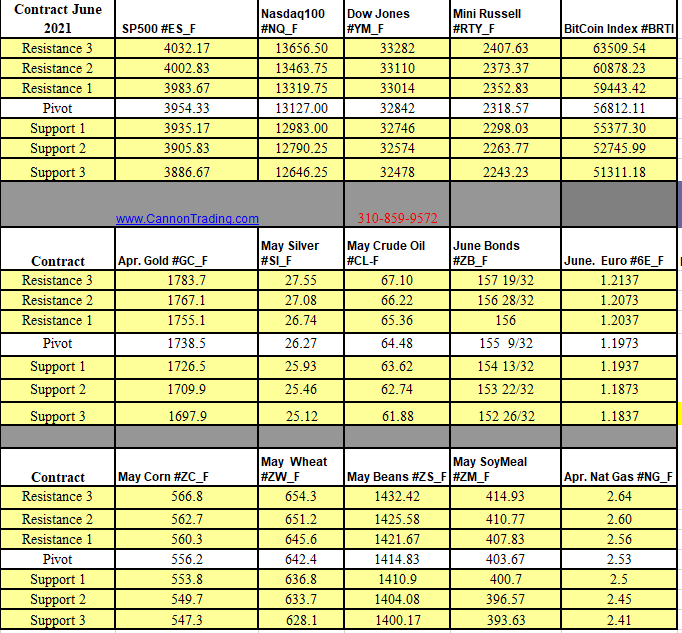
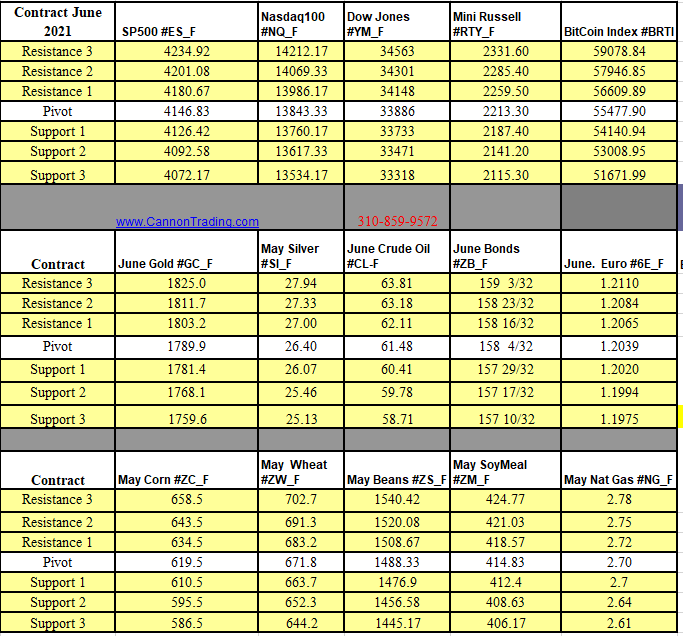
Futures Trading Levels
4-22-2021
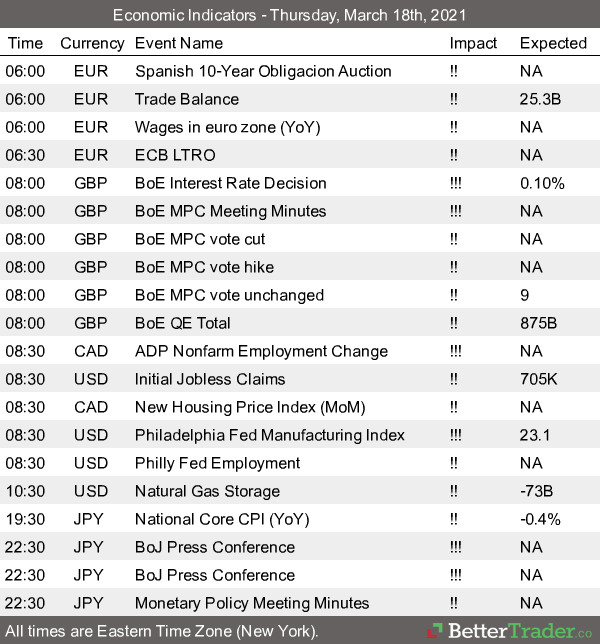
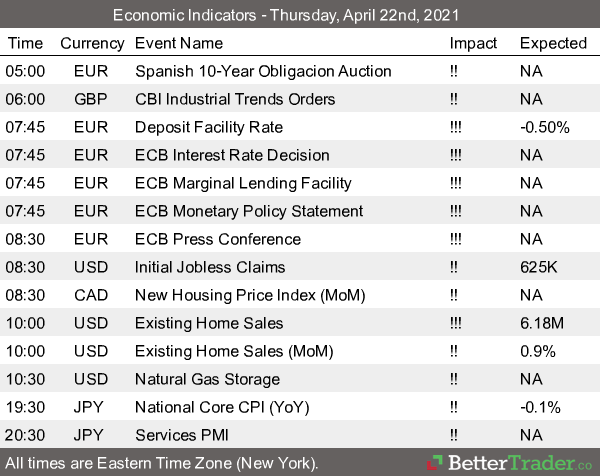
Economic Reports, source:
www.BetterTrader.co
This is not a solicitation of any order to buy or sell, but a current market view provided by Cannon Trading Inc. Any statement of facts here in contained are derived from sources believed to be reliable, but are not guaranteed as to accuracy, nor they purport to be complete. No responsibility is assumed with respect to any such statement or with respect to any expression of opinion herein contained. Readers are urged to exercise their own judgement in trading.