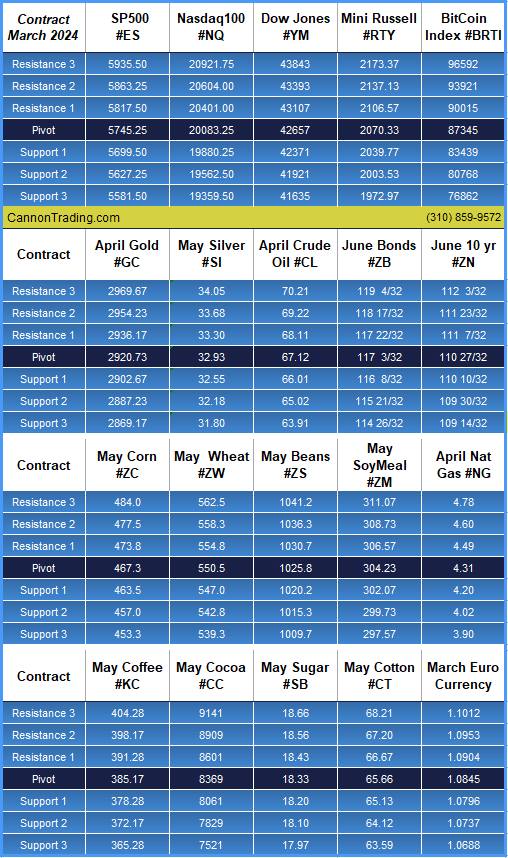
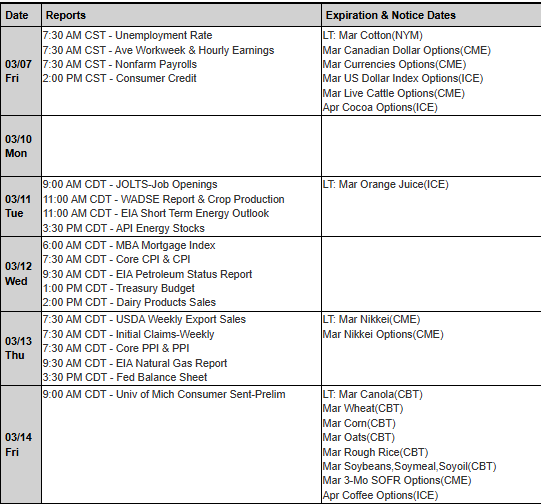
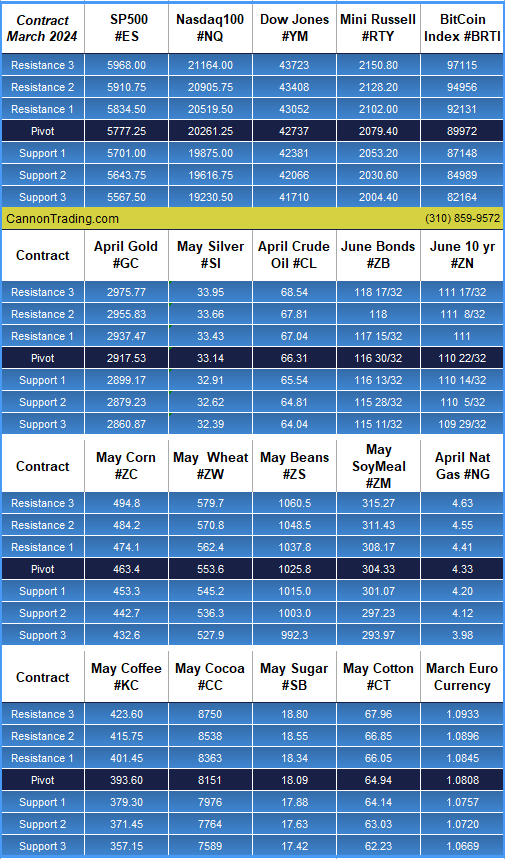
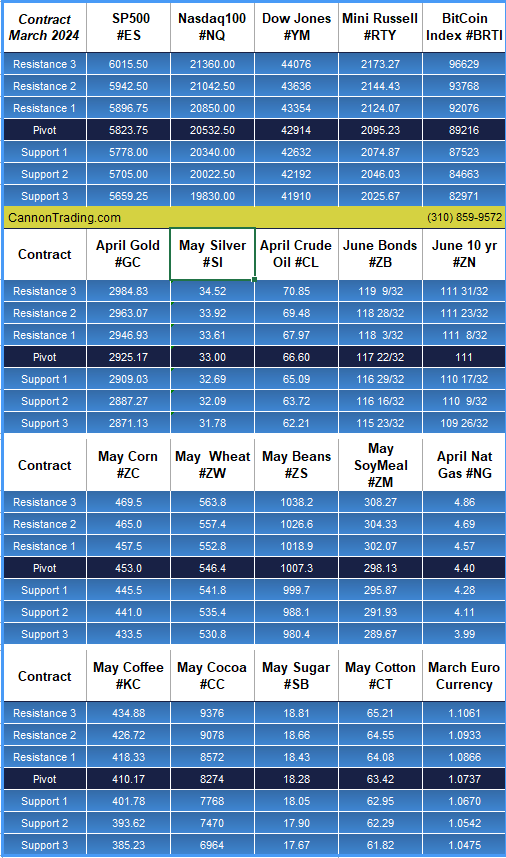
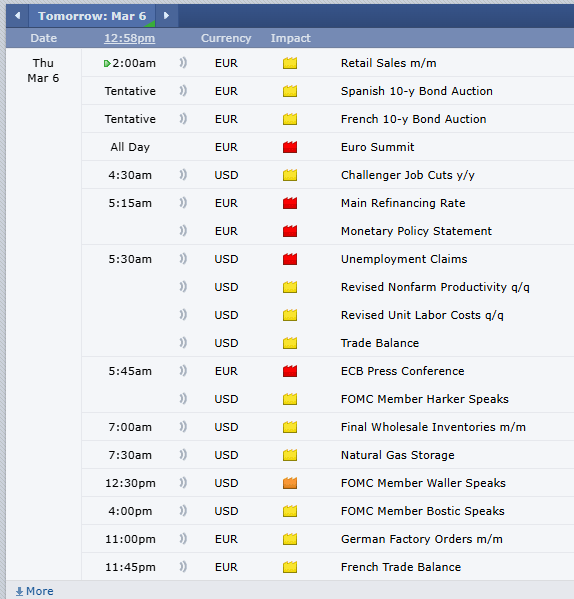
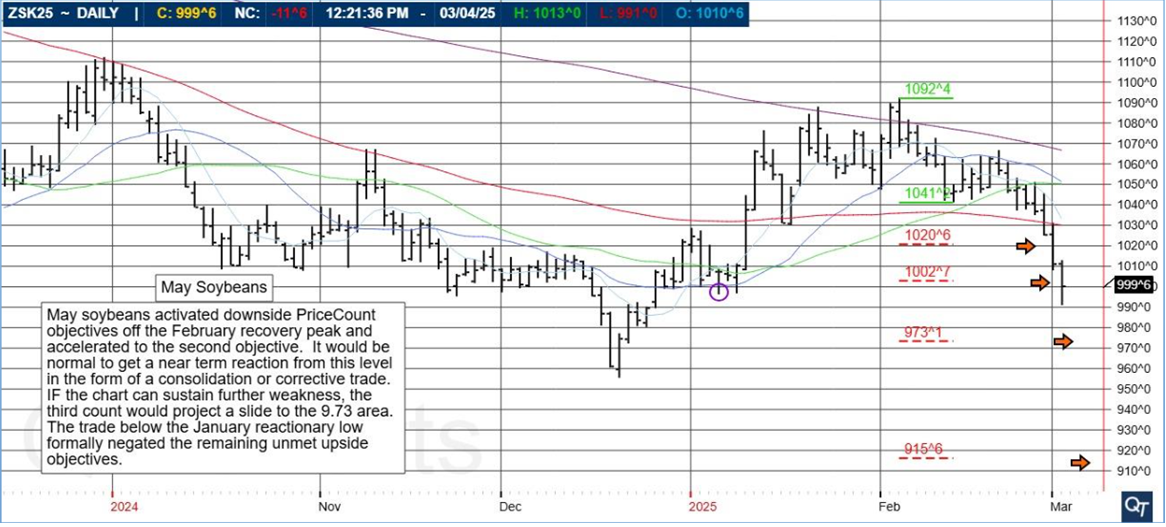
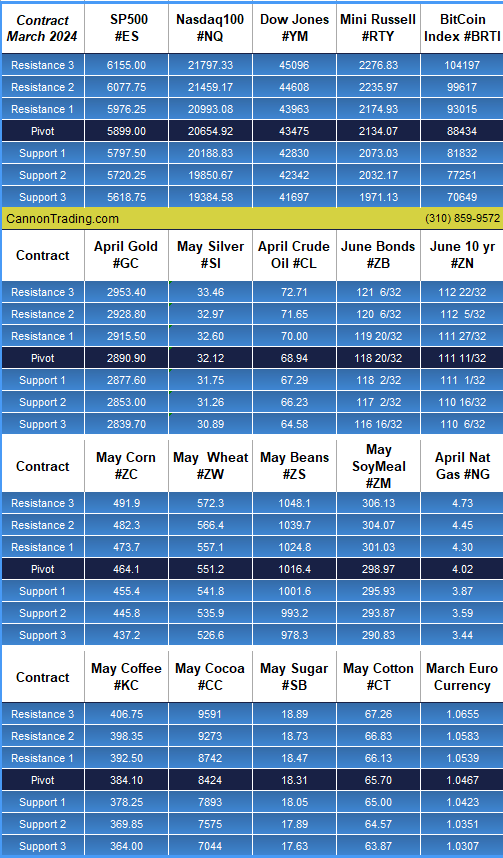
Support & Resistance Levels

This Blog provides futures market outlook for different commodities and futures trading markets, mostly stock index futures, as well as support and resistance levels for Crude Oil futures, Gold futures, Euro currency and others. At times the daily trading blog will include educational information about different aspects of commodity and futures trading.

Standard & Poor’s 500 Index Futures

Standard & Poor’s 500 Index futures—commonly referred to as S&P 500 futures, SP500 index futures, futures sp, standard and poor’s 500 future, futures sp500, or simply SP futures—are one of the most actively traded financial derivatives globally. These contracts provide market participants with a way to speculate on or hedge against movements in the S&P 500, which is a broad index encompassing 500 of the largest publicly traded companies in the United States. Given its depth, liquidity, and representativeness of the overall U.S. economy, the S&P 500 index is a favored benchmark for institutional, retail, and hedging market participants alike.

This guide will explore the components of S&P 500 futures contracts, delve into their use cases by various market participants, chart their history, and explain their evolution, especially since futures trading went online. Special emphasis will be given to the E-Mini S&P 500 futures, Micro E-Mini S&P 500 futures, and other key contracts tied to the index.

Components of the S&P 500 Futures Contract

At its core, a Standard & Poor’s 500 Index futures contract is an agreement to buy or sell the underlying Standard & Poor’s 500 Index futures contract at a predetermined price on a specific future date. However, there are several specific components that traders must understand when trading these contracts.

  • Underlying Asset

The underlying asset of standard and poor’s 500 future contract is the S&P 500 Index itself. Unlike a stock or a commodity, which has physical representation, the index is an abstract entity representing the performance of 500 of the largest U.S. companies. The price of the futures contract is derived from the index’s value.

  • Contract Size

The contract size refers to the dollar amount of the underlying asset that one futures contract controls. The standard and poor’s 500 future contracts have multiple variations in terms of size, including the E-Mini and Micro E-Mini futures:

  • E-Mini S&P 500 futures (ES): Each contract represents 50 times the value of the S&P 500 index. For example, if the index is trading at 4,500 points, the notional value of one E-Mini sp500 index futures contract is 4,500 × 50 = $225,000.
  • Micro E-Mini S&P 500 futures (MES): A much smaller version of the E-Mini, the Micro contract represents 1/10th of the E-Mini contract, or 5 times the index. If the index is trading at 4,500 points, the notional value of one Micro sp500 index futures contract is 4,500 × 5 = $22,500.
  • Expiration Date

Each S&P 500 futures contract has a specific expiration date. Most commonly, these contracts expire quarterly in the months of March, June, September, and December. The date is important because at expiration, the contract must be settled, either through cash settlement or the rolling over of the contract to a new expiration.

  • Pricing

S&P 500 futures pricing is driven by supply and demand, similar to other futures. However, because the futures contract is based on an index, it’s also influenced by factors like interest rates, dividends from the underlying stocks, and time to expiration. The formula for determining the fair value of the futures contract is:

Futures Price = Spot Price × [1 + (Risk-free Interest Rate – Dividend Yield)]

  • Settlement

S&P 500 futures are settled in cash, meaning there is no physical delivery of the index components. Instead, at expiration, any profit or loss is settled based on the difference between the contract price and the actual index level at that time.

  • Margins

When trading futures sp500, traders are not required to pay the full notional value upfront. Instead, they post an initial margin, which is a fraction of the total contract value, usually around 5-10%. Margins are subject to change based on market conditions, with brokers typically adjusting the requirements based on volatility.

Institutional Use of S&P 500 Futures

Institutional traders—including hedge funds, pension funds, mutual funds, and large asset managers—are the primary users of S&P 500 futures. They utilize these contracts for various purposes:

  • Portfolio Hedging

Institutions holding large portfolios of U.S. stocks use S&P 500 futures to hedge against potential downturns. For example, a fund that mirrors the S&P 500 can sell (short) futures sp500 contracts as a way to protect its portfolio if the market declines.

  • Asset Allocation

Institutions use futures as a tool for efficient asset allocation. By entering into futures contracts, they can quickly and cost-effectively adjust their portfolio’s exposure to U.S. equities without having to buy or sell the underlying stocks.

  • Leverage

Institutional investors often use futures to gain leveraged exposure to the S&P 500. By trading futures, they can control a large notional value of the index with only a fraction of the capital required to buy the actual stocks.

  • Arbitrage

Arbitrageurs use futures sp to take advantage of price discrepancies between the futures contract and the underlying index. This activity helps keep the price of the futures contract in line with the spot value of the S&P 500 index.

Retail Use of S&P 500 Futures

S&P 500 futures are also popular among retail traders, though their use differs significantly from that of institutional traders.

  • Speculation

Many retail traders use futures sp to speculate on the direction of the market. Because futures provide leverage, a small price movement in the underlying index can result in significant gains or losses, making it a favored instrument for active traders looking to profit from short-term moves.

  • Leverage

Retail traders, like institutions, are attracted to the leverage that futures contracts offer. By putting down a margin that is a fraction of the contract’s notional value, retail traders can control large positions with relatively small amounts of capital.

  • Day Trading

Due to the liquidity and volatility of S&P 500 futures, they are a popular vehicle for day traders. The futures market operates nearly 24 hours a day, allowing traders to participate during extended hours, including times when the stock market is closed.

  • Micro E-Mini S&P 500 Futures

Introduced in 2019, the Micro E-Mini S&P 500 futures were designed specifically for retail traders. With a smaller contract size (1/10th of an E-Mini), retail traders can participate in the S&P 500 futures market with less capital and reduced risk.

Hedging with S&P 500 Futures

Hedgers, whether institutional or individual, use S&P 500 futures to manage their exposure to market risk. The flexibility of these contracts makes them an ideal tool for hedging purposes across a range of scenarios:

  • Equity Portfolio Hedging

Investors holding a portfolio of U.S. equities can hedge against potential market declines by selling (shorting) S&P 500 futures. If the market falls, the losses in the portfolio can be offset by gains in the futures position.

  • Corporate Hedging

Corporations that have significant exposure to the U.S. equity market, either through pension funds or stock-based compensation plans, also use S&P 500 futures to hedge against adverse market movements.

  • Sector-Specific Hedging

While S&P 500 futures reflect the broader U.S. market, some sectors within the index have more weight than others (such as technology or financials). Hedgers can use S&P 500 futures to manage sector-specific risks, depending on the composition of their portfolios.

A Brief History of S&P 500 Futures

The history of S&P 500 futures dates back to 1982 when the Chicago Mercantile Exchange (CME) introduced the first futures contracts on the S&P 500 index. This event marked a significant evolution in financial markets, as it provided a liquid and efficient way for traders to speculate on or hedge against movements in the U.S. stock market.

1982: Inception of S&P 500 Futures

Initially, the contracts were large, with a high notional value that primarily attracted institutional traders. The futures contract quickly gained popularity due to the flexibility and liquidity it offered.

1997: Introduction of E-Mini S&P 500 Futures

The E-Mini S&P 500 futures were introduced in 1997 to appeal to smaller traders, both institutional and retail. With a contract size of 1/5th of the original S&P 500 futures contract, the E-Mini was a game changer. The reduced margin requirements and lower notional value opened the door for a wider array of market participants.

2019: Introduction of Micro E-Mini S&P 500 Futures

Further lowering the barrier to entry, the CME launched the Micro E-Mini S&P 500 futures in 2019. These contracts are 1/10th the size of the E-Mini, making them an ideal choice for retail traders who want to participate in the S&P 500 futures market but with less exposure and lower margin requirements.

The Digital Revolution

The growth of online trading platforms and the advent of electronic trading has transformed the futures market. Electronic trading allows near-instant execution of trades, providing liquidity and transparency around the clock. Online platforms have made it easier than ever for retail traders to access the futures market, leading to a democratization of trading that continues to this day.

Evolution of S&P 500 Futures Since the Onset of Online Trading

Since futures trading went online in the late 1990s and early 2000s, there has been a dramatic shift in how futures are traded and accessed. Online trading platforms now allow traders, from retail to institutional, to access real-time quotes, execute trades instantly, and manage risk using advanced order types like stop losses and limit orders.

  • Increased Participation

The accessibility of online platforms has led to increased participation in the S&P 500 futures market. What was once a tool primarily used by institutional traders has now become an essential component of many retail portfolios.

  • Reduced Transaction Costs

With the rise of online trading, transaction costs for trading S&P 500 futures have fallen significantly. The elimination of manual order processing and increased competition among brokers have resulted in lower commissions and fees.

  • 24-Hour Market Access

One of the major benefits of electronic trading is the ability to trade nearly 24 hours a day, five days a week. This is particularly important for global traders and those who want to react to events that happen outside of regular market hours.

Key S&P 500 Futures Contracts: E-Mini and Micro E-Mini

Two of the most important S&P 500 futures contracts today are the E-Mini S&P 500 futures and the Micro E-Mini S&P 500 futures.

E-Mini S&P 500 Futures (ES)

  • Launched: 1997
  • Contract Size: 50 times the value of the S&P 500 index
  • Minimum Tick Size: 0.25 index points, or $12.50 per tick
  • Trading Hours: Nearly 24 hours a day on CME’s Globex platform

Micro E-Mini S&P 500 Futures (MES)

  • Launched: 2019
  • Contract Size: 5 times the value of the S&P 500 index
  • Minimum Tick Size: 0.25 index points, or $1.25 per tick
  • Trading Hours: Nearly 24 hours a day on CME’s Globex platform

S&P 500 futures have evolved into one of the most versatile and widely traded financial instruments in the world. They provide institutions, retail traders, and hedgers with an efficient way to gain exposure to, speculate on, or hedge against movements in the U.S. stock market. With the advent of E-Mini and Micro E-Mini contracts, as well as the growth of online trading platforms, participation in the S&P 500 futures market has expanded dramatically, making it more accessible than ever before. Whether used for hedging, speculation, or asset allocation, S&P 500 futures remain a cornerstone of modern financial markets.

For more information, click here.

Ready to start trading futures? Call us at 1(800)454-9572 – Int’l (310)859-9572 (International), or email info@cannontrading.com to speak with one of our experienced, Series-3 licensed futures brokers and begin your futures trading journey with Cannon Trading Company today.

Disclaimer: Trading Futures, Options on Futures, and retail off-exchange foreign currency transactions involve substantial risk of loss and are not suitable for all investors. Past performance is not indicative of future results. Carefully consider if trading is suitable for you in light of your circumstances, knowledge, and financial resources. You may lose all or more of your initial investment. Opinions, market data, and recommendations are subject to change at any time.

Important: Trading commodity futures and options involves a substantial risk of loss. The recommendations contained in this article are opinions only and do not guarantee any profits. This article is for educational purposes. Past performances are not necessarily indicative of future results.

This article has been generated with the help of AI Technology and modified for accuracy and compliance.

Follow us on all socials: @cannontrading

The Week Ahead in Futures Trading – What to Expect + Silver Trading system & More!

C65 1

Get Real Time updates and more by joining our Private Facebook Group!

Subscribe to our YouTube Channel


Cannon Futures Weekly Letter Issue # 1211

In this issue:

  • Important Notices – FOMC Minutes, CPI, PPI, WASDE & Middle East.
  • Futures 101 – SP 500 what’s Next
  • Hot Market of the Week – December Wheat
  • Broker’s Trading System of the Week – Silver Day Trading System
  • Trading Levels for Next Week
  • Trading Reports for Next Week

Important Notices – Next Week Highlights:

The Week Ahead

By John Thorpe, Senior Broker

Earnings season begins in earnest. Major Inflation indicators. FOMC Minutes. 17 Fed Speeches by all 12 Fed Governors. So, we have a little bit of everything, in what is expected to be a huge week, adding to the current Middle East volatility.

Prominent Earnings this Week:

  • Tues, pre-open Pepsi
  • Thur, Progressive
  • Fri. Pre-open Blackrock, Wells Fargo and J.P. Morgan Chase

FOMC Minutes Wednesday. 1:00PM Central 

FED SPEECHES:

  • Mon. Bowman, Kaskari, Bostic, Musalem
  • Tue. Kugler, Bostic, Collins, Jefferson
  • Wed. Logan, Williams, Barkin, Jefferson, Collins, Daly- FOMC MINUTES
  • Thu. Cook
  • Fri. Goolsbee, Bowman

Big Economic Data week:

  • Mon.
  • Tues. Balance of Trade, Redbook
  • Wed. FOMC MINUTES
  • Thur. Jobless Claims, CPI, Fed Balance Sheet
  • Fri. PPI, Michigan Consumer Sentiment, WASDE 

Futures 101: SP500 – What’s in Store for the next 2 Weeks?

Click Image Below for Larger View

image 2

Would you like to have access to research like shown above and MORE?

Here is what you will receive DAILY:

  • Specific price points for shorter term, medium term and longer term
  • Detailed chart analysis
  • Audio brief summary as well as more detailed PDF summary
  • View insight into Gold, Mini SP, Crude Oil, Corn, feeder Cattle, Live Cattle, Wheat, Hogs and more!

To sign up and get two weeks FULL access, start by requesting the free trial below.

START YOUR FREE TRIAL

Questions? We are happy to help!

stars

  • Hot Market of the Week – December Wheat

Hot market of the week is provided by QT Market Center, A Swiss army knife charting package that’s not just for Hedgers, Cooperatives and Farmers alike but also for Spread traders, Swing traders and shorter time frame application for intraday traders with a unique proprietary indicator that can be applied to your specific trading needs.


FREE TRIAL AVAILABLE

December Wheat

The extended decline in December wheat stabilized after completing the third downside PriceCount objective in August. Now, on the correction, the chart has activated upside PriceCounts and we are taking aim at the first target in the $6.27 area.

PriceCounts – Not about where we’ve been , but where we might be going next!

image 3

The PriceCount study is a tool that can help to project the distance of a move in price. The counts are not intended to be an ‘exact’ science but rather offer a target area for the four objectives which are based off the first leg of a move with each subsequent count having a smaller percentage of being achieved. It is normal for the chart to react by correcting or consolidating at an objective and then either resuming its move or reversing trend. Best utilized in conjunction with other technical tools, PriceCounts offer one more way to analyze charts and help to manage your positions and risk. Learn more at www.qtchartoftheday.com

Trading in futures, options, securities, derivatives or OTC products entails significant risks which must be understood prior to trading and may not be appropriate for all investors. Past performance of actual trades or strategies is not necessarily indicative of future results.

   Broker’s Trading System of the Week

With algorithmic trading systems becoming more prevalent in portfolio diversification, the following system has been selected as the broker’s choice for this month.

Anansi 5

PRODUCT

SI – Silver

SYSTEM TYPE

Day Trading

Recommended Cannon Trading Starting Capital

$25,000

COST

USD 115 / monthly

Recommended Cannon Trading Starting Capital

$25,000.00

COST

USD 150 / monthly

Get Started

Learn More

image 4

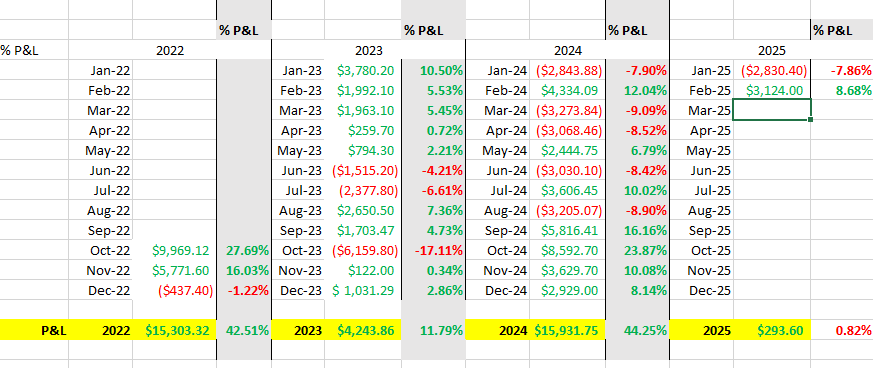
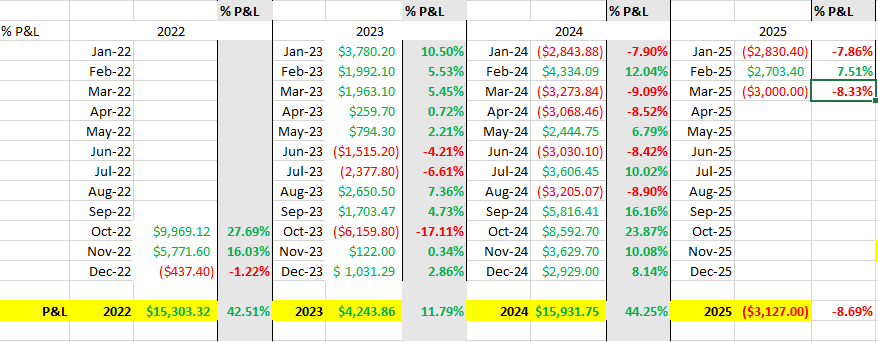
The performance shown above is hypothetical in that the chart represents returns in a model account. The model account rises or falls by the average single contract profit and loss achieved by clients trading actual money pursuant to the listed system’s trading signals on the appropriate dates (client fills), or if no actual client profit or loss available – by the hypothetical single contract profit and loss of trades generated by the system’s trading signals on that day in real time (real‐time) less slippage, or if no real time profit or loss available – by the hypothetical single contract profit and loss of trades generated by running the system logic backwards on back adjusted data. Please read full disclaimer HERE.

Would you like to receive daily support & resistance levels?
Yes Select
No Select

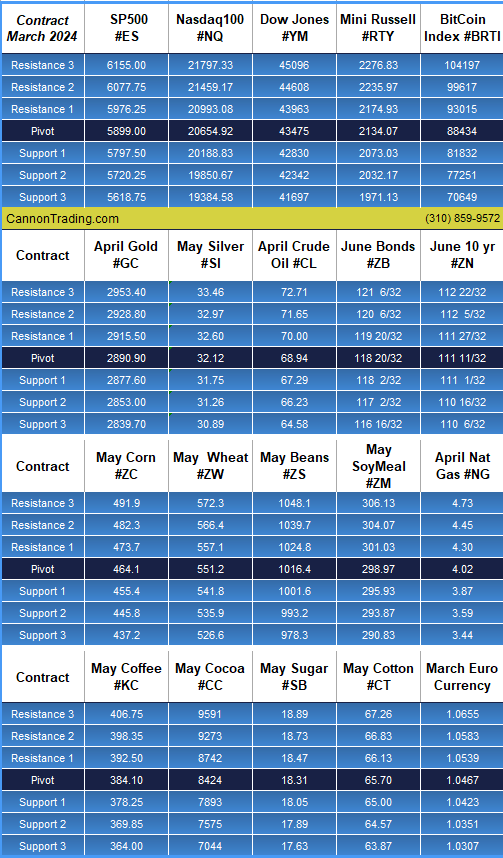
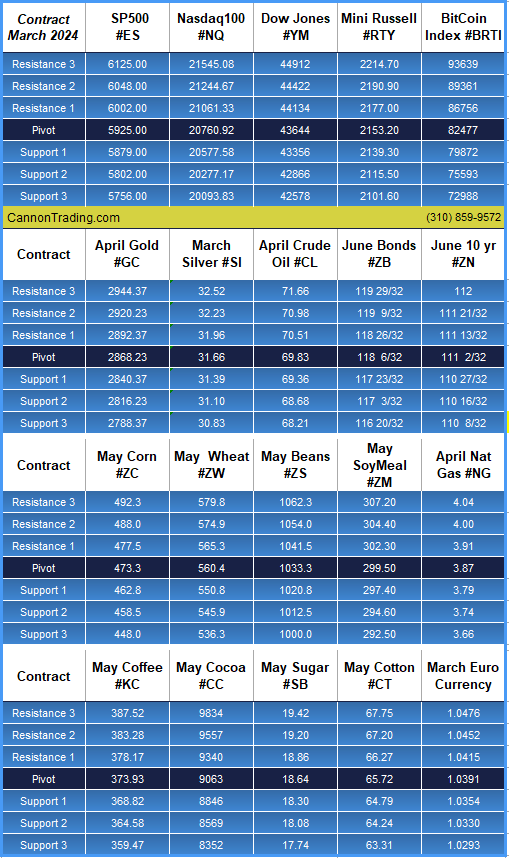
Daily Levels for October 7th, 2024

image 6

Trading Reports for Next Week

image 7
bf9b3e0d 9c23 44e8 980c a8c01bfbe2cf

Trading Reports for Next Week

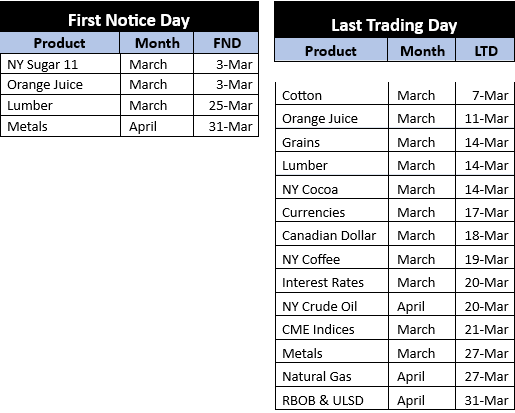
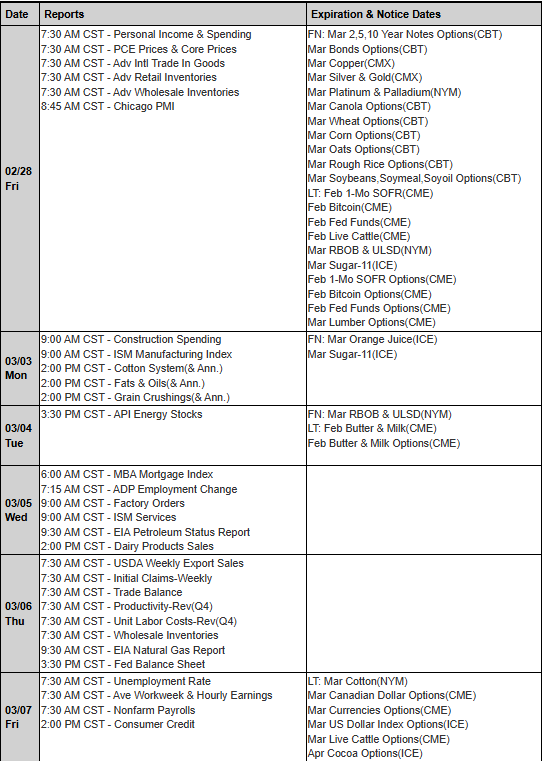
First Notice (FN), Last trading (LT) Days for the Week:

www.mrci.com 

image 5

Improve Your Trading Skills

Get access to proprietary indicators and trading methods, consult with an experienced broker at 1-800-454-9572.

Explore trading methods. Register Here

* This is not a solicitation of any order to buy or sell, but a current market view provided by Cannon Trading Inc. Any statement of facts here in contained are derived from sources believed to be reliable, but are not guaranteed as to accuracy, nor they purport to be complete. No responsibility is assumed with respect to any such statement or with respect to any expression of opinion herein contained. Readers are urged to exercise their own judgement in trading.

Market Alert: Non-Farm Payrolls Tomorrow and Key Contract Deadlines for the Month

Get Real Time updates and more by joining our Private Facebook Group!

Subscribe to our YouTube Channel

Listen to our Market Recap Podcasts on Apple Podcasts


C65

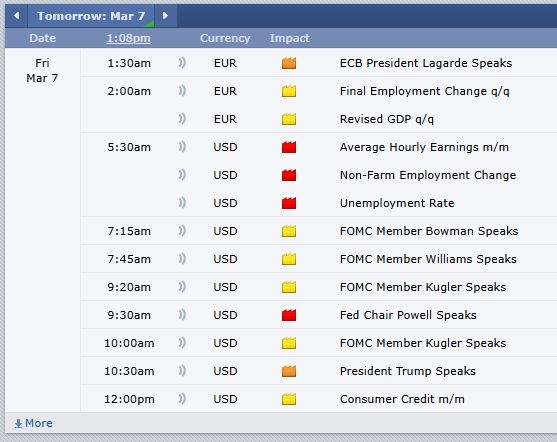
NFP tomorrow at 7:30 AM Central time! Non Farm Payrolls is a market moving event that takes place the first Friday of every month. Be aware and understand this report can impact market behavior. 

Below are the contracts entering First Notice or Last Trading Day for the upcoming month. Be advised that for contracts that are deliverable, it is requested that all LONG positions be exited two days prior to First Notice and ALL positions be exited the day prior to Last Trading Day. If you have any questions, please contact your broker.

stars
7b245251 4ea2 4970 8652 b6e5b91ded92
5dcc87d1 e011 491c aeb2 c757199a4b9f

Daily Levels for October 4, 2024

image

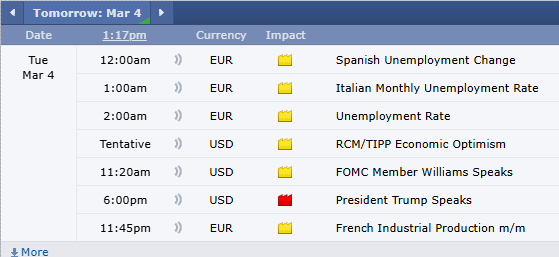
Economic Reports

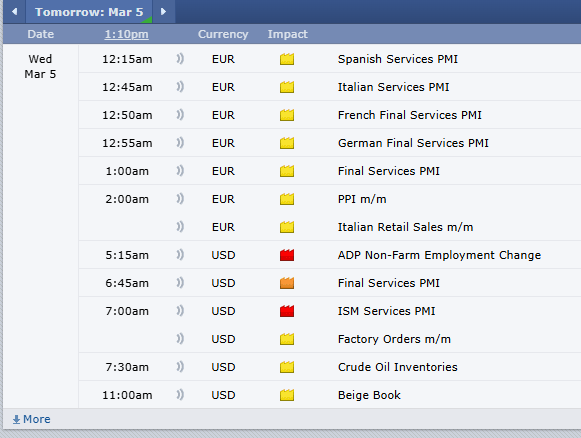
provided by: ForexFactory.com

All times are Eastern Time ( New York)

image 1

Improve Your Trading Skills

Get access to proprietary indicators and trading methods, consult with an experienced broker at 1-800-454-9572.

Explore trading methods. Register Here

3b644da2 2bee 4d39 8d98 5208a20bec39

* This is not a solicitation of any order to buy or sell, but a current market view provided by Cannon Trading Inc. Any statement of facts here in contained are derived from sources believed to be reliable, but are not guaranteed as to accuracy, nor they purport to be complete. No responsibility is assumed with respect to any such statement or with respect to any expression of opinion herein contained. Readers are urged to exercise their own judgement in trading.   #Equities, #Consolidation phase, #Interest rates, #Precious metals, #Gold, #Silver, #US Dollar, #Crude oil prices, #HurricaneHelene, #Middle East tensions, #Chinese stimulus, #Redbook US Retail Sales, #Case Schiller US Metro-Area Home Prices, #Richmond Fed Manufacturing Index, #Service Sector Index, #Consumer Confidence, #New Home Sales, #Micron Technology

E-Mini S&P 500 Futures

E-Mini S&P 500 Futures—a smaller-sized derivative contract based on the Standard & Poor’s 500 Index (also known as standard & poor’s 500 index futures, sp500 index futures, futures sp, standard and poor’s 500 future, futures sp500)—have revolutionized the world of futures trading since their inception. This guide will explore the origins, evolution, and technological advancements surrounding the E-Mini S&P 500 contract. Furthermore, we will examine how cutting-edge tools such as artificial intelligence (AI) are shaping the future of futures trading and why Cannon Trading Company is an excellent choice for those seeking to trade these contracts.

The Origins of E-Mini S&P 500 Futures

A New Era for Futures Contracts

In 1997, the Chicago Mercantile Exchange (CME) introduced the E-Mini S&P 500 Futures (ES) contract to make futures trading more accessible to a broader range of market participants. At the time, traditional S&P 500 futures contracts were large and carried high margins, making them primarily a tool for institutional investors. The introduction of the E-Mini contract significantly reduced the notional value of the contract to a fraction of its full-sized counterpart, allowing both institutional and retail traders to participate.

Key Features of E-Mini Contracts

The E-Mini contract quickly gained popularity due to several core features:

  • Reduced Contract Size: Unlike the full-size sp500 index futures, which had a contract value of 250 times the index, the E-Mini was just 50 times the index. This lower notional value made the contract more manageable for smaller traders.
  • Lower Margin Requirements: With a smaller contract size came lower margin requirements, reducing the capital needed to trade sp500 index futures. This opened the doors for retail traders who had previously been unable to participate in the larger contracts.
  • High Liquidity: From its early days, the E-Mini contract quickly gained liquidity. The S&P 500 is a widely followed index, representing 500 of the largest U.S. companies. Traders were eager to trade a smaller version of the index, which meant deep liquidity and narrow bid-ask spreads.

The Role of Technology in the Growth of E-Mini Futures

As E-Mini futures gained traction, the rise of electronic trading played a crucial role in their growth. The E-Mini futures sp were among the first contracts to be traded electronically, using the CME’s Globex trading platform. Electronic trading provided several advantages over traditional pit trading:

  • 24-Hour Market Access: Traders could access the market nearly 24 hours a day, allowing them to trade futures during global events or after-hours stock market movements.
  • Increased Transparency: Electronic trading brought more transparency to the market, with real-time quotes and market data available to all participants.
  • Faster Execution: The shift from manual order processing in the trading pits to electronic execution reduced the time it took to execute trades, minimizing the risk of slippage and improving trade outcomes for participants.

Evolution of E-Mini Futures with the Internet and AI

The Internet Revolution in Futures Trading

The explosion of internet-based trading platforms in the late 1990s and early 2000s democratized access to the E-Mini standard and poor’s 500 future market. No longer did traders have to be physically present at the exchange or rely on floor brokers to execute their trades. Online brokers emerged, offering individuals and institutions alike a way to trade these contracts from anywhere in the world with just an internet connection.

Some key impacts of the internet on E-Mini futures trading include:

  • Accessibility: Traders of all experience levels gained access to professional-grade trading platforms. Previously, only institutions could afford the technology and resources to access global markets. With online platforms, retail traders could access S&P 500 futures contracts at competitive fees and trade on the same exchanges as institutional players.
  • Market Data and Research: Access to real-time data, news, and technical analysis became available to anyone with an internet connection. The once-secretive tools of institutional traders were now available for retail traders to make informed decisions.
  • Automated Trading: The internet allowed the development of automated trading systems and algorithms. Traders could now automate their strategies, reducing the manual effort required to manage positions in fast-moving markets like S&P 500 futures.

The Role of Artificial Intelligence in Modern Futures Trading

With the rise of artificial intelligence (AI) and machine learning, the futures trading landscape has continued to evolve, and E-Mini standard and poor’s 500 future are no exception. AI’s influence on futures trading has manifested in several ways:

  1. Predictive Analytics

    • AI systems can analyze vast datasets, such as historical price movements, market sentiment, news, and economic indicators, to identify potential patterns in the market. Predictive models help traders gain a better understanding of future market directions and adjust their strategies accordingly.
    • In the context of E-Mini S&P 500 futures, AI algorithms can recognize patterns in stock price correlations, economic data releases, and even global macro events, providing traders with insights on how these factors may impact the broader U.S. equity market.
  2. Automated Strategy Execution

    • AI-powered trading bots and algorithms can manage trades based on pre-set rules and strategies, eliminating human error and emotion from the equation. These bots can identify buy or sell opportunities based on specific criteria such as price levels, volatility, or market sentiment.
    • In fast-moving markets like E-Mini futures, where price changes can happen in milliseconds, AI-based execution ensures that traders do not miss out on opportunities due to latency or slow decision-making.
  3. Sentiment Analysis

    • AI tools have advanced to the point where they can analyze news articles, social media posts, and other forms of digital content to gauge market sentiment. Sentiment analysis allows traders to incorporate this data into their decision-making process.
    • By monitoring social media trends, financial news, and public opinion, AI systems can predict how market sentiment might impact S&P 500 futures. This data-driven approach is especially useful for large-scale investors and hedge funds that need a macro-level view of the market.
  4. Risk Management and Optimization

    • AI’s ability to process and analyze vast quantities of data allows for more precise risk management strategies. Algorithms can assess the risk of open positions in real-time and automatically make adjustments to protect against adverse market movements.

Predictions on How Technology Will Expedite Trade Execution

Looking forward, we can expect further advancements in how technology shapes the execution of E-Mini S&P 500 futures trades. These include:

  • Latency Reduction: As technology improves, trade execution speeds will continue to decrease, reducing the time between placing an order and having it executed on the exchange. Quantum computing may play a role in this as algorithms and data processing speeds are pushed to their limits.
  • AI-Driven Decision Making: Traders will increasingly rely on AI and machine learning algorithms to scan market data, news, and sentiment in real-time, helping them to make more informed decisions at a faster pace.
  • Blockchain and Smart Contracts: The integration of blockchain technology into futures markets could automate the clearing and settlement process, further reducing friction in trade execution. Smart contracts could also ensure that trades are settled instantly without relying on traditional clearinghouses.
  • Cloud-Based Infrastructure: With more trading platforms leveraging cloud computing, traders will have greater access to scalable computing resources, enabling more sophisticated strategies and faster order execution.

Why Cannon Trading Company Is a Wise Choice for Trading E-Mini S&P 500 Futures

Choosing the right broker is crucial for successful futures trading, and Cannon Trading Company stands out as a premier option for trading futures sp500 and related contracts such as E-Mini S&P 500 Futures. Here’s why:

1. Experience and Reputation

Cannon Trading Company has been a reliable name in the futures trading industry for over three decades. With a track record of serving institutional, retail, and professional traders, Cannon has built a strong reputation for delivering excellent service and tailored trading solutions.

2. Advanced Trading Platforms

Cannon Trading provides access to a wide array of top-tier trading platforms, including the CME’s Globex for trading E-Mini futures sp500. The platforms offered include features such as:

  • Advanced Charting Tools: Traders can perform detailed technical analysis using a suite of charting tools to make informed decisions.
  • Automated Trading Capabilities: For those interested in algorithmic trading, Cannon offers platforms that support strategy automation, back-testing, and real-time execution.
  • Customizable User Interface: Tailor the platform to fit your trading style, whether you are day trading or managing longer-term strategies in E-Mini contracts.

3. Competitive Margins and Fees

One of the most important aspects of trading futures is margin requirements. Cannon Trading offers competitive margins for E-Mini S&P 500 futures, allowing traders to enter the market with less capital while still benefiting from significant leverage. Additionally, Cannon provides transparent and competitive commission structures, ensuring that traders don’t face excessive costs when trading high-frequency strategies.

4. Educational Resources

Cannon Trading prides itself on supporting traders with educational resources that enhance their knowledge of the futures market. Whether you are new to trading or an experienced futures trader, Cannon offers webinars, blogs, and market analysis to keep you informed about current market trends and trading strategies.

5. Customer Support

Cannon Trading is renowned for its personalized customer service. Their team of experienced brokers and support staff are available to assist clients with trading questions, platform support, and market insights. This level of service is invaluable, especially for those trading in fast-moving markets like the S&P 500 futures.

6. Regulatory Compliance

As a fully regulated futures brokerage, Cannon Trading adheres to the highest standards of compliance and transparency. This ensures that traders can trust the firm with their capital, knowing that they are operating within a regulated and secure environment.

7. Technology Integration

Cannon Trading has embraced the advancements in trading technology, including algorithmic trading, high-frequency trading, and AI-driven systems. By providing access to platforms that integrate these technologies, Cannon allows traders to stay ahead in an increasingly competitive market.

E-Mini S&P 500 Futures have revolutionized the futures market since their inception in 1997, making the S&P 500 index more accessible to a broader range of traders. The rise of internet-based trading platforms and AI-driven tools has further democratized access, offering retail traders and institutions alike the ability to trade these highly liquid contracts in a fast and efficient manner.

As technology continues to evolve, the future of E-Mini trading will likely see improvements in trade execution speeds, AI-driven market analysis, and the adoption of blockchain technology to streamline clearing and settlement processes. For traders looking to enter this exciting market, Cannon Trading Company provides an ideal platform, offering a combination of advanced technology, personalized support, and competitive pricing.

With Cannon Trading’s resources and expertise, traders of all levels can effectively navigate the ever-evolving world of Standard & Poor’s 500 index futures, taking full advantage of the opportunities offered by E-Mini S&P 500 futures contracts. Whether you are hedging your portfolio, speculating on short-term price movements, or automating your trading strategies, Cannon Trading Company stands out as a wise and reliable choice for your futures trading needs.

For more information, click here.

Ready to start trading futures? Call us at 1(800)454-9572 – Int’l (310)859-9572 (International), or email info@cannontrading.com to speak with one of our experienced, Series-3 licensed futures brokers and begin your futures trading journey with Cannon Trading Company today.

Disclaimer: Trading Futures, Options on Futures, and retail off-exchange foreign currency transactions involve substantial risk of loss and are not suitable for all investors. Past performance is not indicative of future results. Carefully consider if trading is suitable for you in light of your circumstances, knowledge, and financial resources. You may lose all or more of your initial investment. Opinions, market data, and recommendations are subject to change at any time.

Important: Trading commodity futures and options involves a substantial risk of loss. The recommendations contained in this article are opinions only and do not guarantee any profits. This article is for educational purposes. Past performances are not necessarily indicative of future results.

This article has been generated with the help of AI Technology and modified for accuracy and compliance.
Follow us on all socials: @cannontrading

Market Watch: Key Commodities Impacted by Geopolitical Tensions, Longshoremen Strike, and China’s Stimulus

Get Real Time updates and more by joining our Private Facebook Group! Subscribe to our YouTube Channel Listen to our Market Recap Podcasts on Apple Podcasts
C2
 

Bullet Points, Highlights, Announcements

By Mark O’Brien, Senior Broker General:    Keep an eye out for commodity futures broadly, for bullish moves.  Geopolitical tensions and the Iranian missile strike on Israel are dominating the commodity news so far this week.  The most visible reaction was seen in crude oil prices, which pushed higher as fears of supply disruptions escalated. In other news causing unease to a range of commodities futures, the first strike by the International Longshoremen’s Association since 1977 is potentially closing ports from Houston to Boston and once again threatening supply chains. Another key development adding some fundamental bullishness to commodities: China’s largest stimulus package since the pandemic, with the promise of more to come.  Last week, China unleashed a package of monetary and fiscal easing measures, launching China’s benchmark CSI 300 Index 27% from its September lows into fresh bull market territory.  These aggressive actions are already reverberating through global commodity markets.  Iron ore futures have surged over 20% in China. Metals:  After closing above $2,700 per ounce for the first time – an all-time high – last Thursday, December gold eased to $2,677 per ounce at the time of writing.  Overall, gold’s near 7-month price increase reflects traders’ bullishness amid the current geopolitical tensions and the prospect of more interest rate cuts in the U.S. Energies:  Despite the recent reaction by crude oil related to the aforementioned geopolitical tensions, in a monthly Reuters poll released Monday, 41 analysts and economists cut their 2024 oil price forecasts for a fifth consecutive month.  Weaker demand and uncertainty over OPEC’s plans were cited.  In April, driven by Middle East tensions and OPEC+ supply cuts, oil prices surged past $90 a barrel.   Since then, declining demand trends have led to an supply overhang and crude oil has reversed course, dipping below $70 per barrel this month. Important heads up:   it’s that time of the month again: we’re a couple of days from when the Labor Dept. releases its monthly Non-farm payrolls report.  It’s widely considered to be one of the most important and influential measures of the U.S. economy and the report is released at 7:30 A.M., Central Time on the first Friday of the month. To review, the Labor Dept.’s Bureau of Labor Statistics surveys about 141,000 businesses and government agencies, representing approximately 486,000 individual work sites.  The report excludes farm workers, private household employees, domestic household workers and non-profit organization employees.  The report also includes other detailed industry data including the overall unemployment rate as a percentage of the total labor force that is unemployed but actively seeking work, wages, wage growth and average workday hours.   Side note:  Power is only one of the worries for the survivors of Hurricane Helene – in so many of the Appalachian towns and other hard-hit areas.  Those in the hurricane’s wake are struggling to access clean water, safe shelter, clear roads, gasoline and food, among other necessities.  With that said, as of Wednesday morning, more than 1.2 million outages remain across the region.   Here are some of the latest figures on the number of reported outages:  
  • Florida 42,321
  • Virginia 44,850
  • North Carolina 347,118
  • Georgia 363,340
  • South Carolina: 491,105
 
stars
   

Daily Levels for October 3, 2024

9680bb1c 039c 476b 9288 2036ace661ac   Economic Reports provided by: ForexFactory.com All times are Eastern Time ( New York)
eaca73c4 5ec4 43a6 973b 6bb115e48b03

Improve Your Trading Skills

Get access to proprietary indicators and trading methods, consult with an experienced broker at 1-800-454-9572. Explore trading methods. Register Here
3b644da2 2bee 4d39 8d98 5208a20bec39
* This is not a solicitation of any order to buy or sell, but a current market view provided by Cannon Trading Inc. Any statement of facts here in contained are derived from sources believed to be reliable, but are not guaranteed as to accuracy, nor they purport to be complete. No responsibility is assumed with respect to any such statement or with respect to any expression of opinion herein contained. Readers are urged to exercise their own judgement in trading.   #Equities, #Consolidation phase, #Interest rates, #Precious metals, #Gold, #Silver, #US Dollar, #Crude oil prices, #HurricaneHelene, #Middle East tensions, #Chinese stimulus, #Redbook US Retail Sales, #Case Schiller US Metro-Area Home Prices, #Richmond Fed Manufacturing Index, #Service Sector Index, #Consumer Confidence, #New Home Sales, #Micron Technology

Market Volatility Rises Amid Longshoreman Strike and Middle East Tensions

Get Real Time updates and more by joining our Private Facebook Group! Subscribe to our YouTube Channel Listen to our Market Recap Podcasts on Apple Podcasts
C73
  Movers and Shakers By John Thorpe, Senior Broker Long Shoreman Strike / Israel Struck Activity today was volatile both for Equities and outside markets. The Beast awoke at 9 a.m. eastern on queue, when equity futures prices sank, simultaneously rallying Crude oil and Metals futures, Gold and Silver leading the charge. As the threats turned into reality of both Strikes occurring, 200 shells lobbed from Iran were, in large part intercepted with minimal damage and loss of life. The unsettling potential effects to the supply chain and the conflicts in middle east potentially leading to an Iranian attempt at a Straights of Hormuz Blockage sending Crude oil Up over $3.00/bbl before settling down to just 2 bucks higher.. as the markets expanded early to mid day, cooler heads seemed to prevail, the markets contracted as they absorbed the headlines..     Movers and shakers! Today’s News: Updated: October 1, 2024 7:37 am “The Administration is taking action to monitor and address potential impacts on consumers due to labor disputes at East Coast and Gulf Coast ports. Our analysis shows we should not expect significant changes to food prices or availability in the near term. Thanks to the typically smooth movement through the ports of goods, and our strong domestic agricultural production, we do not expect shortages anytime in the near future for most items. Likewise, non-containerized bulk export shipments, including grains, would be unaffected by this strike. For meat and poultry items that are exported through East and Gulf Coast ports, available storage space and re-direction of products to alternative domestic and international markets can alleviate some of the pressure on farmers and food processors. We are keeping an eye on downstream impacts in the west, and we will continue to monitor and work with industry to respond to potential impacts. Our Administration supports collective bargaining as the best way for workers and employers to come to a fair agreement, and we encourage all parties to come to the bargaining table and negotiate in good faith—fairly and quickly.”   Updated: October 1, 2024 7:55 am Redbook Weekly US Retail Sales Headline Recap   **Redbook Weekly US Retail Sales were +5.2% in the first four weeks of September 2024 vs September 2023 **Redbook Weekly US Retail Sales were +5.3% in the week ending September 28 vs yr ago week Updated: October 1, 2024 8:37 am The September Purdue University Ag Economy Barometer recorded its lowest readings since March 2016 at 88 down from 100 in the prior month. Declining income expectations pushed farmer sentiment down, and the Index of Future Expectations dropped 14 points to 94. The Index of Current Conditions also fell to 76 from 83 in the prior month, which nearly matched levels seen in April 2020, during the height of COVID-19 concerns for farmers.   Updated: October 1, 2024 9:01 am Institute of Supply Management (ISM) US Manufacturing Headline Recap   **ISM US September Manufacturing Composite Index: 47.2 ; expected 47.4 ; prior month 47.2 **ISM US September Manufacturing Prices Paid: 48.3 vs prior month 54.0 **ISM US September Manufacturing Employment: 43.9 vs prior month 46.0 **ISM US September Manufacturing New Orders: 46.1 vs prior month 44.6 **ISM US September Manufacturing Inventories: 43.9 vs prior month 50.3 **ISM US September Manufacturing Production: 49.8 vs prior month 44.8 Updated: October 1, 2024 8:46 am US Job Openings and Labor Turnover Survey (JOLTS) data for August 2024 will be released this morning around 9:00 am CT. Last month’s report estimated the end of July job openings at 7.673 million.       Watch Tomorrow’s Movers and Shakers: 4 fed Speakers Hammack, Musalem, Bowman and Barkin during market hours .       Earnings: only 9 headed by ConAgra  
stars
   

Daily Levels for October 2, 2024

7bb92725 71e2 4cbe bd20 c27d694214a4 Economic Reports provided by: ForexFactory.com All times are Eastern Time ( New York)
7f47bc1c 7cd8 4eb0 8a63 ec41948eb3d6

Improve Your Trading Skills

Get access to proprietary indicators and trading methods, consult with an experienced broker at 1-800-454-9572. Explore trading methods. Register Here
3b644da2 2bee 4d39 8d98 5208a20bec39
* This is not a solicitation of any order to buy or sell, but a current market view provided by Cannon Trading Inc. Any statement of facts here in contained are derived from sources believed to be reliable, but are not guaranteed as to accuracy, nor they purport to be complete. No responsibility is assumed with respect to any such statement or with respect to any expression of opinion herein contained. Readers are urged to exercise their own judgement in trading.   #Equities, #Consolidation phase, #Interest rates, #Precious metals, #Gold, #Silver, #US Dollar, #Crude oil prices, #HurricaneHelene, #Middle East tensions, #Chinese stimulus, #Redbook US Retail Sales, #Case Schiller US Metro-Area Home Prices, #Richmond Fed Manufacturing Index, #Service Sector Index, #Consumer Confidence, #New Home Sales, #Micron Technology

Portfolio Shifts: Navigating the Start of a New Interest Rate Cycle

Get Real Time updates and more by joining our Private Facebook Group! Subscribe to our YouTube Channel Listen to our Market Recap Podcasts on Apple Podcasts
C95
 

The beginning of an interest rate cycle

September 30, 2024 by GalTrades.com The beginning of an interest rate cycle causes portfolio managers to reevaluate what’s in their portfolio. Stock valuations are fully priced, as long as the economic data continues to support the case for a soft-to- (potentially) no landing, it seems the path of least resistance continues to be higher. However, the bulls will likely need Q3 earnings, which start in about two weeks, to come in relatively strong to support current valuations. China stocks recorded one of the largest weekly gains on record. In the U.S., several industries that potentially benefit from China’s stimulus plan, such as materials and industrials, outperformed this week. The China story can put a floor for steel prices. China issued the most stimulus package since COVID, Analysts are saying this is the first inning. The rate cut, lower interest rate, cutting down payment for investment properties by 10%, 140 billion in new lending, they are focused on consumption stimulus. And the Government said they are committed to more, that should lead to better growth. Portfolio managers have been very underweight and unexposed to China. they have to jump in otherwise their clients may complain. As of now it should be a trade for a few months. Whether this is a long-term play remains to be seen. Stocks and ETF’s that so upside momentum from the China trade, FXI, KWEB, BABA, JD, LI, PDD, BIDU, NTES, FCX, ETN, WYNN, LVS (63% of LVS revenue is in Macau, they are due to stop spending on renovations early 24) View my YouTube from last week regarding KWEB and where I see the ETF next targets according to technical analysis. Positives signs for the market: GDP estimates point to a healthy economy 3.1 % real GDP pace, there was a huge increase in wealth 16 straight months of wage gains, should be continued momentum for our economy. On the other hand, strategist forecast relative to where the market is trading now are the most bearish 5483 which is 5% below where the S&P500 is currently at. This week’s economic data was mostly bullish for equity markets: this morning’s inflation data helps support the case that inflation is on track toward the Fed’s 2.0% target; jobless claims continue to come in below estimates; and Points to consider: The market wants to melt up some more, first because the Fed will likely loosen monetary policy further. The Fed’s dot plot outlined several more cuts to come; high rates need to come down to support economic growth. That all but guarantees that the economy will stay in growth mode and won’t hit recession any time soon. Lower rates would only boost consumer spending on housing and other goods and services—a demand picture that will spur investment from companies, helping the industrial economy specifically. As long as the market envisions this growth trajectory, it can stay up. S&P 500 trades at 21 times expected earnings for the coming 12 months, the high end of its range since the Fed moved rates up from 0% in early 2022. But earnings are increasing. The index is currently trading at less than 21 times expected 2025 earnings of $276 a share according to FactSet, so the index could hold strong through the end of this year. Earnings per share for the index could grow 14% annually to $310 in 2026. As long as cost inflation—such as moderate increases in wages and salaries, isn’t too burdensome companies could increase their profit margins a bit. Next week we only have a few earnings reports. so, the focus will likely remain on the economic data. Friday’s monthly jobs data will be the highlight, but Tuesday’s JOLTS report will provide an important read on the labor market. .The S&P sold off following the release of the last two monthly jobs reports (-1.8% & -1.7% respectively). In the days leading up to Friday’s report however we shouldn’t expect too much volatility. And depending on the jobs data report we’re probably going higher or lower. There is an upcoming negotiation deadline (Monday at midnight) between East Coast dock worker unions and terminal operators which could result in a strike. If the dock workers end up striking, this may put some selling pressure on stocks because of the potential inflationary impact on goods prices. Lots of talk about jeans trends these days keep an eye out for Levi Strauss & Co. (LEVI) reporting on Wednesday. Nike Inc. (NKE) is reporting on Monday, China is 15% of Nike sales. The market is powered by the rotation, look at the fallowing ETFs for confirmation: RSP is the equal weight, IJR is mid cap and IWM is small cap, industrial, materials energy & Cyclical were amongst the strongest this week, we want to see continued upside. Is this market priced to perfection? It seems so; therefore, we need to keep an eye on earnings and economic data. META new all-time highs, ETN is a part of data center energy infostructure story. If your building data centers, you need industrial earth moving equipment as well. The Russell 2000 the index appeared to be breaking out of a bull flag formation. If the RUT is able to clear its prior 52-week high from back in July, this could shift the “rotation trade” into a higher gear and would likely be viewed as a bullish confirmation for the overall economy. On a technical level, the NDX filled the July 17 GAP, the SPX RSI on a weekly chart has lower high’s which is concerning given the fact that its not supporting the SPX move higher. Due to the technical issues, I see and the fact that a lot of indicators are very stretched I think one should trade with extreme caution.    
stars
  bf16a2d2 9cca 4fd2 8218 b6f09a1f3cbd

Daily Levels for October 1, 2024

165fa17a 8a06 4b1c 945f 606251e469ed   Economic Reports provided by: ForexFactory.com All times are Eastern Time ( New York)
1cd5e6d8 786f 4d47 bdc6 0bc6f3230751

Improve Your Trading Skills

Get access to proprietary indicators and trading methods, consult with an experienced broker at 1-800-454-9572. Explore trading methods. Register Here
3b644da2 2bee 4d39 8d98 5208a20bec39
* This is not a solicitation of any order to buy or sell, but a current market view provided by Cannon Trading Inc. Any statement of facts here in contained are derived from sources believed to be reliable, but are not guaranteed as to accuracy, nor they purport to be complete. No responsibility is assumed with respect to any such statement or with respect to any expression of opinion herein contained. Readers are urged to exercise their own judgement in trading.   #Equities, #Consolidation phase, #Interest rates, #Precious metals, #Gold, #Silver, #US Dollar, #Crude oil prices, #HurricaneHelene, #Middle East tensions, #Chinese stimulus, #Redbook US Retail Sales, #Case Schiller US Metro-Area Home Prices, #Richmond Fed Manufacturing Index, #Service Sector Index, #Consumer Confidence, #New Home Sales, #Micron Technology

Weekly Newsletter – Trading Resources and more! 09.30.24

Get Real Time updates and more by joining our Private Facebook Group!
Subscribe to our YouTube Channel

Cannon Futures Weekly Letter Issue # 1210

In this issue:

  •  Important Notices – Heavy Fed Speaking, Active Data, Few Earnings
  • Futures 101 – Daily research and Insight
  • Hot Market of the Week – July/December Corn Spread
  • Broker’s Trading System of the Week – NQ Day Trading System
  • Trading Levels for Next Week
  • Trading Reports for Next Week


Important Notices – Next Week Highlights:


The Week Ahead

Non-Farm Payrolls, Many Fed Speakers within a very active Data week.

Earnings? Not so much  only 129 company’s reporting the largest by market cap will be Nike after the Tuesday close, PayChex come in second place pre-open Tuesday.


Fed Speak:

  • Mon. Bowman
  • Tues. Bostic, Cook, Barkin
  • Wed. Hammack, Musalem, Bowman, Barkin
  • Thu. Bostic
  • Fri. Williams


Big Economic Data week:

  • Mon. Chicago PMI, Dallas Fed Munufaturing Index,
  • Tues. JOLTS,RedBook,S&P Final PMI, ISM PMI
  • Wed. ADP, Chicago PMI, Pending Home Sales
  • Thur. Continuing Jobless Claims, Factory Orders, Fed Balance Sheet
  • Fri. Non Farm Payrolls

How to Rollover on the E-Futures Platform video below

thumbnail?url=https%3A%2F%2Fi.vimeocdn


  • Futures 101: Daily Research

    • Specific price points for shorter term, medium term and longer term
    • Detailed chart analysis
    • Audio brief summary as well as more detailed PDF summary
    • View insight into Gold, Mini SP, Crude Oil, Corn, feeder Cattle, Live Cattle, Wheat, Hogs and more!

    To sign up and get two weeks FULL access, start by requesting the free trial below.

    Once you sign up, you will be set up for FULL access within one business day and be able to access and see information like the sample in the screen shot below.


stars

3b644da2 2bee 4d39 8d98 5208a20bec39


    • Hot Market of the Week – December Gold

    Hot market of the week is provided by QT Market Center, A Swiss army knife charting package that’s not just for Hedgers, Cooperatives and Farmers alike but also for Spread traders, Swing traders and shorter time frame application for intraday traders with a unique proprietary indicator that can be applied to your specific trading needs.

    FREE TRIAL AVAILABLE

    July / December Corn Spread

    ed3cd883 0614 42b9 a58d 7abf06d93539

    The July – Dec corn spread activated upside PriceCount objectives off the July low and satisfied the first count early this month before consolidating with a sideways trade. From here, IF the chart can resume its rally with new sustained highs, the second count would project a possible run to the +3 1/2 area.


    PriceCounts – Not about where we’ve been, but where we might be going next!

The PriceCount study is a tool that can help to project the distance of a move in price. The counts are not intended to be an ‘exact’ science but rather offer a target area for the four objectives which are based off the first leg of a move with each subsequent count having a smaller percentage of being achieved. It is normal for the chart to react by correcting or consolidating at an objective and then either resuming its move or reversing trend. Best utilized in conjunction with other technical tools, PriceCounts offer one more way to analyze charts and help to manage your positions and risk. Learn more at www.qtchartoftheday.com
Trading in futures, options, securities, derivatives or OTC products entails significant risks which must be understood prior to trading and may not be appropriate for all investors. Past performance of actual trades or strategies is not necessarily indicative of future results.

   Broker’s Trading System of the Week

With algorithmic trading systems becoming more prevalent in portfolio diversification, the following system has been selected as the broker’s choice for this month.

Sound of Freedom

PRODUCT

NQ – mini NASDAQ 100


SYSTEM TYPE

Day Trading


Recommended Cannon Trading Starting Capital

$25,000


COST

USD 115 / monthly


Recommended Cannon Trading Starting Capital

$25,000.00


COST

USD 150 / monthly

Get Started

Learn More

5f04b72f 0ca1 4ed2 bdae 1cc7f869c1f3

The performance shown above is hypothetical in that the chart represents returns in a model account. The model account rises or falls by the average single contract profit and loss achieved by clients trading actual money pursuant to the listed system’s trading signals on the appropriate dates (client fills), or if no actual client profit or loss available – by the hypothetical single contract profit and loss of trades generated by the system’s trading signals on that day in real time (real‐time) less slippage, or if no real time profit or loss available – by the hypothetical single contract profit and loss of trades generated by running the system logic backwards on back adjusted data. Please read full disclaimer HERE.
Would you like to receive daily support & resistance levels?
Yes
S
No
S

Daily Levels for September 30th, 2024

bcaece5d e01e 433a 91ff af5b93fe5eac


Trading Reports for Next Week

eb3ed378 f240 4b54 9aa5 50b1d43cfaf9

bf9b3e0d 9c23 44e8 980c a8c01bfbe2cf

Trading Reports for Next Week

First Notice (FN), Last trading (LT) Days for the Week:
8d4a62d2 94d9 4a70 b445 139a624902b2

Improve Your Trading Skills

Get access to proprietary indicators and trading methods, consult with an experienced broker at 1-800-454-9572.

Explore trading methods. Register Here

* This is not a solicitation of any order to buy or sell, but a current market view provided by Cannon Trading Inc. Any statement of facts here in contained are derived from sources believed to be reliable, but are not guaranteed as to accuracy, nor they purport to be complete. No responsibility is assumed with respect to any such statement or with respect to any expression of opinion herein contained. Readers are urged to exercise their own judgement in trading.

Key Economic Data Ahead: PCE & Inflation Expectations in Focus

Get Real Time updates and more by joining our Private Facebook Group!

Subscribe to our YouTube Channel

Listen to our Market Recap Podcasts on Apple Podcasts


C75

  PCE tomorrow is watched closely by the FED and traders followed by Univ. of Michigan inflation expectations.

Natural gas outlook below for your review

Plan your trade and trade your plan  

stars


November Natural Gas   November natural gas activated upside PriceCount objectives off the September low. The chart quickly has completed the first objective where we are getting a reaction with a near term correction/consolidation trade. At this point, if you can resume the rally with new sustained highs, the second count would project a potential run to the 3.02 area.

91f9b6ce 69b2 41be a7c6 cf99a13d29a8   The PriceCount study is a tool that can help to project the distance of a move in price. The counts are not intended to be an ‘exact’ science but rather offer a target area for the four objectives which are based off the first leg of a move with each subsequent count having a smaller percentage of being achieved. It is normal for the chart to react by correcting or consolidating at an objective and then either resuming its move or reversing trend. Best utilized in conjunction with other technical tools, PriceCounts offer one more way to analyze charts and help to manage your positions and risk. Learn more at www.qtchartoftheday.com Trading in futures, options, securities, derivatives or OTC products entails significant risks which must be understood prior to trading and may not be appropriate for all investors. Past performance of actual trades or strategies is not necessarily indicative of future results

Daily Levels for September 27, 2024

f7aadad0 a031 446f 9f17 2a7a71d62fc3

Economic Reports

provided by: ForexFactory.com

All times are Eastern Time ( New York)

8f1d098e 0580 4fe3 96c2 d26aa62764a4

Improve Your Trading Skills

Get access to proprietary indicators and trading methods, consult with an experienced broker at 1-800-454-9572.

Explore trading methods. Register Here

3b644da2 2bee 4d39 8d98 5208a20bec39

* This is not a solicitation of any order to buy or sell, but a current market view provided by Cannon Trading Inc. Any statement of facts here in contained are derived from sources believed to be reliable, but are not guaranteed as to accuracy, nor they purport to be complete. No responsibility is assumed with respect to any such statement or with respect to any expression of opinion herein contained. Readers are urged to exercise their own judgement in trading.   #Equities, #Consolidation phase, #Interest rates, #Precious metals, #Gold, #Silver, #US Dollar, #Crude oil prices, #HurricaneHelene, #Middle East tensions, #Chinese stimulus, #Redbook US Retail Sales, #Case Schiller US Metro-Area Home Prices, #Richmond Fed Manufacturing Index, #Service Sector Index, #Consumer Confidence, #New Home Sales, #Micron Technology

Quick Videos on Trading Techniques + Futures Trading Levels for 9.25

Get Real Time updates and more by joining our Private Facebook Group! Subscribe to our YouTube Channel Listen to our Market Recap Podcasts on Apple Podcasts
C37
 

Trading Videos

Instant Viewing

Watch a series of short videos, where our VP, Ilan Levy-Mayer shares his personal preferences and opinions on different trading topics.

  • Ever wondered when to exit a trade? Take a look at what Ilan has to share on Bollinger Bands and a study called PARABOLICS
  • Some common uses you can make of support and resistance levels.
  • Filter out the noise with range bar charts
  • “Price Confirmation”

WATCH NOW

 
stars
     

Daily Levels for September 26, 2024

1088a659 e5de 42bc 8e24 66ef19a6e359 Economic Reports provided by: ForexFactory.com All times are Eastern Time ( New York)
f631f965 3216 44b0 a79b df7a62871290

Improve Your Trading Skills

Get access to proprietary indicators and trading methods, consult with an experienced broker at 1-800-454-9572. Explore trading methods. Register Here
3b644da2 2bee 4d39 8d98 5208a20bec39
* This is not a solicitation of any order to buy or sell, but a current market view provided by Cannon Trading Inc. Any statement of facts here in contained are derived from sources believed to be reliable, but are not guaranteed as to accuracy, nor they purport to be complete. No responsibility is assumed with respect to any such statement or with respect to any expression of opinion herein contained. Readers are urged to exercise their own judgement in trading.   #Equities, #Consolidation phase, #Interest rates, #Precious metals, #Gold, #Silver, #US Dollar, #Crude oil prices, #HurricaneHelene, #Middle East tensions, #Chinese stimulus, #Redbook US Retail Sales, #Case Schiller US Metro-Area Home Prices, #Richmond Fed Manufacturing Index, #Service Sector Index, #Consumer Confidence, #New Home Sales, #Micron Technology