Cannon Futures Weekly Letter Issue # 1068
Dear Traders,
Day Trading Mind Traps
“One way our brain helps keep us safe is to protect us from an awareness of our weaknesses. The brain believes that it is better to be falsely confident than recognize the real risks. This protective mechanism tends to work against us in trading.” Kenneth Reid, Ph.D
MINDING THE MIND
The mind can play tricks on us. Intuitive Trading is an attempt to mind read the market, which makes us susceptible to whipsaws. Hindsight Bias causes traders to underestimate the difficulty of trading, while Competency Bias causes us to over-estimate our abilities. These are mental banana peels that set us up for a fall.
INTUITIVE TRADING
Intuitive trading is a natural response to excessive randomness and non-linearity in the market. But making informed guesses is not the same as formulating a rule-based pattern-recognition system that gives a trader a true edge. Without a rule-based plan, intuitive traders expend a great deal of energy mindreading the market, which will not improve your odds of success. In fact, professional traders make a good living exploiting the emotionally-driven behavior of intuitive amateurs.
- Order Flow
- Where are the large orders?
- Heat Map?
- Tools for day-traders
- More….
Trading 101: Free Course – An Introduction to Crude Oil
Good Trading
Trading Futures, Options on Futures, and retail off-exchange foreign currency transactions involves substantial risk of loss and is not suitable for all investors. You should carefully consider whether trading is suitable for you in light of your circumstances, knowledge, and financial resources. You may lose all or more of your initial investment. Opinions, market data, and recommendations are subject to change at any time when it comes to Futures Trading.
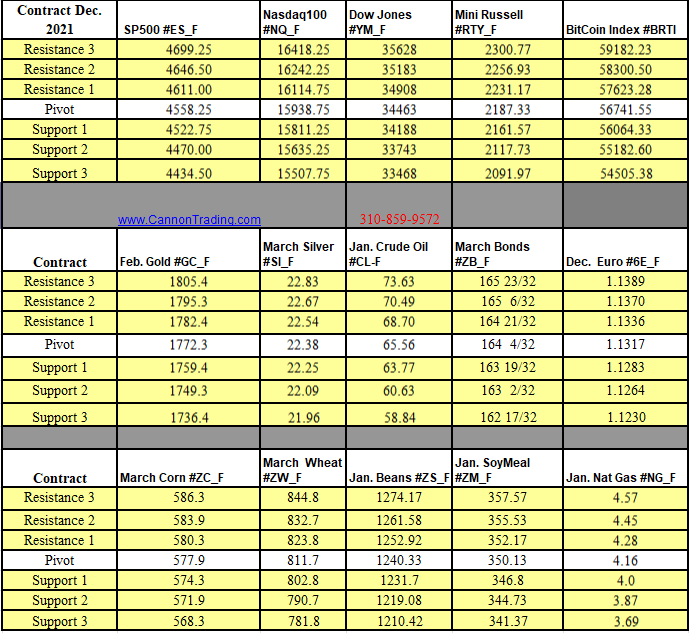
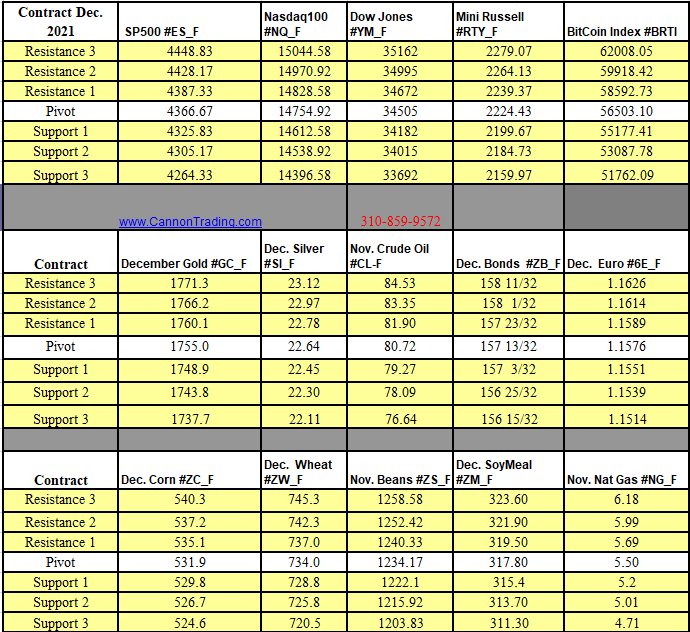
Futures Trading Levels
09-27-2021

Weekly Levels


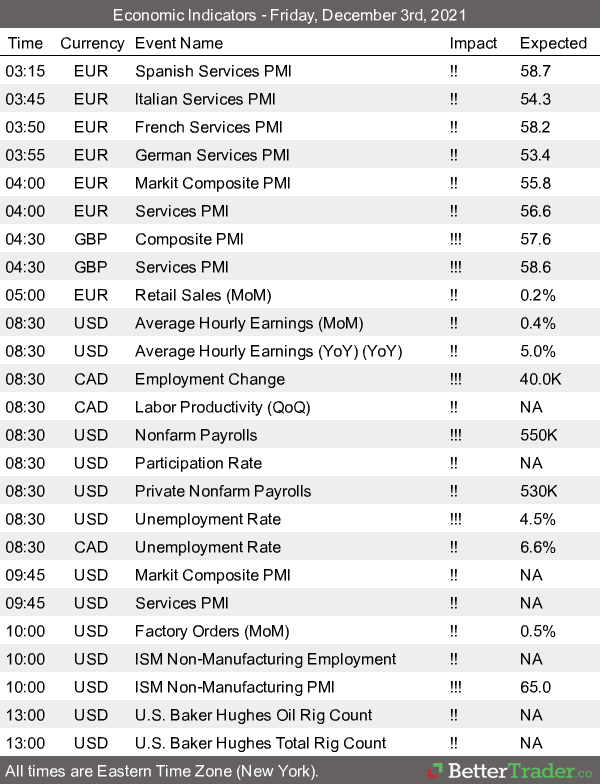
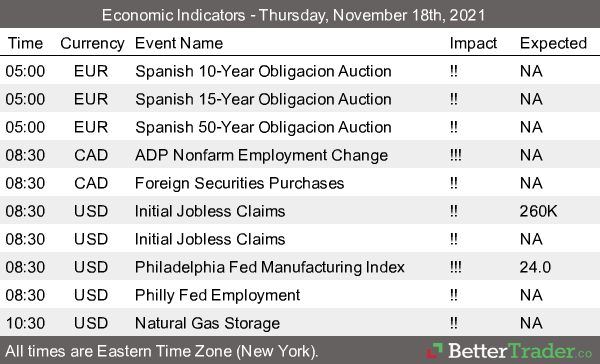
Reports, First Notice (FN), Last trading (LT) Days for the Week:
https://mrci.com
Date Reports/Expiration Notice Dates

This is not a solicitation of any order to buy or sell, but a current market view provided by Cannon Trading Inc. Any statement of facts here in contained are derived from sources believed to be reliable, but are not guaranteed as to accuracy, nor they purport to be complete. No responsibility is assumed with respect to any such statement or with respect to any expression of opinion herein contained. Readers are urged to exercise their own judgement in trading