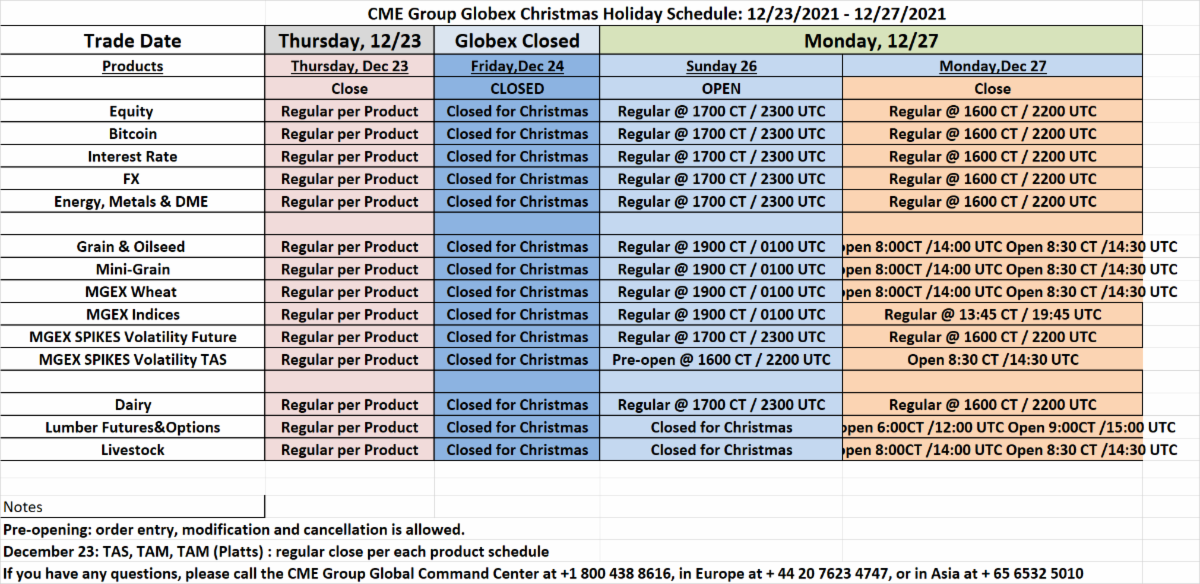
2021 Key Takeaways with Craig Bewick of the CMEGroup.com
- S&P 500 and Nasaq-100 futures prices were up by over 20%; E-mini S&P 500 options implied volatility is trading at just about the same level as it was a year ago
- Even though it’s trading well off its highs of the year, WTI Crude Oil futures prices are up by nearly 50%
- Gold futures prices were a bit “range bound” this year. However, if we look at implied volatility as one measure of potential price movement, the average closing 30-day implied volatility in 2021 was nearly equal to the average closing level since December of 2011. Also, if we look at it by year, the average closing level in 2021 was 14.2%; higher than 2017 (10.7%), 2018 (9.8%) and 2019 (10.8%).
- US Treasury yields increased. The 10-Year yield is up from under 1% to nearly 1.5%. We used data from the St. Louis Fed to get the 12/31/21 value and compared it to the current 10-Year Micro Yield futures price so it’s not perfect, but does provide an indication of the yield increase. Of course, as Jim Iuorio pointed out in a recent Yield Insights video that was published here, the last time inflation readings were at the current levels, the 10-Year yield was near 12%.
- Soybean futures prices, after a year of historic volatility, wound up almost unchanged on the year. We downloaded data from QuikStrike to verify this and included the graph below in which the orange line depicts the price level at the beginning and end of the year.
- Natural Gas futures prices have also been characterized by historic volatility and, even though they are trading well below this year’s high levels, are still 50% higher than a year ago
- In a year that saw CME launch several new cryptocurrency products, Bitcoin has increased in price by about 66% and implied volatility, while still among the highest compared to other CME options products, has come down from over 100% to about 78%
Trading Futures, Options on Futures, and retail off-exchange foreign currency transactions involves substantial risk of loss and is not suitable for all investors. You should carefully consider whether trading is suitable for you in light of your circumstances, knowledge, and financial resources. You may lose all or more of your initial investment. Opinions, market data, and recommendations are subject to change at any time when it comes to Futures Trading.
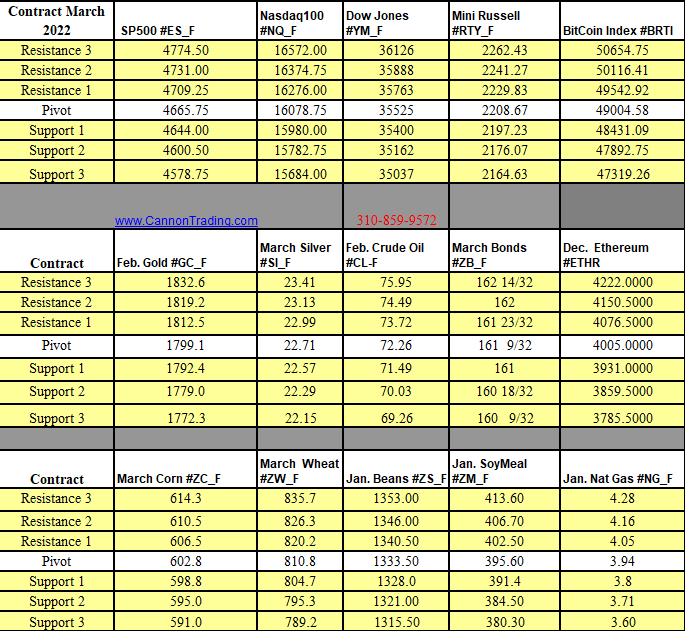
Futures Trading Levels
12-23-2021
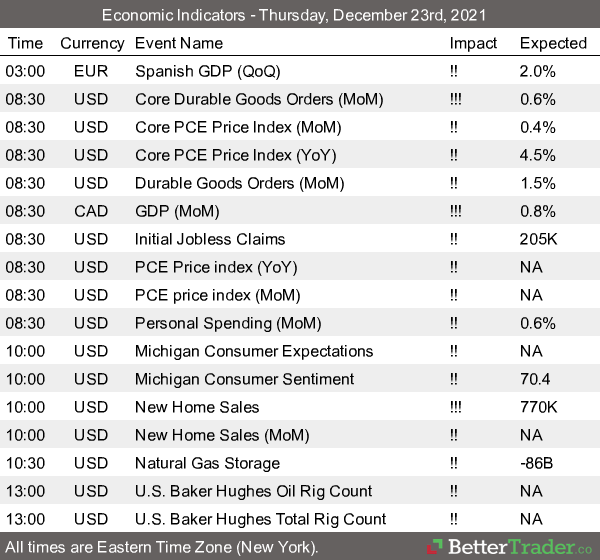
Economic Reports, Source:
This is not a solicitation of any order to buy or sell, but a current market view provided by Cannon Trading Inc. Any statement of facts here in contained are derived from sources believed to be reliable, but are not guaranteed as to accuracy, nor they purport to be complete. No responsibility is assumed with respect to any such statement or with respect to any expression of opinion herein contained. Readers are urged to exercise their own judgement in trading.