Day Trading Comex Gold Futures
(Contrary to Conventional Wisdom)
By: John Thorpe, Cannon Trading Senior Broker
Markets are forward looking. Today’s price is as much a reflection of yesterday’s fears, needs , wants and desires as the current reaction to a political leader rattling sabers, or the effect that a surprise Government Report will have on the prices of a security or commodity.
Contrary to conventional wisdom, Day Traders tend to be well educated and well capitalized.
Risk takers, by any other name, Wildcat oil drillers? Computer geeks working out of their parent’s garage? Mom and Pop managing their hard earned 401k’s; The Day trading approach is not very different from any other investing approach, with one major distinction from other risk takers who operate on a much greater time horizon. As a day trader, you open an investment and close an investment between sunup and sundown and often many times during a market session. One of the greatest risks that day traders must avoid is gauging their success or failure within that same sunup to sundown time frame. I like to call this a fiction trap. A fiction trap occurs when the day trader believes that once he has a good day trading, his subsequent days will always yield the same results. The fiction trap results in unrealistic expectations for success. The Market, like the ocean current, is sometimes similar in repetition, but rarely identical in motion. When risk takers begin the process of assessing a strategy, they do it with the long view in mind.
By taking a longer view of returns, like all other risk takers, you can avoid the fiction trap of unrealistic expectations by incorporating the Rule of 72 into your long-range plans. The Rule of 72 is a formula that tells you how quickly (given a rate of return) it will take for your account size to double. Although your account size can double in one day trading futures, it is rare to hold on to those gains. The Rule of 72 forces you to be patient, emotionally subdued, and in line with long-term goals.
As with any risk taking, timing is key. A day trader needs to become: a scientist, a student of the discipline, a tester, a collector of data, and an executer of plans.
With any project, the scientist keeps good notes and uses the microscope (technical indicators, charts, et al.) to determine the intersections of volume, price. This approach yields more accurate results than a random approach, such as throwing darts at the WSJ securities settlement page to find the correct asset and the correct position. Doing the homework and creating a practical plan should lead to positive results.
I like day trading in the Futures markets because with no more effort than buying a position, you can just as easily sell to open a new position. In other words, if you have ever sold a stock or ETF short, you know you can short the asset by requesting from the stock loan department shares of a stock to borrow so you can short it. Now patiently for an uptick to assume your position. This can be a time-wasting exercise when split-second decision making is required. For this reason and this reason alone, day trading futures makes far greater sense than day trading stocks or ETF’s.
What I want to accomplish with you in this draft is to lay out a blueprint for day trading the NY Comex 100 oz. Gold futures contract, traded electronically through Globex.
Factors Affecting Gold Prices
As part of the road map to the price discovery process, be aware of the London fixing times, or ocean currents, then can determine our Comex Gold prices. You can find charts and data points available like the one below from the U.S. St Louis Fed
https://fred.stlouisfed.org/series/GOLDAMGBD228NLBM
You may find, upon research, that you have an identifiable price pattern around these times in the Comex market equivalents. Allow your research to guide you. These prices from London represent settlement prices for the fabricators, miners, hedgers and speculators from which they close their daily business dealings. These fixings are as variable as the US Market prices are for gold. The US Market pays attention to the London market, and although not fungible, they are interchangeable in price discovery. London watches Comex and Comex watches London. The auctions are run at 10:30am and 3:00pm London Time for gold and 12:00pm London time for silver. The final auction prices are published to the market as the LBMA Gold Price AM, The LBMA Gold Price PM and the LBMA Silver Price Benchmarks.
Scarcity or the perception of scarcity and lack thereof drives market sentiment.
Markets are forward looking. Today’s price is as much a reflection of yesterday’s fears as anything else. So we need to anticipate market price impact from Governmental reports, increases and decreases in potential supply or demand,
Central banks have quite a bit to do with the value of the “Yellow Metal” based on how they perceive the underlying economy’s strengths and weaknesses and whether they print money or not, by increasing or decreasing the velocity of the sovereign nations’ cash supply. When a Central bank adjusts the Nation’s supply of dollars of their native currency, Gold will typically behave reciprocally: More dollars in circulation, value of gold increases, fewer dollars in circulation, the value of gold decreases.
During large chunks of the 20th century, the world’s central banks were net suppliers of gold. After spending their early history accumulating gold to back up national currencies, central banks sold more gold than they purchased after the U.S. dollar became the de facto world reserve currency under the Bretton Woods Agreement.
In recent years, however, the trend has changed. Central banks have become net demanders of gold, which puts upward pressure on both production and retail costs. As some sovereign currency markets are in a constant to variable state of flux and turmoil due to political upheaval or disequilibrium in their balance of trade and payments, investors residing in these countries buy gold to use as a safe haven asset to offset the risk of holding their assets in their sovereign currency.
As with any worthwhile endeavor, a true student of any process understands addtional research should be done to thoroughly understand the potential risks and rewards from either day trading or position trading, or with equal vigor, engaging in short term or longer term investing of any kind.
As Greek philosopher Aristotle thoughtfully observed and written for us to learn from over 2000 years ago, “Bring your desires down to your present means. Increase them only when your increased means permit.”

What Aristotle was saying (as it applies to investing) is to use risk capital only. Risk capital is capital that, if lost in the pursuit of reward, will not impact negatively your ability to take care financially of any of your current obligations, nor will it negatively impact your current lifestyle. This statement is also true for day traders to focus on the risk they are taking on in their own accounts. Just because you had a few good days trading doesn’t necessarily mean you should put more of your account at risk and increase the size of your trades exponentially. This happens all too often and turns successful day traders into unsuccessful traders in the intermediate term, and in many cases these traders end their trading because what was once a growing account with a tempered approach becomes one great big washout.
- No distractions, clear the table, shut the door, unplug your devices-FOCUS
- Perspective- where has the market been ( long term and intermediate term charts and try to identify the reason for large price moves in either direction
- Just because the market is open 23 hours, don’t try to physically trade the market for 23 hours, your money will burn out faster than you will. A quote I like is “the Market can remain irrational for longer than I can be solvent”
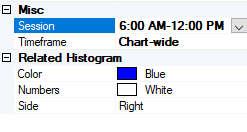
- Define your daytrading timeframe. (for example: 8am-10am, 2pm-4 pm), set it, and stick to it for at least 30 trading days. Markets have the tendency to behave similarly day in and day out during the same time frames. Remember, like currents in an ocean, markets are sometimes similar in repetition, but rarely identical in motion.
- Research – Know the market you are trading. Research it, understand what makes it move. Who the players are in the cash market.
- Stay informed – Know the recent daily dollar volatility of the market you are trading. I like to take the past 30 to 45 days for the Aug Comex 100oz Gold contract. For example, I recently used 30 trading days and arrived at $1220.00. I took the distance between the high and low of each full day, totaled them, added 30 data points together for an average daily range and multiplied that by the value of a tick in the gold ($10.00)
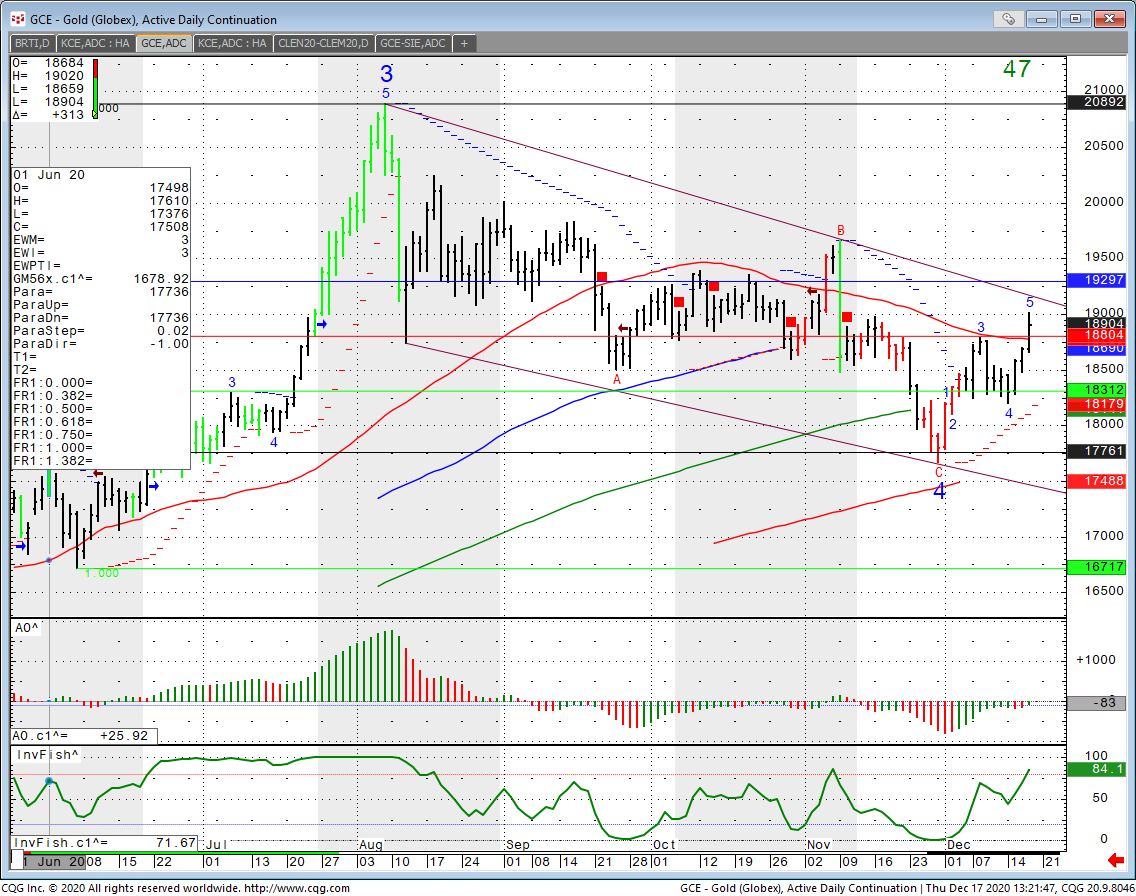
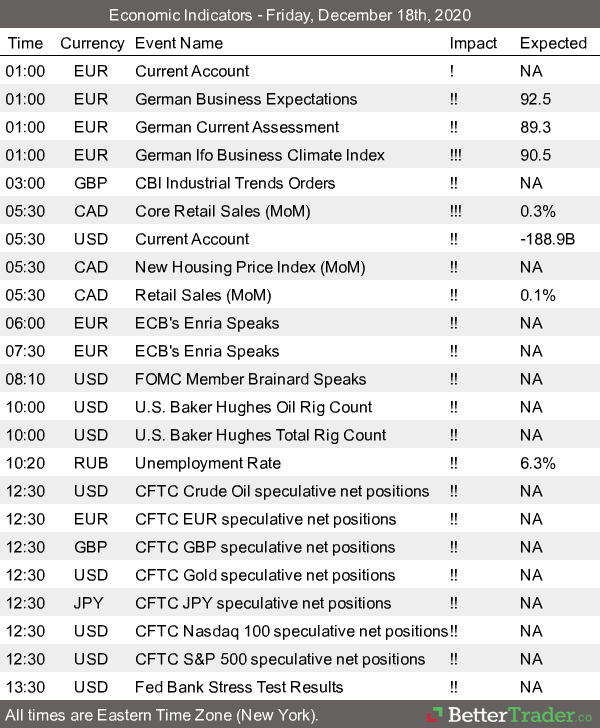
- With my trading platform I have the ability to adjust the time frame to include only the time I have set aside to view the market. In my research I will also have a full daily chart
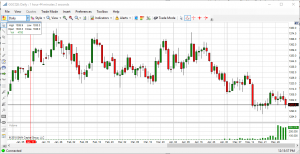
a weekly chart
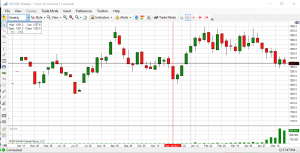
And a monthly chart
of August Comex Gold which will show me the critical areas of technical support that I can apply intraday to my abbreviated chart.
Why is dollar volatility Important? (see above) – You can manage your expectations here; you now know you shouldn’t expect to make 2,000.00 on a single trade and you can better gauge how many contracts, and how much risk you can take, on each trade. You now have a template of recent activity to better judge expected volatility without having to utilize an expensive add-on or chart indicator.
8) Call – Please speak with your broker on the phone to determine the appropriate amount of risk capital you need to trade your plan in the Gold Futures Market.
The Comex Gold Contract trades in Chicago through a registered Broker. www.cannontrading.com
Gold Contract specs are as follows:
Quoted in Dollars and Cents per Troy OZ.
Minimum price fluctuation: $0.10 per troy oz.
Symbol GC or GGC
Initial margin requirement: $3,410.00
Maintenance requirement: $3,100.00
Hours traded: 6pm EST Sunday, through to Friday at 5pm EST with an hour break each day between 5pm and 6 pm EST
As always, lean on your broker for guidance, call him or her and discuss what your risk tolerance levels are. Where to use stop loss orders or options to hedge your trading plan to ensure you leave yourself with a fighting chance.
Disclaimer: Trading commodity futures and options involves a substantial risk of loss.
The recommendations contained in this letter are of opinion only and do not guarantee any profits.
There is not an actual account trading these recommendations.
Past performances are not necessarily indicative of future results.