Cannon Futures Weekly Letter Issue # 1075
Dear Traders,
Trading Videos 101: Curious on an indicator that can help you with EXITS? How about using a certain indicator as a trailing stop?
Watch the latest trading videos we have posted and see if you can pick a tip or two on trading smarter!
In this week’s newsletter we are sharing four videos, each a few minutes long. The videos discuss practical tips for trading and sharing our experience with you
1. Using Bolinger Bands as a possible tool for exiting trades
2. One way you can use the Parabolics study ( also known as PSAR) to manage current positions, possibly as a trailing stop
3. Different ways traders can utilize support and resistance levels in their trading.
4. Entering trades on a stop, using “price confirmation”.
5. Utilizing Range Bar charts for shorter term trading as a way to try and filter out some noise.
Watch the videos instantly by clicking here
Good Trading
Trading Futures, Options on Futures, and retail off-exchange foreign currency transactions involves substantial risk of loss and is not suitable for all investors. You should carefully consider whether trading is suitable for you in light of your circumstances, knowledge, and financial resources. You may lose all or more of your initial investment. Opinions, market data, and recommendations are subject to change at any time when it comes to Futures Trading.
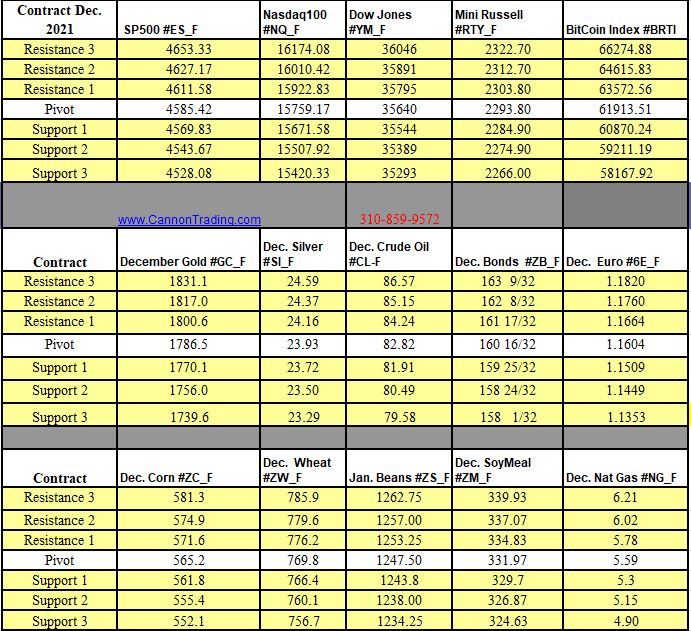
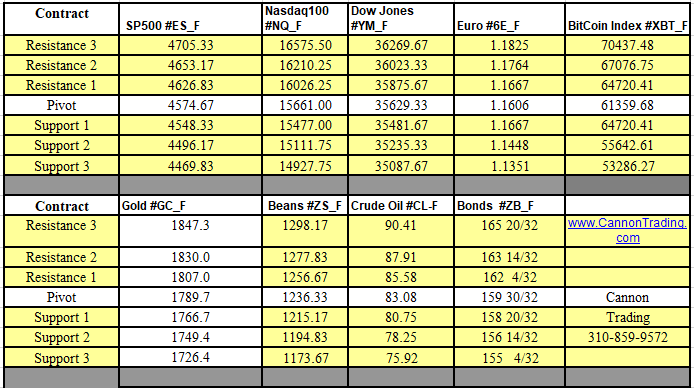
Futures Trading Levels
11-15.2021

Weekly Levels

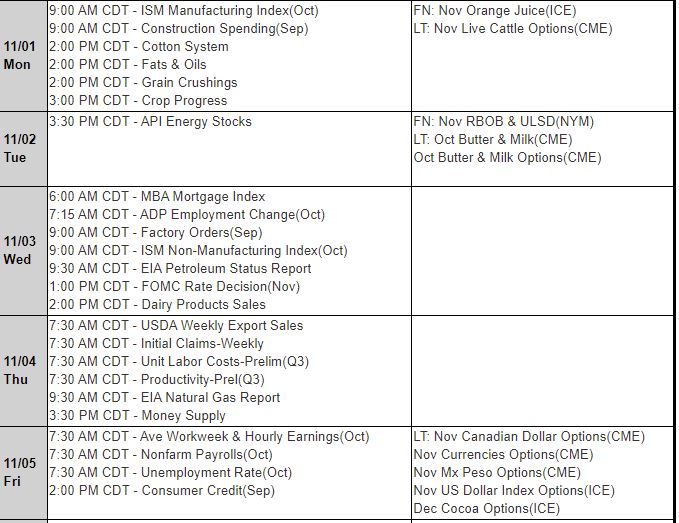
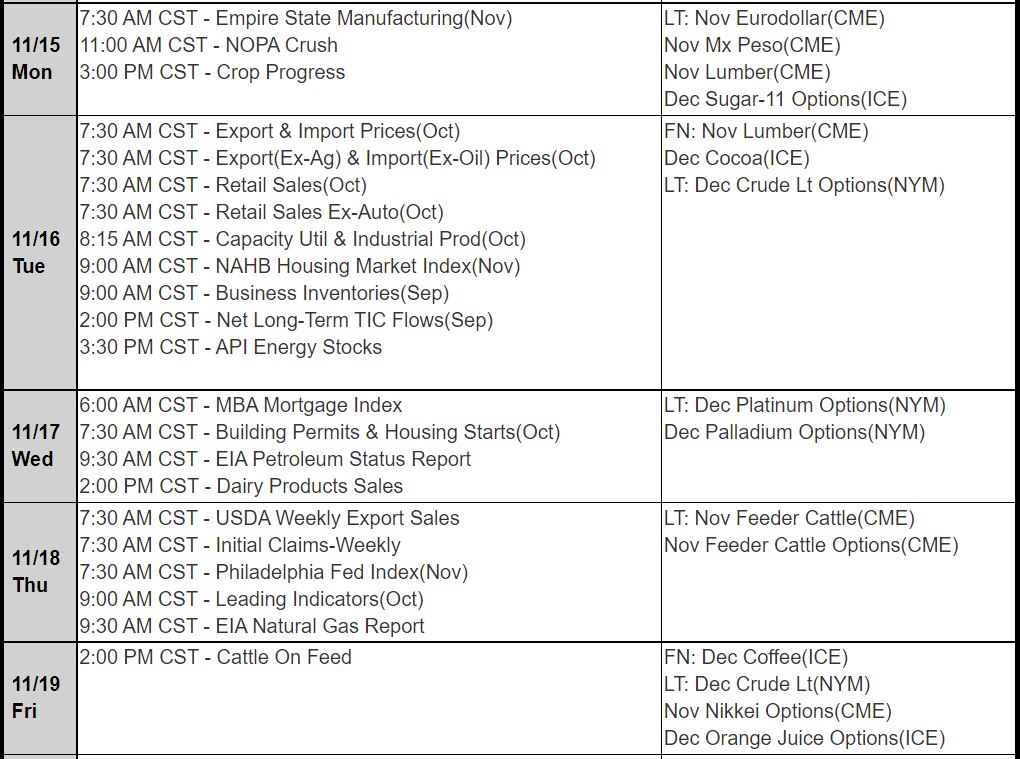
Reports, First Notice (FN), Last trading (LT) Days for the Week:
This is not a solicitation of any order to buy or sell, but a current market view provided by Cannon Trading Inc. Any statement of facts here in contained are derived from sources believed to be reliable, but are not guaranteed as to accuracy, nor they purport to be complete. No responsibility is assumed with respect to any such statement or with respect to any expression of opinion herein contained. Readers are urged to exercise their own judgement in trading