E Mini S&P 500

E Mini S&P 500


E-Mini S&P 500: Origins, Viability, and the Rise of Micro S&P Products

August 1st, 2023 Filed under Future Trading News | Comment (0)

Find out more about trading E-Mini S&P 500 contracts with Cannon Trading Company here.

The E-Mini S&P 500 is a widely traded stock index futures contract that provides exposure to the S&P 500 index. In this article, we will explore the history of the E-Mini S&P 500, understand its viability as a futures contract, and examine the evolution of micro S&P products. We will delve into the conception of trading the S&P 500 index as an E-Mini futures contract, the reasons behind its success, and the subsequent development of micro S&P contracts.

I.Origins of the E-Mini S&P 500:

The E-Mini S&P 500 came into existence as a response to market demands and advancements in technology. Its creation was driven by the Chicago Mercantile Exchange (CME), which sought to introduce a more accessible and cost-effective way for traders to gain exposure to the S&P 500 index.

  1. Conception of E-Mini Futures: The concept of trading the S&P 500 index as an E-Mini futures contract was conceived by the CME. The exchange recognized the need for smaller-sized contracts that would allow individual traders to participate in stock market index trading without the capital requirements of full-sized contracts.
  2. Introduction of E-Mini S&P 500: In September 1997, the CME launched the E-Mini S&P 500 futures contract, marking a significant milestone in the evolution of stock index futures trading. The E-Mini S&P 500 contracts represented a fraction of the value and margin requirements of their full-sized counterparts, making them more accessible to a wider range of market participants.

II. Viability of the E-Mini S&P 500 Futures Contract:

Several factors contribute to the viability of the E-Mini S&P 500 as a futures contract:

  1. Broad Market Exposure: The S&P 500 index is widely regarded as a benchmark for the overall performance of the U.S. stock market. Comprising 500 large-cap U.S. companies, it represents a diverse range of sectors and industries. The E-Mini S&P 500 futures contract provides traders with exposure to this broad market index, allowing them to speculate on or hedge against market movements.
  2. Liquidity and Efficiency: The E-Mini S&P 500 is one of the most liquid futures contracts globally. Its popularity and high trading volume ensure ample liquidity and tight bid-ask spreads. This liquidity, combined with electronic trading platforms, allows for efficient price discovery and ease of trade execution.
  3. Market Influence and Visibility: The S&P 500 index’s importance in the financial industry contributes to the E-Mini S&P 500’s viability as a futures contract. The index is widely followed by investors, analysts, and market participants worldwide. Its performance influences market sentiment and serves as a reference point for various investment strategies.

III. Evolution of Micro S&P Products:

Building upon the success of the E-Mini S&P 500, the CME introduced micro S&P products to further enhance accessibility and cater to individual traders.

  1. Introduction of Micro E-Mini S&P 500: In May 2019, the CME launched Micro E-Mini S&P 500 futures contracts. These contracts are one-tenth the size of the E-Mini S&P 500, allowing traders to participate in the market with even smaller capital requirements. Micro E-Mini S&P 500 futures provide greater flexibility and precision for traders with limited capital or those seeking to fine-tune their exposure.
  2. Advantages of Micro S&P Products: Micro S&P products offer several advantages. They require lower margin requirements, making them more accessible to retail traders and smaller institutional investors. Additionally, they enable traders to more precisely tailor their positions, adjust risk levels, and scale their exposure based on their trading strategies and capital availability.
  3. Micro E-Mini Success: The introduction of micro E-Mini S&P 500 contracts has gained significant traction in the futures market. The smaller contract size, lower margin requirements, and high liquidity have made micro S&P products popular among individual traders and allowed for increased participation and diversity in the market.

The E-Mini S&P 500, conceived by the CME, revolutionized stock index futures trading by providing accessible and cost-effective exposure to the S&P 500 index. Its viability stems from the broad market exposure, liquidity, and market influence associated with the S&P 500 index. The subsequent introduction of micro S&P products, such as the Micro E-Mini S&P 500, further enhanced accessibility, flexibility, and precision for traders. The rise of micro S&P products has attracted retail traders and smaller institutional investors, fostering increased participation and diversification in the futures market. Overall, the E-Mini S&P 500 and micro S&P products have played instrumental roles in democratizing access to stock index trading and shaping the landscape of futures markets.

Ready to start trading futures? Call 1(800)454-9572 and speak to one of our experienced, Series-3 licensed futures brokers and start your futures trading journey with Cannon Trading Company today.

DisclaimerTrading Futures, Options on Futures, and retail off-exchange foreign currency transactions involves substantial risk of loss and is not suitable for all investors.  Past performance is not indicative of future results. You should carefully consider whether trading is suitable for you in light of your circumstances, knowledge, and financial resources. You may lose all or more of your initial investment. Opinions, market data, and recommendations are subject to change at any time.


Weekly Newsletter #1046 Commitment of Traders Report PDF., ES Market Review & Trading Levels 4.10.2021

April 9th, 2021 Filed under Indices, Weekly Newsletter | Comment (0)

Cannon Futures Weekly Newsletter Issue # 1046

Dear Traders,

Like us on FaceBook!
Get Real Time updates and market alerts on Twitter!
Get Real Time updates and more on our private FB group!
Trading 102: Commitment of Traders Report – What Lies beneath
Commitment of Traders Report – COT
Commitment of Traders Report offers wealth of data when it comes to commodity and futures trading. You can somewhat say, this is a window into what the “big boys are doing” which is published weekly.
In this 24 page PDF booklet, Gary Kamen of Trends in Futures reviews the commitment of traders report, what it means, how traders can utilize it and much more.
Sign up and instantly download the booklet and learn about:
* History of the COT report
* Why is this report important?
* The new COT report
* How can you use the information in this report?
* And much more….
ES WEEKLY chart for your review. Click for larger image. New all time highs fueled by FED QE.
Next targets? Levels of support? will this past week slow price action continue or will the “speedy price action ” of weeks before return?
M S&P’s ( June mini SP 500)
4,101 OBJECTIVE has been met.
Market could have a retracement back
to 4075.00.
Next test area is 4145.00
No two Bull or Bear markets are alike. This pandemic is similar to 1918 (post WW1), which originated in China, unfortunately killing 50 million globally. The pent up demand led to the Roaring 20’s, which is the cycle we’re presently in. With the FED all in with unprecedented stimulus, we could see a 8-9% GDP number!
Q.E. is $120 billion a month, coupled
with the 3 stimulus packages and the new $2.2 trillion infrastructure in the pipeline. Also, the FED is allowing inflation to run hot, above their 2% target, using a weak US$, as its main catalyst. Lastly, the SHORT END may remain untouched for 2 years.
Eventually, the FED will lose control of the LONG END of the curve!
Future CAVEAT, is that we all know how the Roaring 20’s ended on Oct. 29, 1929.
Mini S&P ES Weekly Chart
Good Trading

Trading Futures, Options on Futures, and retail off-exchange foreign currency transactions involves substantial risk of loss and is not suitable for all investors.  You should carefully consider whether trading is suitable for you in light of your circumstances, knowledge, and financial resources. You may lose all or more of your initial investment. Opinions, market data, and recommendations are subject to change at any time when it comes to Futures Trading.


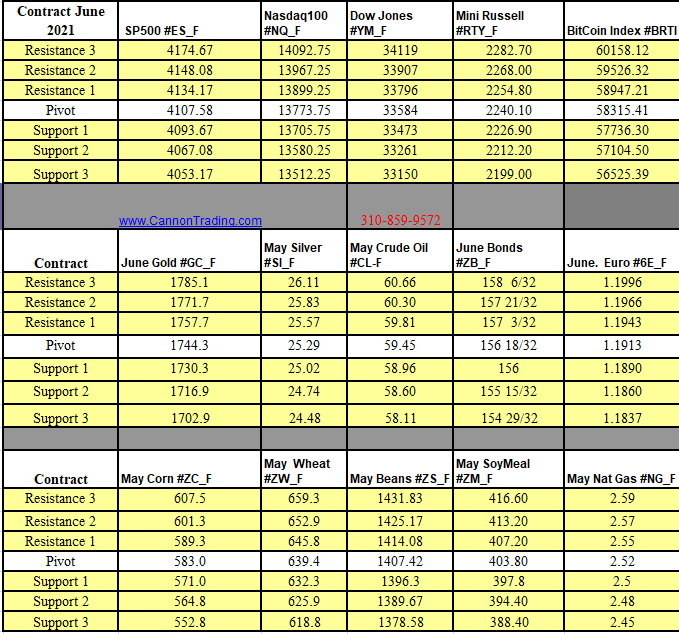
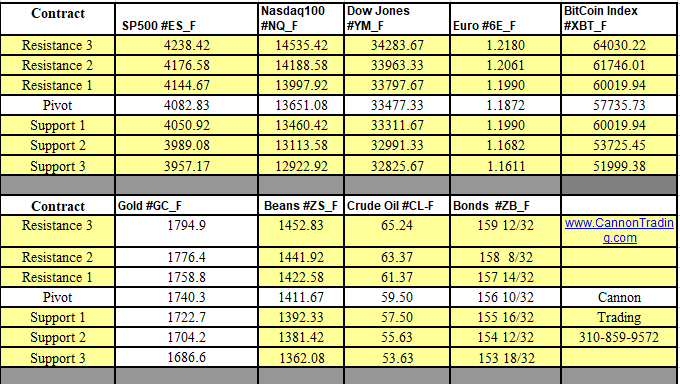
Futures Trading Levels

4-12-2021


Weekly Levels

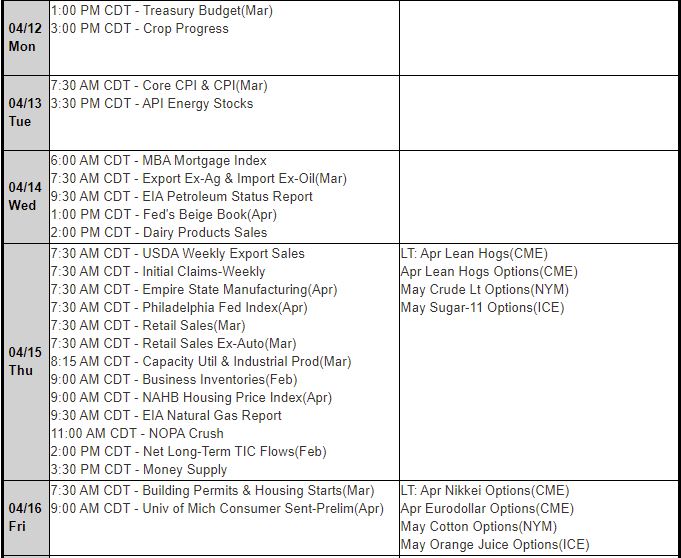
Reports, First Notice (FN), Last trading (LT) Days for the Week:

https://mrci.com

Date Reports/Expiration Notice Dates

MRCI Reports

This is not a solicitation of any order to buy or sell, but a current market view provided by Cannon Trading Inc. Any statement of facts herein contained are derived from sources believed to be reliable but are not guaranteed as to accuracy, nor they purport to be complete. No responsibility is assumed with respect to any such statement or with respect to any expression of opinion herein contained. Readers are urged to exercise their own judgment in trading


Big Volatility in Stock Index Futures Last Two Days – Levels for 09.13.16

September 12th, 2016 Filed under Future Trading News, Futures Trading, Index Futures | Comment (0)

Connect with Us! Use Our Futures Trading Levels and Economic Reports RSS Feed.

Like us on FacebookFollow us on TwitterView our profile on LinkedInFind us on Google+Cannon Trading Futures Trading Resistance & Support Levels and Economic ReportsFind us on Yelp

1. Market Commentary
2. Futures Support and Resistance Levels – S&P, Nasdaq, Dow Jones, Russell 2000, Dollar Index
3. Commodities Support and Resistance Levels – Gold, Euro, Crude Oil, T-Bonds
4. Commodities Support and Resistance Levels – Corn, Wheat, Beans, Silver
5. Futures Economic Reports for Friday September 9, 2016

Greetings!

Front month for stock indices is December!!

I looked for some news that may explain the large sell off Friday and almost the same level of bounce today….I saw a few things but must admit none made sense to me, so my clients who are “conspiracy theory believers” may have won this one…..

I saw something about Fed officials speaking today “infused confidence back”, saw another thing that Friday was due to North Korea nuclear tests…yet another explanation spoke about rollover. Another news flash spoke about possibly removing some of the stocks from the financial segment of the SP500, specifically “good performing real estate stocks from the financial/ banking sector…..not to mention the “9/11” effect….and more and more etc. etc…..

My guess is the FED once again too concerned with keeping stock market prices higher than the paying attention to the rest of the economy…..I feel that QE in general and other FED action created artificially higher stock market prices which will one day explode in a violent way. But that is a topic for a whole new discussion.

Bottom line is I have no explanation but here is what the hourly and daily charts look like:

DAILY

S&P 500 Futures Daily Chart
Hourly
S&P 500 Futures Hourly Chart

Read the rest of this entry »


Heikin-Ashi Mini S&P Chart & Economic Reports 10.09.2015

October 8th, 2015 Filed under Future Trading News, Indices | Comment (0)

Connect with Us! Use Our Futures Trading Levels and Economic Reports RSS Feed.

Like us on FacebookFollow us on TwitterView our profile on LinkedInFind us on Google+Cannon Trading Futures Trading Resistance & Support Levels and Economic ReportsFind us on Yelp

1. Market Commentary
2. Futures Support and Resistance Levels – S&P, Nasdaq, Dow Jones, Russell 2000, Dollar Index
3. Commodities Support and Resistance Levels – Gold, Euro, Crude Oil, T-Bonds
4. Commodities Support and Resistance Levels – Corn, Wheat, Beans, Silver
5. Futures Economic Reports for Friday October 9, 2015

Hello Traders,

For 2015 I would like to wish all of you discipline and patience in your trading!

Earnings season is under way. Make sure you are aware of major earning announcements.
Another good source for earnings reports by MorningStar. I would have not guessed that we would retrace all the way back after the major sell off/ flash crash we had back in Aug 21st.
EP - E-Mini S&P 500, Equalired Active Daily Continuation : Heikin-Ashi

EP – E-Mini S&P 500, Equalired Active Daily Continuation : Heikin-Ashi

Daily chart of the mini SP 500 for your review below:

Read the rest of this entry »


Heikin-Ashi Mini S&P Chart & Economic Reports 10.06.2015

October 5th, 2015 Filed under Future Trading News, Indices | Comment (0)

Connect with Us! Use Our Futures Trading Levels and Economic Reports RSS Feed.

Like us on FacebookFollow us on TwitterView our profile on LinkedInFind us on Google+Cannon Trading Futures Trading Resistance & Support Levels and Economic ReportsFind us on Yelp

1. Market Commentary
2. Futures Support and Resistance Levels – S&P, Nasdaq, Dow Jones, Russell 2000, Dollar Index
3. Commodities Support and Resistance Levels – Gold, Euro, Crude Oil, T-Bonds
4. Commodities Support and Resistance Levels – Corn, Wheat, Beans, Silver
5. Futures Economic Reports for Tuesday October 6, 2015

Hello Traders,

For 2015 I would like to wish all of you discipline and patience in your trading!

The move we saw from Friday morning right after job numbers to today was a very powerful, vertical up move.
The question, big question is:

Is this a vicious bear market rally, possibly an opportunity to sell?

Did market participants decided that rates will be at zero for foreseeable future ( ZIRP) and market just finished a healthy 10% correction and heading back to an all time high?
Big questions….I am not sure which way to lean but here my daily chart of the mini SP 500 with some levels to watch. We are right against key resistance, possible right shoulder in the head and shoulder formation.

EP - E-Mini S&P 500, Equalized Active Daily Continution : Heikin-Ashi

EP – E-Mini S&P 500, Equalized Active Daily Continution : Heikin-Ashi

Did you know Cannon offers FOREX trading including the MT4 platformCheck out our Trading Systems/ALGO Trading and Managed Accounts section!

Many ways to trade any market, many ways to lose money in any market and only very few ways to lock in gainsIf you need help creating a trading plan, visit our broker assist services.

GOOD TRADING

Trading Futures, Options on Futures, and retail off-exchange foreign currency transactions involves substantial risk of loss and is not suitable for all investors. You should carefully consider whether trading is suitable for you in light of your circumstances, knowledge, and financial resources. You may lose all or more of your initial investment. Opinions, market data, and recommendations are subject to change at any time.

If you like Our Futures Trading Daily Support and Resistance Levels, Please share!

Futures Trading Levels

Contract Dec. 2015 SP500 Nasdaq100 Dow Jones Mini Russell Dollar Index
Resistance 3 2033.33 4422.42 17154 1175.43 97.23
Resistance 2 2006.67 4376.08 16924 1156.87 96.76
Resistance 1 1990.58 4343.17 16788 1146.13 96.49
Pivot 1963.92 4296.83 16558 1127.57 96.02
Support 1 1947.83 4263.92 16422 1116.83 95.74
Support 2 1921.17 4217.58 16192 1098.27 95.27
Support 3 1905.08 4184.67 16056 1087.53 95.00
Contract Dec. Gold Dec. Silver Nov. Crude Oil Dec. Bonds Dec.   Euro
Resistance 3 1153.3 16.50 48.85 160 21/32 1.1386
Resistance 2 1147.4 16.12 47.89 159 29/32 1.1343
Resistance 1 1141.3 15.87 47.12 158 20/32 1.1270
Pivot 1135.4 15.49 46.16 157 28/32 1.1227
Support 1 1129.3 15.24 45.39 156 19/32 1.1154
Support 2 1123.4 14.86 44.43 155 27/32 1.1111
Support 3 1117.3 14.61 43.66 154 18/32 1.1038
Contract Dec. Corn Dec. Wheat Nov Beans Dec. SoyMeal Nov. Nat Gas
Resistance 3 399.8 528.7 896.83 309.37 2.56
Resistance 2 396.7 523.3 891.42 307.13 2.52
Resistance 1 395.1 519.4 887.83 305.47 2.50
Pivot 391.9 514.1 882.42 303.23 2.45
Support 1 390.3 510.2 878.8 301.6 2.4
Support 2 387.2 504.8 873.42 299.33 2.38
Support 3 385.6 500.9 869.83 297.67 2.36
Economic Reports

source:http://www.forexfactory.com/calendar.php

All times are Eastern time Zone (EST)

Date 4:07pm Currency Impact Detail Actual Forecast Previous Graph
TueOct 6  2:00am EUR German Factory Orders m/m 0.5% -1.4%
4:10am EUR Retail PMI 51.4
All Day EUR ECOFIN Meetings
Day 2 EUR Eurogroup Meetings
8:30am USD Trade Balance -47.6B -41.9B
10:00am USD IBD/TIPP Economic Optimism 44.6 42.0
1:00pm EUR ECB President Draghi Speaks
5:30pm USD FOMC Member Williams Speaks

This is not a solicitation of any order to buy or sell, but a current market view provided by Cannon Trading Inc. Any statement of facts here in contained are derived from sources believed to be reliable, but are not guaranteed as to accuracy, nor they purport to be complete. No responsibility is assumed with respect to any such statement or with respect to any expression of opinion herein contained. Readers are urged to exercise their own judgment in trading.


Have A Questions? Open an account Free Demo Account Free Demo Account

Question?

Valid first name is required.
Valid last name is required.
Phone number is required.
E-mail is required.
Message is required.
Phone (USA)
Phone (International)
Our Approach

You and your broker will work together to achieve your trading goals. We develop long term relationships with our clients so that we can grow and improve together.
Learn More About Choosing Cannon

Our Platforms

Please click on one of our platforms below to learn more about them, start a free demo, or open an account.
E-Futures Sierra Charts Firetip (Mac Compatible) RTrader

________
Doing Business With
See more...
Loading
Loading

Loading