Jump to a section in this post:
1. Market Commentary
2. Support and Resistance Levels – S&P, Nasdaq, Dow Jones, Russell 2000
3. Support and Resistance Levels – Gold, Euro, Crude Oil, T-Bonds
4. Support and Resistance Levels – March Corn, March Wheat, Jan Beans, March Silver
5.Economic Report for January 19, 2012
1. Market Commentary
Volume is getting slightly better as the holiday season/ New year/ MLK is now behind us.
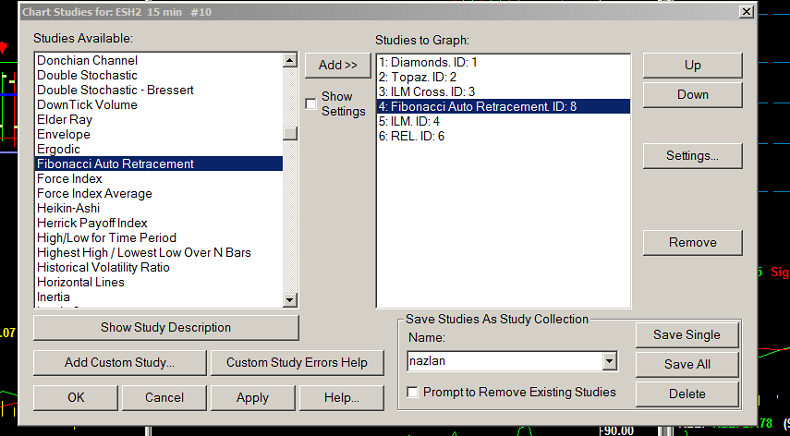
I wanted to touch base very briefly on a study many people know and use FIBONACCI levels and how the sierra charts ( ATcharts) has a study called Fibonacci Auto Retracement, which will draw the levels on your chart automatically as the market makes new highs/ lows etc.
I find this useful instead of having to go and manually draw levels.
I also find these levels useful for profit targets and stops since by formula, these FIB levels as I call them take into account the range of the trading day, hence on days when ranges are wide, it will provide you possible stops and/ or targets that are wider and vice versa, when the trading day is narrow, the targets will get tighter.
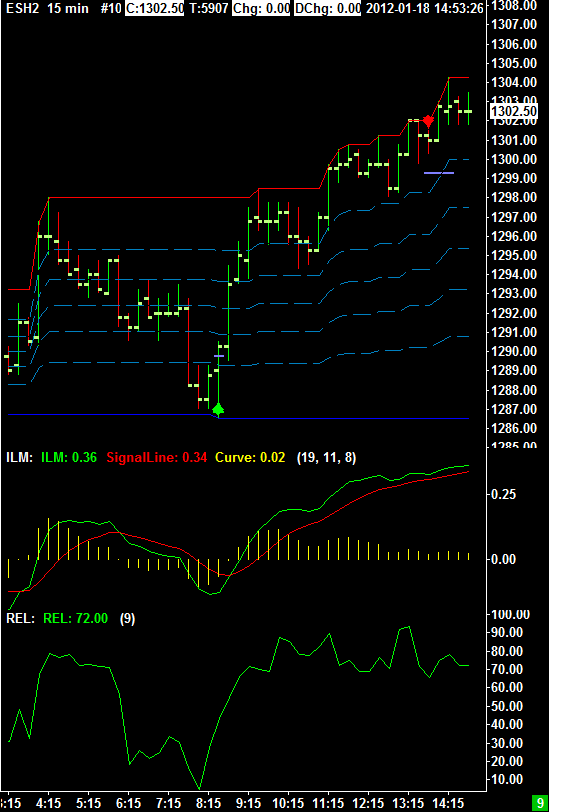
Here are two screen shots on how I select the study and how it looks like on a 15 minutes mini SP chart from today’s session.


Notice how the FIB lines ( support / resistance levels) adjusted as market made new highs.
2. Support and Resistance Levels – S&P, Nasdaq, Dow Jones, Russell 2000
| Contract (Dec. 2011) | SP500 (big & Mini) |
Nasdaq100 (big & Mini) |
Dow Jones (big & Mini) |
Mini Russell |
| Resistance Level 3 | 1326.23 | 2463.50 | 12673 | 795.13 |
| Resistance Level 2 | 1315.22 | 2443.75 | 12597 | 785.47 |
| Resistance Level 1 | 1308.73 | 2431.50 | 12553 | 780.13 |
| Pivot Point | 1297.72 | 2411.75 | 12477 | 770.47 |
| Support Level 1 | 1291.23 | 2399.50 | 12433 | 765.13 |
| Support Level 2 | 1280.22 | 2379.75 | 12357 | 755.47 |
| Support Level 3 | 1273.73 | 2367.50 | 12313 | 750.13 |
3. Support & Resistance Levels for Gold, Euro, Crude Oil, and U.S. T-Bonds
| Contract | Feb. Gold | Dec. Euro | Jan. Crude Oil | March. Bonds |
| Resistance Level 3 | 1688.2 | 1.3033 | 104.17 | 146 11/32 |
| Resistance Level 2 | 1675.6 | 1.2950 | 103.12 | 145 28/32 |
| Resistance Level 1 | 1667.4 | 1.2901 | 101.95 | 145 |
| Pivot Point | 1654.8 | 1.2818 | 100.90 | 144 17/32 |
| Support Level 1 | 1646.6 | 1.2769 | 99.73 | 143 21/32 |
| Support Level 2 | 1634.0 | 1.2686 | 98.68 | 143 6/32 |
| Support Level 3 | 1625.8 | 1.2637 | 97.51 | 142 10/32 |
4. Support & Resistance Levels for Corn, Wheat, Beans and Silver
| Contract | March Corn | March Wheat | Jan. Beans | March. Silver |
| Resistance Level 3 | 607.3 | 605.2 | 1204.00 | 3162.0 |
| Resistance Level 2 | 604.2 | 602.1 | 1195.50 | 3110.5 |
| Resistance Level 1 | 598.8 | 597.2 | 1189.50 | 3077.0 |
| Pivot Point | 595.7 | 594.1 | 1181.00 | 3025.5 |
| Support Level 1 | 590.3 | 589.2 | 1175.0 | 2992.0 |
| Support Level 2 | 587.2 | 586.1 | 1166.50 | 2940.5 |
| Support Level 3 | 581.8 | 581.2 | 1160.50 | 2907.0 |
5. Economic Reports
ECB Monthly Bulletin
4:00am
Building Permits
8:30am
Core CPI
8:30am
Unemployment Claims
8:30am
CPI
8:30am
Housing Starts
8:30am
Philly Fed Manufacturing Index
10:00am
Natural Gas Storage
10:30am
Crude Oil Inventories
11:00am
