____________________________________________________________________
Voted #1 Blog and #1 Brokerage Services on TraderPlanet for 2016!!
____________________________________________________________________
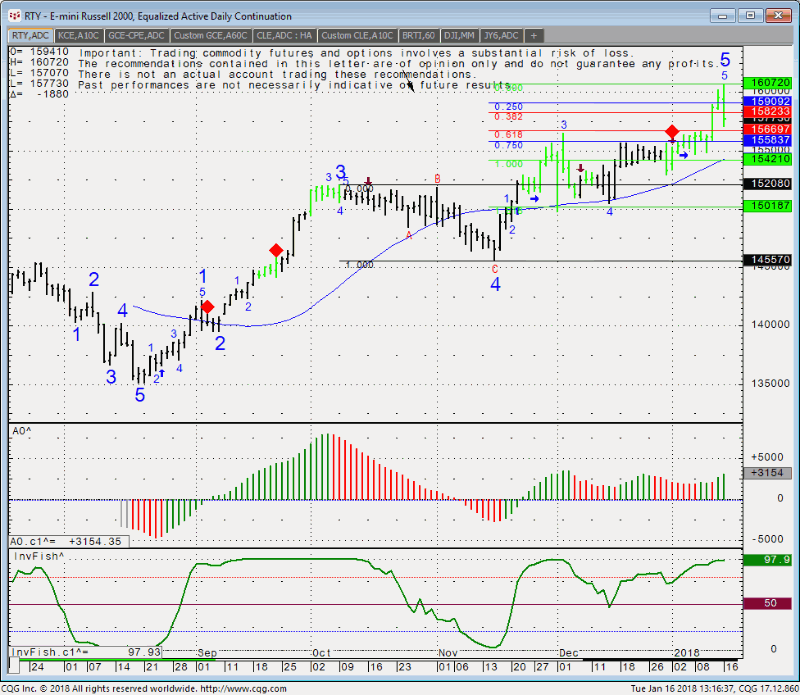
Today was the first time in quite a while I saw meaningful reversal in stock index markets. Time will tell if this was the first sign of correction or just another small dip and nothing else….
See mini Russell chart below ( the CME contract) and notice we made a new high and reversed to take out yesterdays lows and close lower then the open
and previous session lows. The action seems to be related to China downgrading the US credit ratings and perhaps sell off in CryptoCurrencies?
We need a bit more follow through to suggest more down side.

Good Trading!
Trading Futures, Options on Futures, and retail off-exchange foreign currency transactions involves substantial risk of loss and is not suitable for all investors. You should carefully consider whether trading is suitable for you in light of your circumstances, knowledge, and financial resources. You may lose all or more of your initial investment. Opinions, market data, and recommendations are subject to change at any time.
Futures Trading Levels
1-17-2018
| Contract March 2018 | SP500 | Nasdaq100 | Dow Jones | Mini Russell | BitCoin Index |
| Resistance 3 | 2842.83 | 6943.42 | 26394 | 1635.57 | 16443.33 |
| Resistance 2 | 2825.67 | 6894.58 | 26228 | 1621.33 | 15361.67 |
| Resistance 1 | 2803.58 | 6826.92 | 26015 | 1599.17 | 13323.33 |
| Pivot | 2786.42 | 6778.08 | 25849 | 1584.93 | 12241.67 |
| Support 1 | 2764.33 | 6710.42 | 25636 | 1562.77 | 10203.33 |
| Support 2 | 2747.17 | 6661.58 | 25470 | 1548.53 | 9121.67 |
| Support 3 | 2725.08 | 6593.92 | 25257 | 1526.37 | 7083.33 |
| Contract | Feb. Gold | Mar. Silver | Feb. Crude Oil | Mar. Bonds | Mar. Euro |
| Resistance 3 | 1358.2 | 18.17 | 66.16 | 151 28/32 | 1.2467 |
| Resistance 2 | 1351.6 | 17.81 | 65.52 | 151 15/32 | 1.2405 |
| Resistance 1 | 1345.3 | 17.52 | 64.66 | 151 5/32 | 1.2357 |
| Pivot | 1338.7 | 17.16 | 64.02 | 150 24/32 | 1.2295 |
| Support 1 | 1332.4 | 16.87 | 63.16 | 150 14/32 | 1.2248 |
| Support 2 | 1325.8 | 16.51 | 62.52 | 150 1/32 | 1.2186 |
| Support 3 | 1319.5 | 16.22 | 61.66 | 149 23/32 | 1.2138 |
| Contract | Mar. Corn | Mar. Wheat | March Beans | Mar. SoyMeal | Feb. Nat Gas |
| Resistance 3 | 352.5 | 422.9 | 977.33 | 329.80 | 3.32 |
| Resistance 2 | 350.8 | 420.3 | 973.67 | 326.40 | 3.25 |
| Resistance 1 | 349.5 | 418.4 | 970.83 | 324.60 | 3.19 |
| Pivot | 347.8 | 415.8 | 967.17 | 321.20 | 3.11 |
| Support 1 | 346.5 | 413.9 | 964.3 | 319.4 | 3.0 |
| Support 2 | 344.8 | 411.3 | 960.67 | 316.00 | 2.98 |
| Support 3 | 343.5 | 409.4 | 957.83 | 314.20 | 2.91 |
Economic Reports, source:
http://www.forexfactory.com
| Date | 4:15pm | Currency | Impact | Detail | Actual | Forecast | Previous | Graph | |
|---|---|---|---|---|---|---|---|---|---|
| WedJan 17 | 5:00am | EUR |
Final CPI y/y
|
1.4% | 1.5% | ||||
| EUR |
Final Core CPI y/y
|
0.9% | 0.9% | ||||||
| Tentative | EUR |
German 30-y Bond Auction
|
1.20|1.7 | ||||||
| 6:45am | GBP |
MPC Member Saunders Speaks
|
|||||||
| 9:15am | USD |
Capacity Utilization Rate
|
77.3% | 77.1% | |||||
| USD |
Industrial Production m/m
|
0.4% | 0.2% | ||||||
| 10:00am | USD |
NAHB Housing Market Index
|
73 | 74 | |||||
| 2:00pm | USD |
Beige Book
|
|||||||
| 4:00pm | USD |
TIC Long-Term Purchases
|
50.1B | 23.2B | |||||
| 4:30pm | USD |
FOMC Member Mester Speaks
|
|||||||
| 7:01pm | GBP |
RICS House Price Balance
|
-1% | 0% |
This is not a solicitation of any order to buy or sell, but a current market view provided by Cannon Trading Inc. Any statement of facts here in contained are derived from sources believed to be reliable, but are not guaranteed as to accuracy, nor they purport to be complete. No responsibility is assumed with respect to any such statement or with respect to any expression of opinion herein contained. Readers are urged to exercise their own judgement in trading.