____________________________________________________________________
Voted #1 Blog and #1 Brokerage Services on TraderPlanet for 2016!!
____________________________________________________________________
Today’s powerful move in the Natural gas market ( primarily in the front month, February) served as a good reminder that many of the physical commodities ( and some of the financial ones as well) have limit up and limit down moves. When a limit up/down move happens, trading halts for a certain amount of time or until there is a balance between sellers and buyers and we will be happy to share more and explain to you if interested via email or one on one conversation.
the short version of limit up move is: There are only buyers and no sellers at current price levels. The even shorter version is that this can be a very dangerous event to your financial, mental and emotional well being if you are on the wrong side…..
Daily chart of the Natural Gas market for your review below:
If you like to get a free trial of the indicators/ ALGOS I circled in the chart above, visit:
https://www.cannontrading.com/tools/intraday-futures-trading-signals
Trading Futures, Options on Futures, and retail off-exchange foreign currency transactions involves substantial risk of loss and is not suitable for all investors. You should carefully consider whether trading is suitable for you in light of your circumstances, knowledge, and financial resources. You may lose all or more of your initial investment. Opinions, market data, and recommendations are subject to change at any time.
Futures Trading Levels
1-24-2018
| Contract March 2018 | SP500 | Nasdaq100 | Dow Jones | Mini Russell | BitCoin Index |
| Resistance 3 | 2863.58 | 7059.42 | 26480 | 1635.70 | 13153.33 |
| Resistance 2 | 2854.17 | 7020.33 | 26397 | 1626.00 | 12251.67 |
| Resistance 1 | 2847.58 | 6997.92 | 26300 | 1619.20 | 11668.33 |
| Pivot | 2838.17 | 6958.83 | 26217 | 1609.50 | 10766.67 |
| Support 1 | 2831.58 | 6936.42 | 26120 | 1602.70 | 10183.33 |
| Support 2 | 2822.17 | 6897.33 | 26037 | 1593.00 | 9281.67 |
| Support 3 | 2815.58 | 6874.92 | 25940 | 1586.20 | 8698.33 |
| Contract | Feb. Gold | Mar. Silver | Mar. Crude Oil | Mar. Bonds | Mar. Euro |
| Resistance 3 | 1355.4 | 17.53 | 66.39 | 150 17/32 | 1.2451 |
| Resistance 2 | 1348.4 | 17.31 | 65.63 | 150 3/32 | 1.2399 |
| Resistance 1 | 1344.6 | 17.18 | 65.21 | 149 23/32 | 1.2367 |
| Pivot | 1337.6 | 16.96 | 64.45 | 149 9/32 | 1.2315 |
| Support 1 | 1333.8 | 16.82 | 64.03 | 148 29/32 | 1.2284 |
| Support 2 | 1326.8 | 16.60 | 63.27 | 148 15/32 | 1.2232 |
| Support 3 | 1323.0 | 16.47 | 62.85 | 148 3/32 | 1.2200 |
| Contract | Mar. Corn | Mar. Wheat | March Beans | Mar. SoyMeal | Feb. Nat Gas |
| Resistance 3 | 354.8 | 429.7 | 999.42 | 347.33 | 4.07 |
| Resistance 2 | 353.4 | 427.3 | 994.08 | 343.67 | 3.85 |
| Resistance 1 | 352.3 | 424.4 | 990.17 | 341.63 | 3.69 |
| Pivot | 350.9 | 422.1 | 984.83 | 337.97 | 3.47 |
| Support 1 | 349.8 | 419.2 | 980.9 | 335.9 | 3.3 |
| Support 2 | 348.4 | 416.8 | 975.58 | 332.27 | 3.09 |
| Support 3 | 347.3 | 413.9 | 971.67 | 330.23 | 2.94 |
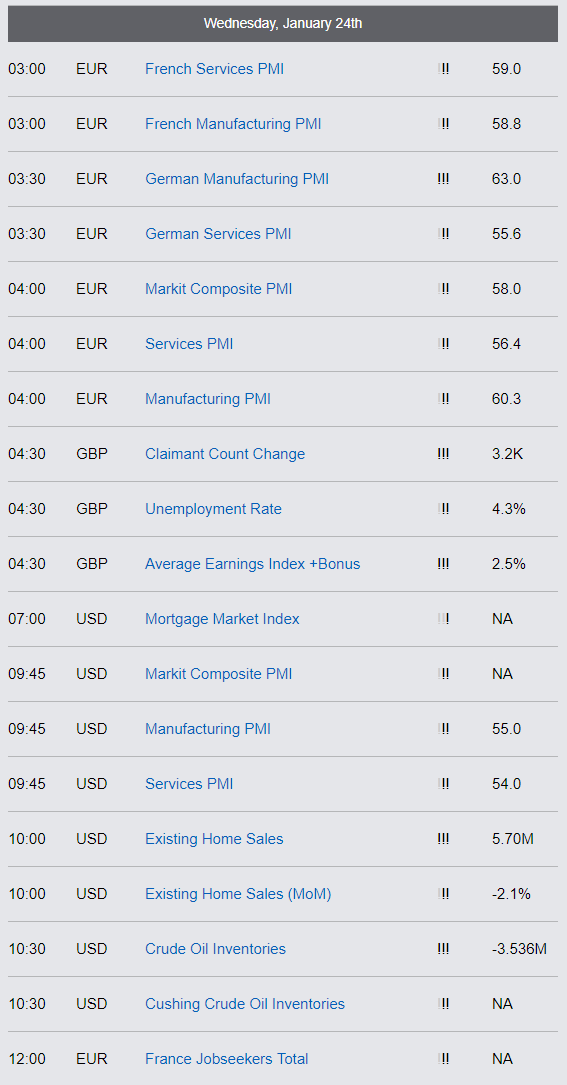
Economic Reports, source:
http://app.bettertrader.co

This is not a solicitation of any order to buy or sell, but a current market view provided by Cannon Trading Inc. Any statement of facts here in contained are derived from sources believed to be reliable, but are not guaranteed as to accuracy, nor they purport to be complete. No responsibility is assumed with respect to any such statement or with respect to any expression of opinion herein contained. Readers are urged to exercise their own judgement in trading.
