Cannon Trading / E-Futures.com
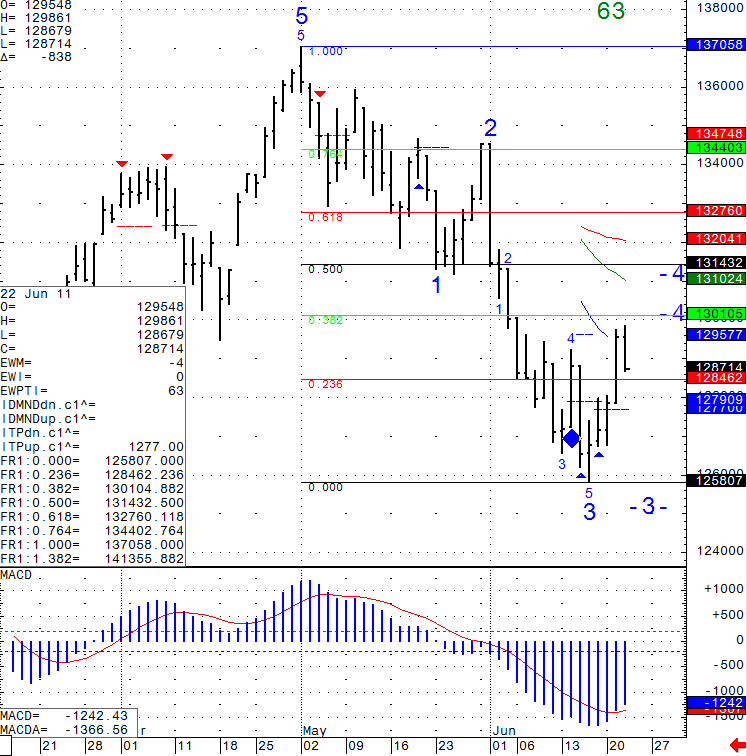
Once in a while I like to take a look at the actual underlying product for the future I am trading. In the case of the mini SP500, the actual product is the SP500 cash index. Below is a daily chart of the SP500 cash index, courtesy of CQG charting software.
Based on the tools I use and have confidence in, I will look for failure against the 1301 level and/ or a break back below 1284 as a sign that selling may resume towards the previous lows around 1258 cash basis. As always, use your own judgement in trading, know the time frame you like to trade, your risk tolerance etc.
Daily Chart of the S&P 500 Cash Index from June 22nd 2011

GOOD TRADING!
TRADING LEVELS!

Economic Reports Thursday June 23rd, 2011
Unemployment Claims
8:30am USD
New Home Sales
10:00am USD
Natural Gas Storage
10:30am USD
Economics Report Source: http://www.forexfactory.com/calendar.php

This is not a solicitation of any order to buy or sell, but a current market view provided by Cannon Trading Inc. Any statement of facts herein contained are derived from sources believed to be reliable, but are not guaranteed as to accuracy, nor they purport to be complete. No responsibility is assumed with respect to any such statement or with respect to any expression of opinion herein contained. Readers are urged to exercise their own judgment in trading!