Jump to a section in this post:
1. FOMC Statement Reminder
2. Support and Resistance Levels – S&P, Nasdaq, Dow Jones, Russell 2000
3. Support and Resistance Levels – Gold, Euro, Crude Oil, T-Bonds
4. Daily Mini S&P Chart
5. Economic Reports for Wednesday November 2, 2011
1. FOMC Statement Tomorrow!
If the first day of November is an indication of what to come….then hang on as it may be a wild ride…..
FOMC tomorrow and before that more than a few economic numbers.
FOMC days have different characteristics than other trading days. If you have traded for a while, check your trading notes from past FOMC days that may help you prepare for tomorrow.
if you are a newcomer, take a more conservative approach and make sure you understand that the news can really move the market.
My observations suggest choppy, low volume up until announcement, followed by some some sharp volatile moves right during and after the announcement. However, with tomorrow early morning reports and recent volatility, we may see wild action through out.
HEADS UP – NORMALLY FOMC COMES OUT AT 2:15 EASTERN TIME. TOMORROW IT WILL BE OUT 12:30 EASTERN TIME
One advice everyone can benefit from is, reduce your trading size in proportion to the increase in volatility. This should help your comfort level while in the day-trade.
2. Support & Resistance Levels for the S&P 500, NASDAQ, DJIA, and Russell 2000
| Contract (Dec. 2011) | SP500 (big & Mini) |
Nasdaq100 (big & Mini) |
Dow Jones (big & Mini) |
Mini Russell |
| Resistance Level 3 | 1246.83 | 2355.67 | 12175 | 765.27 |
| Resistance Level 2 | 1238.02 | 2336.33 | 12046 | 751.73 |
| Resistance Level 1 | 1227.63 | 2320.67 | 11828 | 733.27 |
| Pivot Point | 1218.82 | 2301.33 | 11699 | 719.73 |
| Support Level 1 | 1208.43 | 2285.67 | 11481 | 701.27 |
| Support Level 2 | 1199.62 | 2266.33 | 11352 | 687.73 |
| Support Level 3 | 1189.23 | 2250.67 | 11134 | 669.27 |
3. Support & Resistance Levels for Gold, Euro, Crude Oil, and U.S. T-Bonds
| Contract | Dec. Gold | Dec. Euro | Nov. Crude Oil | Dec. Bonds |
| Resistance Level 3 | 1762.2 | 1.4103 | 96.79 | 144 20/32 |
| Resistance Level 2 | 1738.0 | 1.3985 | 94.83 | 143 22/32 |
| Resistance Level 1 | 1729.5 | 1.3841 | 93.08 | 143 4/32 |
| Pivot Point | 1705.3 | 1.3723 | 91.12 | 142 6/32 |
| Support Level 1 | 1696.8 | 1.3579 | 89.37 | 141 20/32 |
| Support Level 2 | 1672.6 | 1.3461 | 87.41 | 140 22/32 |
| Support Level 3 | 1664.1 | 1.3317 | 85.66 | 140 4/32 |
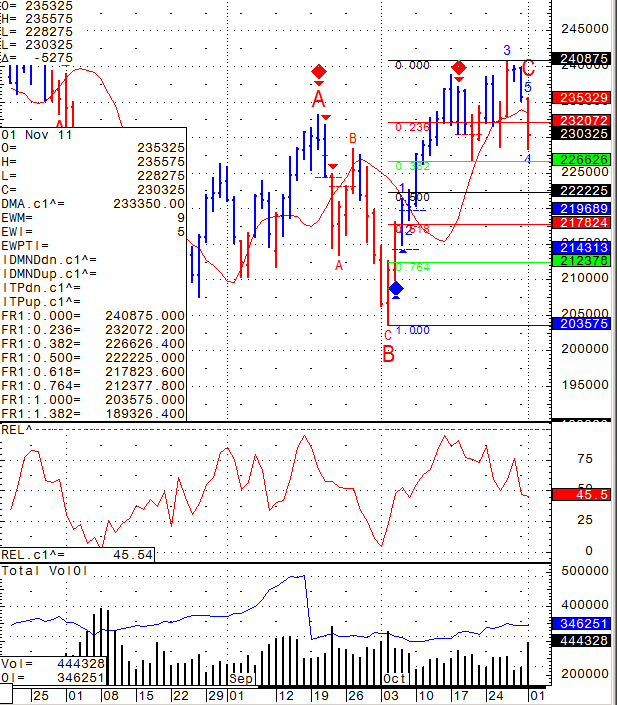
4. Daily Mini S&P 500 Futures Chart
(Go to E-Mini S&P 500 Futures Prices, News and Contract Specifications →)
5. Economic Reports for Wednesday November 2, 2011
German Unemployment Change
4:55am
Final Manufacturing PMI
5:00am
Challenger Jobs Cuts y/y
7:30am
ADP Non-Farm Employment Change
8:15am
Crude Oil Inventories
10:30am
FOMC Statement
12:30pm
Federal Funds Rate
12:30pm
FOMC Press Conference
2:15pm


