Jump to a section in this post:
1. Market Commentary
2. Support and Resistance Levels – S&P, Nasdaq, Dow Jones, Russell 2000
3. Support and Resistance Levels – Gold, Euro, Crude Oil, T-Bonds
4. Support and Resistance Levels – March Corn, March Wheat, Jan Beans, March Silver
5. Economic Reports for Monday, December 19, 2011

1. Market Commentary
Front month for stock indices, currencies, grains and most active markets is now MARCH. Symbol for March is H
Gold front month is February and Crude Oil front Month will be February this Monday.
If you are not sure which month you should be trading, please contact your broker.
Another trading day brings me to a different topic.
Most of our clients trade stock index futures, like mini SP 500, Mini Russell, Mini Dow Jones futures as well as the DAX and eurostoxx over at Europe ( which appeal to some traders because of the different times these markets are active) etc.
Even within this market group, different markets will behave differently because of difference in the underlying product as well as volume and more. Example the mini Russell 2000 versus the mini SP500.
The mini Russell is a little more “erratic”, bigger, spikier, quicker moves. Mainly because it has less volume than the mini SP 50 but also because the cash index includes the 500 SP stocks plus additional 1500 stocks….
With the growth of electronic trading, volume in Grains, interest rates, currencies, metals, energies and other segments have grown enough that many of these markets are “suitable” for day-trading.
The following is a small list of markets you may want to follow, trade in demo and consider for your day-trading. Another point to keep in mind that some of these markets have lower exchange fees, hence your total transaction costs can be lower!
Indices as discussed above
Currencies ( Euro, Yen, British Pound, Canadian Dollar, Australian dollar)
Interest rates ( US bonds/ 30 years, Ten Years, Five years and even the ULTRA bond contract is picking up volume)
Energies ( mostly Crude oil and Natural gas)
Metals ( gold and silver)
Grains ( beans, corn and wheat)
So the main point I am trying to make today is that there are other markets you may want to look at for day-trading. Some markets fit some traders better because maybe they “respect the trend better”, maybe less volatile or simply because they just are a better match for the trader’s personality on the other side. Some markets are more suitable for “trend following” intraday techniques, while other maybe better for counter trend trading style.
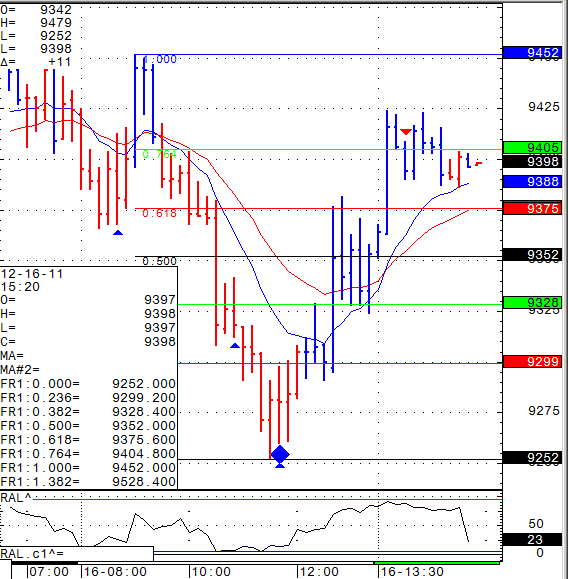
Below you will see a 10 minute chart of the Crude Oil market as an example for a market with wide ranges and volatile moves.

2. Support and Resistance Levels – S&P, Nasdaq, Dow Jones, Russell 2000
| Contract (Dec. 2011) | SP500 (big & Mini) |
Nasdaq100 (big & Mini) |
Dow Jones (big & Mini) |
Mini Russell |
| Resistance Level 3 | 1237.83 | 2290.00 | 12010 | 741.57 |
| Resistance Level 2 | 1231.32 | 2277.00 | 11950 | 734.83 |
| Resistance Level 1 | 1221.53 | 2255.00 | 11870 | 725.87 |
| Pivot Point | 1215.02 | 2242.00 | 11810 | 719.13 |
| Support Level 1 | 1205.23 | 2220.00 | 11730 | 710.17 |
| Support Level 2 | 1198.72 | 2207.00 | 11670 | 703.43 |
| Support Level 3 | 1188.93 | 2185.00 | 11590 | 694.47 |
3. Support & Resistance Levels for Gold, Euro, Crude Oil, and U.S. T-Bonds
| Contract | Feb. Gold | Dec. Euro | Jan. Crude Oil | March. Bonds |
| Resistance Level 3 | 1618.4 | 1.3181 | 97.24 | 147 13/32 |
| Resistance Level 2 | 1609.2 | 1.3138 | 96.02 | 146 16/32 |
| Resistance Level 1 | 1603.6 | 1.3091 | 94.97 | 145 27/32 |
| Pivot Point | 1594.4 | 1.3048 | 93.75 | 144 30/32 |
| Support Level 1 | 1588.8 | 1.3001 | 92.70 | 144 9/32 |
| Support Level 2 | 1579.6 | 1.2958 | 91.48 | 143 12/32 |
| Support Level 3 | 1574.0 | 1.2911 | 90.43 | 142 23/32 |
4. Support & Resistance Levels for Corn, Wheat, Beans and Silver
| Contract | March Corn | March Wheat | Jan. Beans | March. Silver |
| Resistance Level 3 | 597.8 | 596.3 | 1153.00 | 3074.7 |
| Resistance Level 2 | 592.7 | 591.9 | 1141.75 | 3033.8 |
| Resistance Level 1 | 587.8 | 586.1 | 1134.00 | 2993.7 |
| Pivot Point | 582.7 | 581.7 | 1122.75 | 2952.8 |
| Support Level 1 | 577.8 | 575.8 | 1115.0 | 2912.7 |
| Support Level 2 | 572.7 | 571.4 | 1103.75 | 2871.8 |
| Support Level 3 | 567.8 | 565.6 | 1096.00 | 2831.7 |
5. Economic Reports
NAHB Housing Market Index
10:00am