Jump to a section in this post:
1. Market Commentary
2. Support and Resistance Levels – S&P, Nasdaq, Dow Jones, Russell 2000
3. Support and Resistance Levels – Gold, Euro, Crude Oil, T-Bonds
4. Support and Resistance Levels – March Corn, March Wheat, Jan Beans, March Silver
5.Economic Report for January 20, 2012
1. Market Commentary
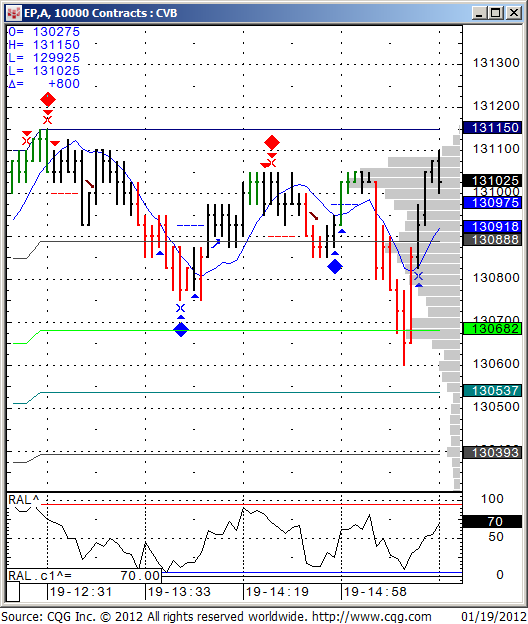
Below is an intraday chart using some of the studies I have programmed and like to apply to my charts.
As one can visually see, the last two hours of trading on the ES today worked well with my diamond algo. The chart below is 10,000 volume chart. To read why I sometimes prefer using volume charts over time charts ( example 5 minutes chart, 10 minutes etc.) and how you can get a free trial and apply my studies/ ALGO on your own charts, continue reading….

Volume Charts:
This model uses a theory that when it comes to short term day trading, volume is much more important than time, hence the use of volume bars. I use bars of between 1,000 to 18,000 contracts traded (pending the specific market, based on recent volatility, trade volume and a few other factors). That means that instead of bars completing based on time frame (i.e. 1 minute or 15 minutes etc.), we use volume instead of time. So each time X,000 contracts traded, a new bar will complete. When the specific market has high volume and is moving fast, the bars will complete faster. When market is in low volume without much action, the bars will complete slower.
For me personally, this has helped getting signals ahead of time when there is fast action in the market and avoiding false signals when volume is low.
Would you like to have access to my DIAMOND ALGO as shown above
and be able to apply for any market and any time frame on your own PC ? You can now have a two weeks free trial where I enable the ALGO along with few studies for your own sierra/ ATcharts.
If so, please send me an email with the following information:
1. Are you currently trading futures?
2. Charting software you use?
3. If you use sierra or ATcharts, please let me know the user name so I can enable you
4. Markets you currently trading?
2. Support and Resistance Levels – S&P, Nasdaq, Dow Jones, Russell 2000
| Contract (Dec. 2011) | SP500 (big & Mini) |
Nasdaq100 (big & Mini) |
Dow Jones (big & Mini) |
Mini Russell |
| Resistance Level 3 | 1318.40 | 2458.33 | 12635 | 793.33 |
| Resistance Level 2 | 1314.85 | 2450.67 | 12603 | 788.17 |
| Resistance Level 1 | 1310.80 | 2435.33 | 12575 | 783.33 |
| Pivot Point | 1307.25 | 2427.67 | 12543 | 778.17 |
| Support Level 1 | 1303.20 | 2412.33 | 12515 | 773.33 |
| Support Level 2 | 1299.65 | 2404.67 | 12483 | 768.17 |
| Support Level 3 | 1295.60 | 2389.33 | 12455 | 763.33 |
3. Support & Resistance Levels for Gold, Euro, Crude Oil, and U.S. T-Bonds
| Contract | Feb. Gold | Dec. Euro | Jan. Crude Oil | March. Bonds |
| Resistance Level 3 | 1690.4 | 1.3133 | 103.93 | 145 5/32 |
| Resistance Level 2 | 1680.5 | 1.3051 | 103.08 | 144 16/32 |
| Resistance Level 1 | 1669.0 | 1.3004 | 101.81 | 143 21/32 |
| Pivot Point | 1659.1 | 1.2922 | 100.96 | 143 |
| Support Level 1 | 1647.6 | 1.2875 | 99.69 | 142 5/32 |
| Support Level 2 | 1637.7 | 1.2793 | 98.84 | 141 16/32 |
| Support Level 3 | 1626.2 | 1.2746 | 97.57 | 140 21/32 |
4. Support & Resistance Levels for Corn, Wheat, Beans and Silver
| Contract | March Corn | March Wheat | Jan. Beans | March. Silver |
| Resistance Level 3 | 621.0 | 619.3 | 1208.00 | 3143.7 |
| Resistance Level 2 | 614.0 | 612.9 | 1203.00 | 3116.8 |
| Resistance Level 1 | 610.0 | 609.3 | 1200.00 | 3087.2 |
| Pivot Point | 603.0 | 602.9 | 1195.00 | 3060.3 |
| Support Level 1 | 599.0 | 599.3 | 1192.0 | 3030.7 |
| Support Level 2 | 592.0 | 592.9 | 1187.00 | 3003.8 |
| Support Level 3 | 588.0 | 589.3 | 1184.00 | 2974.2 |
5. Economic Reports
German PPI
2:00am
Existing Home Sales
10:ooam
