Jump to a section in this post:
1. Market Commentary
2. Support and Resistance Levels – S&P, Nasdaq, Dow Jones, Russell 2000
3. Support and Resistance Levels – Gold, Euro, Crude Oil, T-Bonds
4. Support and Resistance Levels – March Corn, March Wheat, Jan Beans, March Silver
5.Economic Report for March 6, 2012
Hello Traders,
Another day of light economic reports ahead of us before we go into a stretch of 3 FULL days of important economic reports with the biggest ones on Friday, monthly unemployment and USDA for the grains.
I think that some days, the biggest challenge a day-trader may have is NOT taking trades when there are no set ups.
I know from experience and talking to clients, that here are days when there very few set ups if at all, but the day-trader feels he or she didn’t do their job because they did not take any trades….at that point, they will look for trades when normally he/she would not take that type of trades. That usually leads to negative results. While it may be frustrating not to have set ups you like, the disciplined trader will continue to wait patiently, as hard as it may be, knowing that “no trade, is better than a bad trade”. This is how I felt about today’s trading in stock indices for most of the day….
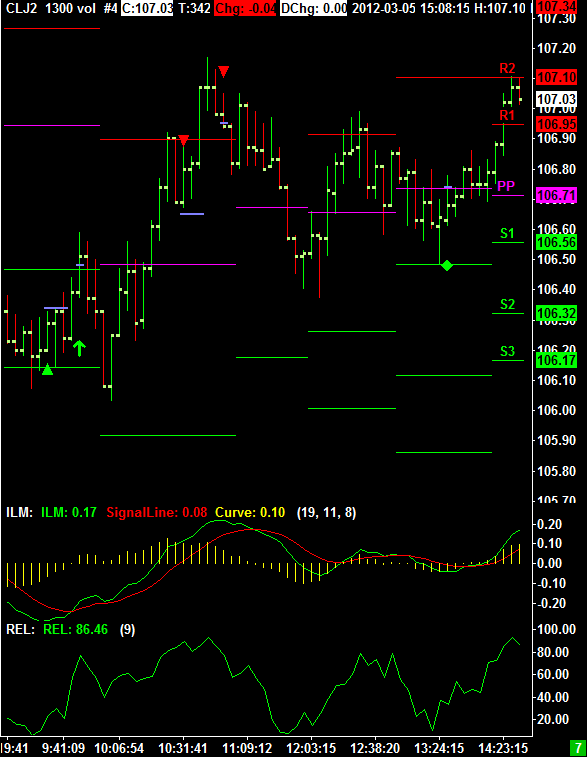
Crude Oil on the other hand, had a few good set ups and this is part of the reason I like to follow about 2-4 different markets for day trading. I try to pick markets from different segments, so I will look at either the mini SP or the mini Russell. I like the crude oil market and gold and at times I will take a look at one of the grain markets OR the Euro or any other market that has low correlation with the other ones I look at.
Below is a volume chart from today’s crude oil market using volume charts:

Would you like to have access to my DIAMOND and TOPAZ ALGOs as shown above
and be able to apply for any market and any time frame on your own PC ? You can now have a two weeks free trial where I enable the ALGO along with few studies like the ones shown above for your own sierra/ ATcharts.
If so, please send me an email with the following information:
1. Are you currently trading futures?
2. Charting software you use?
3. If you use sierra or ATcharts, please let me know the user name so I can enable you
4. Markets you currently trading?
2. Support and Resistance Levels – S&P, Nasdaq, Dow Jones, Russell 2000
| Contract (March 2012) | SP500 (big & Mini) |
Nasdaq100 (big & Mini) |
Dow Jones (big & Mini) |
Mini Russell |
| Resistance Level 3 | 1376.67 | 2671.33 | 13077 | 816.53 |
| Resistance Level 2 | 1371.83 | 2656.67 | 13018 | 810.17 |
| Resistance Level 1 | 1367.67 | 2636.33 | 12987 | 806.53 |
| Pivot Point | 1362.83 | 2621.67 | 12928 | 800.17 |
| Support Level 1 | 1358.67 | 2601.33 | 12897 | 796.53 |
| Support Level 2 | 1353.83 | 2586.67 | 12838 | 790.17 |
| Support Level 3 | 1349.67 | 2566.33 | 12807 | 786.53 |
3. Support & Resistance Levels for Gold, Euro, Crude Oil, and U.S. T-Bonds
| Contract | April. Gold | March Euro | April Crude Oil | March. Bonds |
| Resistance Level 3 | 1741.5 | 1.3339 | 109.67 | 142 5/32 |
| Resistance Level 2 | 1729.7 | 1.3292 | 108.55 | 141 29/32 |
| Resistance Level 1 | 1717.9 | 1.3256 | 107.75 | 141 12/32 |
| Pivot Point | 1706.1 | 1.3209 | 106.63 | 141 4/32 |
| Support Level 1 | 1694.3 | 1.3173 | 105.83 | 140 19/32 |
| Support Level 2 | 1682.5 | 1.3126 | 104.71 | 140 11/32 |
| Support Level 3 | 1670.7 | 1.3090 | 103.91 | 139 26/32 |
4. Support & Resistance Levels for Corn, Wheat, Beans and Silver
| Contract | May Corn | May Wheat | May Beans | May Silver |
| Resistance Level 3 | 675.8 | 675.8 | 1345.33 | 3616.3 |
| Resistance Level 2 | 670.4 | 674.7 | 1340.67 | 3555.7 |
| Resistance Level 1 | 665.6 | 673.3 | 1332.83 | 3476.8 |
| Pivot Point | 660.2 | 672.2 | 1328.17 | 3416.2 |
| Support Level 1 | 655.3 | 670.8 | 1320.3 | 3337.3 |
| Support Level 2 | 649.9 | 669.7 | 1315.67 | 3276.7 |
| Support Level 3 | 645.1 | 668.3 | 1307.83 | 3197.8 |
5. Economic Reports
5:00am EUR
Revised GDP
