Connect with Us! Use Our Futures Trading Levels and Economic Reports RSS Feed.
![]()
![]()
![]()
![]()
![]()
![]()
1. Market Commentary
2. Futures Support and Resistance Levels – S&P, Nasdaq, Dow Jones, Russell 2000, Dollar Index
3. Commodities Support and Resistance Levels – Gold, Euro, Crude Oil, T-Bonds
4. Commodities Support and Resistance Levels – Corn, Wheat, Beans, Silver
5. Futures Economic Reports for Friday June 20, 2014
Hello Traders,
For 2014 I would like to wish all of you discipline and patience in your trading!
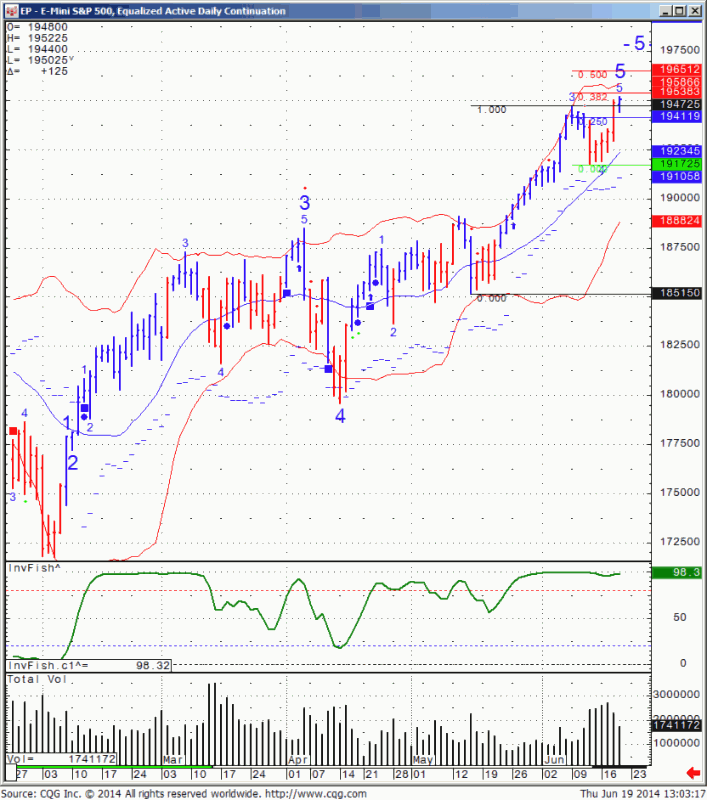
I was asked to share my daily chart based on the September contract which is the front month.
Here is the daily chart of the Sept. mini SP 500 for your review, along with indicators I like to watch and possible levels. Notice that other than a couple of “small red dots” ( which are small sell signal based on Bollinger bands) I have not gotten a sell signal on this market since beginning of January this year!! This market is over extended but I think patience is a virtue especially when a market is making all time highs…..

If you like the information we share? We would appreciate your positive reviews on our new yelp!!
GOOD TRADING
Trading Futures, Options on Futures, and retail off-exchange foreign currency transactions involves substantial risk of loss and is not suitable for all investors. You should carefully consider whether trading is suitable for you in light of your circumstances, knowledge, and financial resources. You may lose all or more of your initial investment. Opinions, market data, and recommendations are subject to change at any time.
If you like Our Futures Trading Daily Support and Resistance Levels, Please share!
| Contract Sept. 2014 | SP500 (big & Mini) | Nasdaq100 (big & Mini) | Dow Jones (big & Mini) | Mini Russell | Dollar Index |
| Resistance 3 | 1962.08 | 3832.42 | 16928 | 1195.57 | 80.82 |
| Resistance 2 | 1957.17 | 3817.83 | 16887 | 1189.13 | 80.67 |
| Resistance 1 | 1953.83 | 3803.42 | 16861 | 1183.87 | 80.54 |
| Pivot | 1948.92 | 3788.83 | 16820 | 1177.43 | 80.39 |
| Support 1 | 1945.58 | 3774.42 | 16794 | 1172.17 | 80.26 |
| Support 2 | 1940.67 | 3759.83 | 16753 | 1165.73 | 80.11 |
| Support 3 | 1937.33 | 3745.42 | 16727 | 1160.47 | 79.98 |
| Contract | August Gold | July Silver | July Crude Oil | September Bonds | Sept. Euro |
| Resistance 3 | 1380.7 | 2227.5 | 107.90 | 137 16/32 | 1.3699 |
| Resistance 2 | 1351.4 | 2160.0 | 107.15 | 136 29/32 | 1.3674 |
| Resistance 1 | 1334.9 | 2118.0 | 106.62 | 136 | 1.3640 |
| Pivot | 1305.6 | 2050.5 | 105.87 | 135 13/32 | 1.3615 |
| Support 1 | 1289.1 | 2008.5 | 105.34 | 134 16/32 | 1.3581 |
| Support 2 | 1259.8 | 1941.0 | 104.59 | 133 29/32 | 1.3556 |
| Support 3 | 1243.3 | 1899.0 | 104.06 | 133 | 1.3522 |
| Contract | July Corn | July Wheat | July Beans | July SoyMeal | July bean Oil |
| Resistance 3 | 458.9 | 596.3 | 1437.17 | 462.20 | 41.57 |
| Resistance 2 | 454.8 | 595.2 | 1429.58 | 459.60 | 41.11 |
| Resistance 1 | 452.7 | 594.3 | 1425.17 | 455.40 | 40.86 |
| Pivot | 448.6 | 593.2 | 1417.58 | 452.80 | 40.40 |
| Support 1 | 446.4 | 592.3 | 1413.2 | 448.6 | 40.2 |
| Support 2 | 442.3 | 591.2 | 1405.58 | 446.00 | 39.69 |
| Support 3 | 440.2 | 590.3 | 1401.17 | 441.80 | 39.44 |
source:http://www.forexfactory.com/calendar.php
All times are Eastern time Zone (EST)
| Date | 3:45pm | Currency | Impact | Detail | Actual | Forecast | Previous | Graph | |
|---|---|---|---|---|---|---|---|---|---|
| FriJun 20 | 2:00am | EUR | German PPI m/m | 0.2% | -0.1% | ||||
| 4:00am | EUR | Current Account | 19.4B | 18.8B | |||||
| All Day | EUR | ECOFIN Meetings | |||||||
| 10:00am | EUR | Consumer Confidence | -6 | -7 |
This is not a solicitation of any order to buy or sell, but a current market view provided by Cannon Trading Inc. Any statement of facts here in contained are derived from sources believed to be reliable, but are not guaranteed as to accuracy, nor they purport to be complete. No responsibility is assumed with respect to any such statement or with respect to any expression of opinion herein contained. Readers are urged to exercise their own judgment in trading.