Weekly Newsletter: Learn about Tick Size, Copper System, Sugar Chart + Trading Levels for Sept. 23rd

Get Real Time updates and more by joining our Private Facebook Group!
Subscribe to our YouTube Channel

C93

Cannon Futures Weekly Letter Issue # 1209

In this issue:

  • Important Notices – Heavy Fed Speaking, Active Data, Few Earnings
  • Futures 101 – Tick Size & Minimum Fluctuations
  • Hot Market of the Week – March Sugar
  • Broker’s Trading System of the Week – Copper Swing Trading System
  • Trading Levels for Next Week
  • Trading Reports for Next Week


Important Notices – Next Week Highlights:


The Week Ahead

Heavy Fed Speak Week, active data and a few earnings highlight the week ahead.


Light Earnings, by largest Market Cap

  • Wed, Micron Technologies After the close
  • Thursday, Accenture pre-open, Costco after the close


Fed Speak schedule

  • Mon. Goolsbee 9:15am CDT, Kashkari Noon CDT
  • Tues. Bowman 8:00am CDT
  • Wed. Kugler 3:00pm CDT
  • Thu. Collins 8:10amCDT, Powell 8:20am CDT, Williams 8:25 CDT, Treasury Sec. Yellen 10:15am CDT


Big Economic Data week:

  • Mon. S&P PMI Flash
  • Tues. Case-Shiller Home prices, CB Consumer Confidence, Redbook, Richmond Fed.
  • Wed. Building Permits, New Home Sales
  • Thur. Jobless Claims, Core PCE Final, GDP Final, Durable goods, Pending Home sales
  • Fri. Personal Income, Retail and Wholesale Inventories, Michigan consumer sentiment


How to Rollover on the E-Futures Platform video below

thumbnail?url=https%3A%2F%2Fi.vimeocdn


  • Futures 101: Tick Movements: Understanding How They Work

    Minimum Price Fluctuation

    All futures contracts have a minimum price fluctuation also known as a tick. Tick sizes are set by the exchange and vary by contract instrument.

    E-min S&P 500 tick

    For example, the tick size of an E-Mini S&P 500 Futures Contract is equal to one quarter of an index point. Since an index point is valued at $50 for the E-Mini S&P 500, a movement of one tick would be

    .25 x $50 = $12.50

    NYMEX WTI Crude Oil

    The tick size of the NYMEX WTI Crude Oil contract is equal to 1 cent and the WTI contract size is 1,000 barrels. Therefore, the value of a one tick move is $10.

    Summary

    Tick sizes are defined by the exchange and vary depending on the size of the financial instrument and requirements of the marketplace. Tick sizes are set to provide optimal liquidity and tight bid-ask spreads.

    The minimum price fluctuation for any CME Group contract can be found on the product specification pages.


stars

3b644da2 2bee 4d39 8d98 5208a20bec39


    • Hot Market of the Week – December Gold

    Hot market of the week is provided by QT Market Center, A Swiss army knife charting package that’s not just for Hedgers, Cooperatives and Farmers alike but also for Spread traders, Swing traders and shorter time frame application for intraday traders with a unique proprietary indicator that can be applied to your specific trading needs.

    FREE TRIAL AVAILABLE

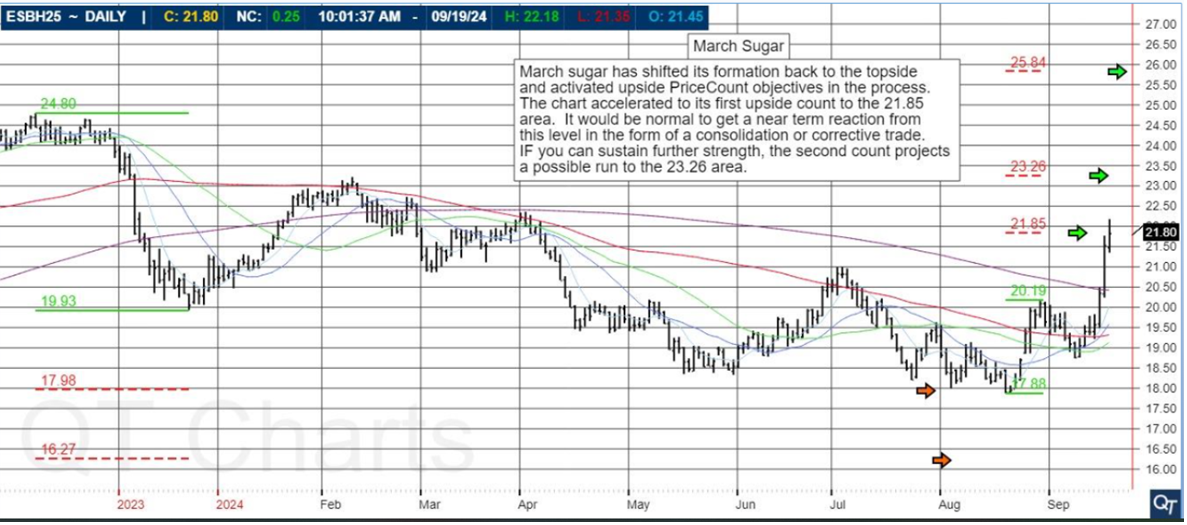
    March 2025 Sugar

    March sugar has shifted its formation back to the topisde and activated upside PriceCount objectives in the process. The chart accelerated to its first upside count to the 21.85 area. It would be normal to get a near term reaction form theis level in the form of a consolidation or corrective trdae. IF you can sustain further strength, the second count projects a possible run to the 23.26 area.


    PriceCounts – Not about where we’ve been, but where we might be going next!
1e5f6ba4 5ab1 4978 9add 01c8cc561e77
The PriceCount study is a tool that can help to project the distance of a move in price. The counts are not intended to be an ‘exact’ science but rather offer a target area for the four objectives which are based off the first leg of a move with each subsequent count having a smaller percentage of being achieved. It is normal for the chart to react by correcting or consolidating at an objective and then either resuming its move or reversing trend. Best utilized in conjunction with other technical tools, PriceCounts offer one more way to analyze charts and help to manage your positions and risk. Learn more at www.qtchartoftheday.com
Trading in futures, options, securities, derivatives or OTC products entails significant risks which must be understood prior to trading and may not be appropriate for all investors. Past performance of actual trades or strategies is not necessarily indicative of future results.

   Broker’s Trading System of the Week

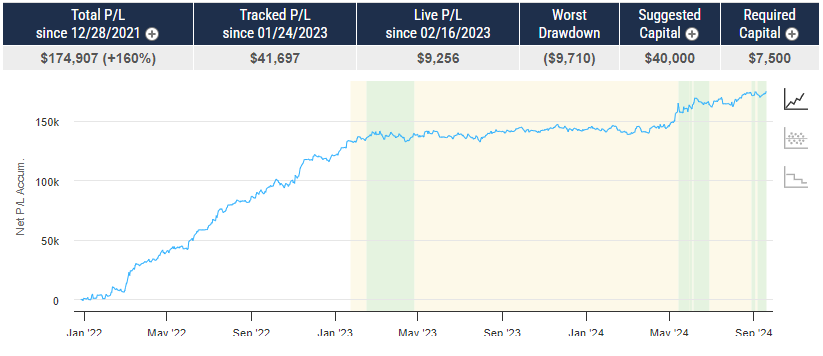
With algorithmic trading systems becoming more prevalent in portfolio diversification, the following system has been selected as the broker’s choice for this month.

Balance Cont. v.22

PRODUCT

HG – Copper
SYSTEM TYPE

Day Trading


Recommended Cannon Trading Starting Capital

$25,000.00


COST

USD 150 / monthly

Get Started

Learn More

86422252 8f48 4ff8 83d2 83943ca53099

The performance shown above is hypothetical in that the chart represents returns in a model account. The model account rises or falls by the average single contract profit and loss achieved by clients trading actual money pursuant to the listed system’s trading signals on the appropriate dates (client fills), or if no actual client profit or loss available – by the hypothetical single contract profit and loss of trades generated by the system’s trading signals on that day in real time (real‐time) less slippage, or if no real time profit or loss available – by the hypothetical single contract profit and loss of trades generated by running the system logic backwards on back adjusted data. Please read full disclaimer HERE.
Would you like to receive daily support & resistance levels?
Yes
S
No
S

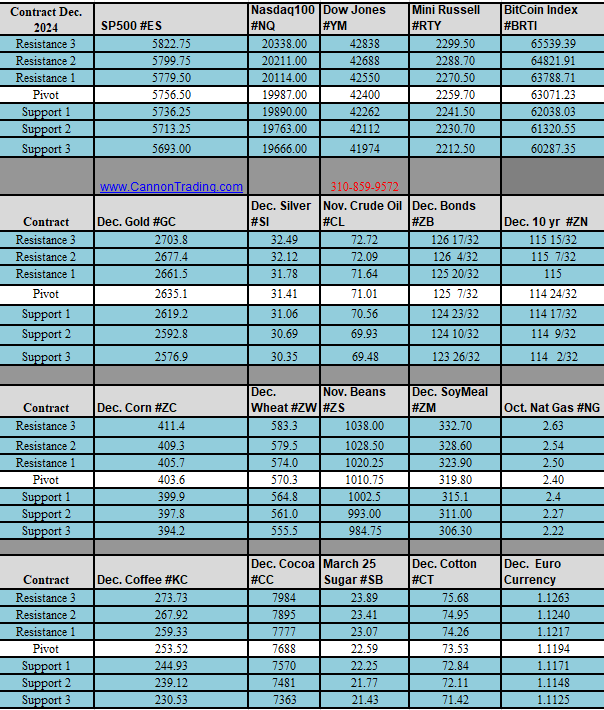
Daily Levels for September 23rd 2024

5f2ead23 5c67 4d34 94a9 f65f637a95b1


Trading Reports for Next Week

435212a9 6b73 4c73 a2f0 fcb1ef3233f7

bf9b3e0d 9c23 44e8 980c a8c01bfbe2cf

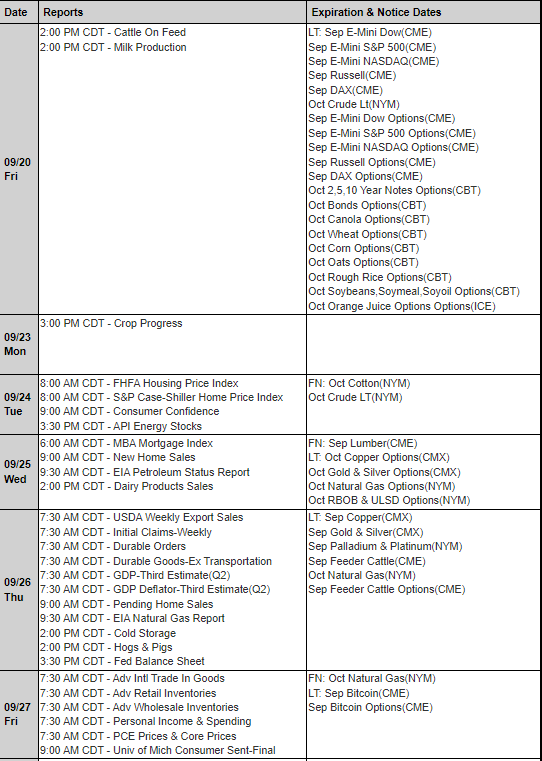
Trading Reports for Next Week

First Notice (FN), Last trading (LT) Days for the Week:
174942e6 4ea7 461f aa6d db529188220c

Improve Your Trading Skills

Get access to proprietary indicators and trading methods, consult with an experienced broker at 1-800-454-9572.

Explore trading methods. Register Here

* This is not a solicitation of any order to buy or sell, but a current market view provided by Cannon Trading Inc. Any statement of facts here in contained are derived from sources believed to be reliable, but are not guaranteed as to accuracy, nor they purport to be complete. No responsibility is assumed with respect to any such statement or with respect to any expression of opinion herein contained. Readers are urged to exercise their own judgement in trading.

Triple Witching Tomorrow: September Stock Index Futures Expire, Shift to December (ESZ24)

Get Real Time updates and more by joining our Private Facebook Group!

Subscribe to our YouTube Channel

Listen to our Market Recap Podcasts on Apple Podcasts


C62

TriPPPle witching tomorrow!

Stock Index September contracts (i.e., the E-mini and Micro S&P, Nasdaq, Dow Jones and Russell 2000.) expire Friday, Sept. 20th (8:30 A.M., Central Time). At that point, trading in these contracts halts. Stock index futures are CASH SETTLED contracts. If you hold any September futures contracts through 8:30 A.M., Central Time on Friday, they will be offset with the cash settlement price, as set by the exchange.

FRONT MONTH IS NOW DECEMBER , the symbol is Z24, example for mini SP is ESZ24

Plan your trade and trade your plan

stars

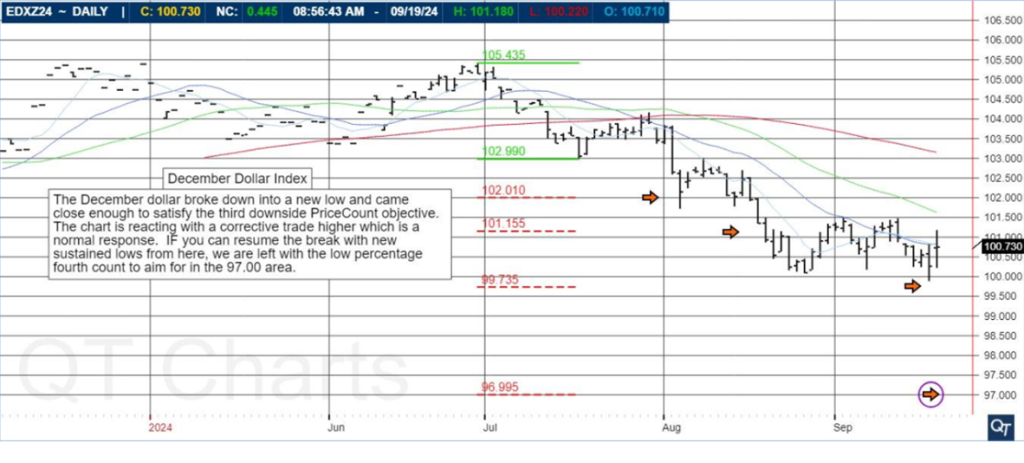
December Dollar Index

The December dollar broke down into a new low and came close enough to satisfy the third downside PriceCount objective. The chart is reacting with a corrective trade higher which is a normal response. IF you can resume the break with new sustained lows from here, we are left with the low percentage fourth count to aim for in the 97.00 area.

image 1

The PriceCount study is a tool that can help to project the distance of a move in price. The counts are not intended to be an ‘exact’ science but rather offer a target area for the four objectives which are based off the first leg of a move with each subsequent count having a smaller percentage of being achieved. It is normal for the chart to react by correcting or consolidating at an objective and then either resuming its move or reversing trend. Best utilized in conjunction with other technical tools, PriceCounts offer one more way to analyze charts and help to manage your positions and risk. Learn more at www.qtchartoftheday.com

Trading in futures, options, securities, derivatives or OTC products entails significant risks which must be understood prior to trading and may not be appropriate for all investors. Past performance of actual trades or strategies is not necessarily indicative of future results. 

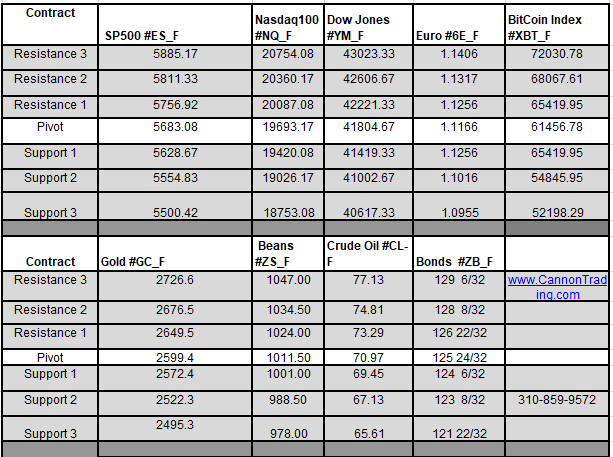
Daily Levels for September 20, 2024

image

Economic Reports

provided by: ForexFactory.com

All times are Eastern Time ( New York)

image 2

Improve Your Trading Skills

Get access to proprietary indicators and trading methods, consult with an experienced broker at 1-800-454-9572.

Explore trading methods. Register Here

3b644da2 2bee 4d39 8d98 5208a20bec39

* This is not a solicitation of any order to buy or sell, but a current market view provided by Cannon Trading Inc. Any statement of facts here in contained are derived from sources believed to be reliable, but are not guaranteed as to accuracy, nor they purport to be complete. No responsibility is assumed with respect to any such statement or with respect to any expression of opinion herein contained. Readers are urged to exercise their own judgement in trading.

4 Years in the Making: Will the Fed Cut Rates by 0.25 or 0.50 Tomorrow?

Get Real Time updates and more by joining our Private Facebook Group!
Subscribe to our YouTube Channel
Listen to our Market Recap Podcasts on Apple Podcasts


C95


4 Years in the Making

By John Thorpe, Senior Broker


How Much will the FOMC Cut rates tomorrow? .25 or .50 basis points from 5.25/5.5 % ?

As of the issuance of this Blog Post. The September Fed Funds futures contract is reflecting a 63% probability of a .50 basis point cut and 37% probability of a .25 basis cut.

It is my view, not Cannon Trading company’s ,that a .25 basis rate cut would disappoint the Equity index markets as the recent rally had caught steam at every turn when the possibility of .50 rate cut was mentioned by FOMC governors during public speeches and the most recent economic data revealing a softening of economic data and loosening of a previously tight labor market . ( You may recall on August 21st the Bureau of Labor Statistics released a report that jobs growth had been overstated by more than 800,000 souls between 3/23 and 3/24?) Where was the ES trading at the close of business on that day? 5641.50 , we are still in that wheelhouse. A .50 basis point cut may continue the current rally. 1:00 pm EDT , the first rate cut in 4 years will be here, are you ready?


Tomorrow: in addition to Rates and Powell Presser; you will also get FOMC Summary of Economic Projections (released only 4 times a year during rate announcements)

Here is a sample of the summary of Economic events from the June ’24 rate decision meeting, not to be confused with the FOMC Minutes.  https://Https://www.federalreserve.gov/monetarypolicy/files/fomcprojtabl20240612.pdf


stars


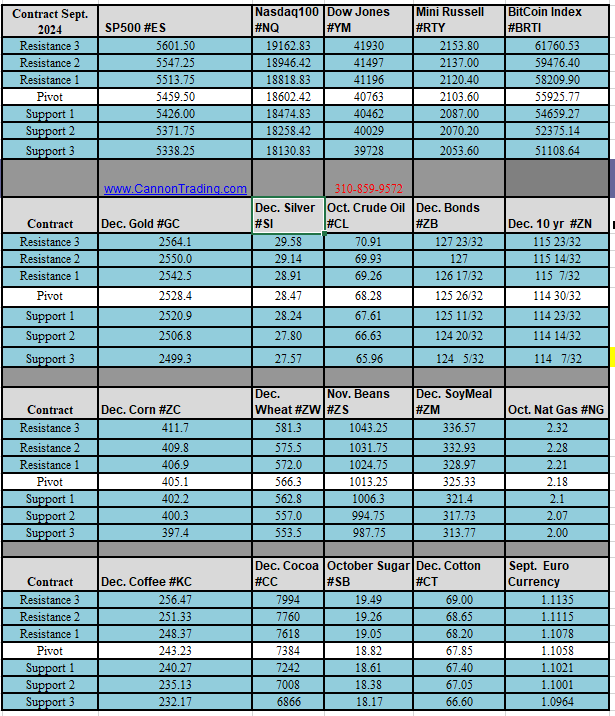
Daily Levels for September 18, 2024

d89ee7b4 38fa 456c afb0 daa47a7b7d3f


Economic Reports
provided by: ForexFactory.com
All times are Eastern Time ( New York)
21d8ec2e e28c 43a2 8db6 661aaec14606

Improve Your Trading Skills

Get access to proprietary indicators and trading methods, consult with an experienced broker at 1-800-454-9572.

Explore trading methods. Register Here

3b644da2 2bee 4d39 8d98 5208a20bec39

* This is not a solicitation of any order to buy or sell, but a current market view provided by Cannon Trading Inc. Any statement of facts here in contained are derived from sources believed to be reliable, but are not guaranteed as to accuracy, nor they purport to be complete. No responsibility is assumed with respect to any such statement or with respect to any expression of opinion herein contained. Readers are urged to exercise their own judgement in trading.

Prepare for a Disciplined Week: FOMC, Contract Rollover, and More – Stay Focused!

Get Real Time updates and more by joining our Private Facebook Group!
Subscribe to our YouTube Channel
Listen to our Market Recap Podcasts on Apple Podcasts


C70


Busy week ahead! FOMC, contract rollover and more. Make it a solid, disciplined trading week!

Friday, Sept. 20th is Last Trading Day for September stock index futures contracts, i.e., the E-mini S&P, E-mini NASDAQ, E-mini Dow Jones and their Micro relatives. These futures contracts will halt trading at 8:30 A.M., Central Time and are cash settled, meaning any remaining open positions will be offset/settled using a to-be-determined settlement price. It is recommended that all new positions be placed in the December ’24 contracts.

Volume in the September ‘24 contracts will begin to drop off until their expiration next Friday, September 20.

Trading levels on our blog will switch to the December contract tomorrow!

See below a screen shot of volume and open interest on the Mini SP contract for example:

d3f5718a 2ddc 43a2 a821 d1ea61d208a1


stars


059b231c 189d 4c3f 9964 ac98a1f114f0


How to roll over Chart and DOM on E-Futures


thumbnail?url=https%3A%2F%2Fi.vimeocdn

Daily Levels for September 17, 2024

0aa02d5e a8a5 41cf 8220 0ea12526c150


Economic Reports
provided by: ForexFactory.com
All times are Eastern Time ( New York)
df95071f afdb 428d 9deb 3604425ff864

Improve Your Trading Skills

Get access to proprietary indicators and trading methods, consult with an experienced broker at 1-800-454-9572.

Explore trading methods. Register Here

3b644da2 2bee 4d39 8d98 5208a20bec39

* This is not a solicitation of any order to buy or sell, but a current market view provided by Cannon Trading Inc. Any statement of facts here in contained are derived from sources believed to be reliable, but are not guaranteed as to accuracy, nor they purport to be complete. No responsibility is assumed with respect to any such statement or with respect to any expression of opinion herein contained. Readers are urged to exercise their own judgement in trading.

Weekly Newsletter: Learn About Rollover, Gold Chart + Trading Levels for Sept. 16th

Get Real Time updates and more by joining our Private Facebook Group!
Subscribe to our YouTube Channel

C3

Cannon Futures Weekly Letter Issue # 1208

In this issue:

  • Important Notices – Rollover and FOMC
  • Futures 101 – Learn About Contract Expiration, Rollover, Offset Options
  • Hot Market of the Week – December Gold
  • Broker’s Trading System of the Week – NQ Day Trading System
  • Trading Levels for Next Week
  • Trading Reports for Next Week


Important Notices – Next Week Highlights:


Fed Rate Decision, Index Contract rollover, within a somewhat active Data week.

Light Earnings (185 companies) Week:

  • Gen Mills, Fedex and Lennar, headline


Fed Rate Decision Wednesday. 1:00PM Central with Q and A to follow @ 1:30 PM central.


Somewhat Active Data week:

  • Mon. NY Empire State Index,
  • Tues. Retail Sales, RedBook, Industrial Production
  • Wed. Bldg Permits, Housing Starts, Fed Rate Decision, FOMC Economic Projections
  • Thu. Jobless Claims, Philly Fed Manufacturing, Existing Home Sales
  • Fri. No news is good news?

Currencies Last Trading Day & Stock Index rollover

Monday, September 16th is Last Trading Day for all currency futures contracts, except the Canadian Dollar (Last Trading Day for the Canadian Dollar is Tuesday, September 14th). Currency futures contracts are DELIVERABLE contracts. You need to exit all long and short open positions or be required to deliver or take delivery of the ACTUAL NOMINAL VALUE of the respective futures contract, i.e. $12,500 Euros, or $12,500,000 Japanese Yen. DO NOT put your account is this position. Exit all September currency futures. Start trading currency futures with the December futures contracts.


Friday, Sept. 20th is Last Trading Day for September stock index futures contracts, i.e., the E-mini S&P, E-mini NASDAQ, E-mini Dow Jones and their Micro relatives. These futures contracts will halt trading at 8:30 A.M., Central Time and are cash settled, meaning any remaining open positions will be offset/settled using a to-be-determined settlement price. It is recommended that all new positions be placed in the December ’24 contracts as of Sunday’s opening. Volume in the September ‘24 contracts will begin to drop off until their expiration next Friday, September 20.


How to Rollover on the E-Futures Platform video below

thumbnail?url=https%3A%2F%2Fi.vimeocdn


  • Futures 101: Understanding Futures Expiration & Contract Roll

    • Contract Expiration Options
    • Lifespan of future contracts
    • Rollover

    ACCESS THE COURSE NOW


stars

3b644da2 2bee 4d39 8d98 5208a20bec39


    • Hot Market of the Week – December Gold

    Hot market of the week is provided by QT Market Center, A Swiss army knife charting package that’s not just for Hedgers, Cooperatives and Farmers alike but also for Spread traders, Swing traders and shorter time frame application for intraday traders with a unique proprietary indicator that can be applied to your specific trading needs.

    FREE TRIAL AVAILABLE

    December Gold


    December gold has resumed its rally into new highs. This has the chart aim at its third upside PriceCount objective to the 2620 area. It would be normal to get a near term reaction int the form of a consolidation or corrective trade, at least, upon satisfying the count. The low percentage fourth target to 3325 is not shown here for presentation purposes.


    PriceCounts – Not about where we’ve been, but where we might be going next!

cf4501c2 c737 4f27 a322 2a1638672e29
The PriceCount study is a tool that can help to project the distance of a move in price. The counts are not intended to be an ‘exact’ science but rather offer a target area for the four objectives which are based off the first leg of a move with each subsequent count having a smaller percentage of being achieved. It is normal for the chart to react by correcting or consolidating at an objective and then either resuming its move or reversing trend. Best utilized in conjunction with other technical tools, PriceCounts offer one more way to analyze charts and help to manage your positions and risk. Learn more at www.qtchartoftheday.com
Trading in futures, options, securities, derivatives or OTC products entails significant risks which must be understood prior to trading and may not be appropriate for all investors. Past performance of actual trades or strategies is not necessarily indicative of future results.

   Broker’s Trading System of the Week

With algorithmic trading systems becoming more prevalent in portfolio diversification, the following system has been selected as the broker’s choice for this month.

Fusion NQ

PRODUCT

NQ – Mini NASDAQ


SYSTEM TYPE

Day Trading


Recommended Cannon Trading Starting Capital

$36,000.00


COST

USD 150 / monthly

Get Started

Learn More

486140b4 5560 4afe a015 07a529272bef

The performance shown above is hypothetical in that the chart represents returns in a model account. The model account rises or falls by the average single contract profit and loss achieved by clients trading actual money pursuant to the listed system’s trading signals on the appropriate dates (client fills), or if no actual client profit or loss available – by the hypothetical single contract profit and loss of trades generated by the system’s trading signals on that day in real time (real‐time) less slippage, or if no real time profit or loss available – by the hypothetical single contract profit and loss of trades generated by running the system logic backwards on back adjusted data. Please read full disclaimer HERE.
Would you like to receive daily support & resistance levels?
Yes
S
No
S

Daily Levels for September 16th 2024

fe7b0bf7 db24 4464 8b35 f727a4292f7e


Trading Reports for Next Week

3005a3dc f2f9 40cb beb4 a6e54bacbe94

bf9b3e0d 9c23 44e8 980c a8c01bfbe2cf

Trading Reports for Next Week

First Notice (FN), Last trading (LT) Days for the Week:
e5322dea e362 4015 a40b 3e9bf2281d92

Improve Your Trading Skills

Get access to proprietary indicators and trading methods, consult with an experienced broker at 1-800-454-9572.

Explore trading methods. Register Here

* This is not a solicitation of any order to buy or sell, but a current market view provided by Cannon Trading Inc. Any statement of facts here in contained are derived from sources believed to be reliable, but are not guaranteed as to accuracy, nor they purport to be complete. No responsibility is assumed with respect to any such statement or with respect to any expression of opinion herein contained. Readers are urged to exercise their own judgement in trading.
Unlocking Bitcoin’s Potential: Trading Futures for Profit Without Holding Bitcoin

Get Real Time updates and more by joining our Private Facebook Group!
Subscribe to our YouTube Channel
Listen to our Market Recap Podcasts on Apple Podcasts


Bitcoin


Bitcoin Futures

By Mark O’Brien, Senior Broker


Typically, if you’re interested in Bitcoin, it’s for two reasons:


One is that you want to convert your dollars to Bitcoin so that you can buy products and services with it, because there’s no administrator involved in the transaction like a bank or credit card company, or a PayPal or Zelle-type of entity.  That’s why it’s called a decentralized currency: only the two sides of the transaction can see it.


But unlike a currency-backed transaction – like U.S. dollar transactions – Bitcoin transactions don’t come with legal protection and they’re typically not reversible, which makes them susceptible to scams.  And if or when you convert your Bitcoin back to U.S. dollars, you have to report capital gains and losses.


The fact is cash – and in particular the U.S. dollar – is still king.  In the entire world, the dollar is currently involved in almost 60% of all transactions – in commerce, business and in trading.  That’s compared to the next most used currency, the Euro at ±13%.  In third place is the Japanese yen at ±5%.  All the other currencies in the world, including such notables as the Swiss Franc, British pound, Chinese yuan and to a miniscule degree Bitcoin – they’re all little tiny slivers to the financial transaction pie.  That’s why people invest with U.S. dollars.


This brings me to the other reason people are interested in Bitcoin: it’s an asset that moves up and down in price and that movement can be an opportunity to increase the value of your Bitcoin you hold.  The unfortunate shortcoming for Bitcoin investors however, is that you’re limited only to profiting from buying Bitcoin low and selling high – and converting your Bitcoin back to dollars to realize any profit.


There’s a much better alternative to invest in Bitcoin.  For people looking to profit from Bitcoin price movement: consider trading the price movement you see in Bitcoin every day, yet never have to actually be in Bitcoin, but rather a derivative of it.  Trade an asset that moves in sync with Bitcoin, is valued and traded in U.S. dollars and is listed on the largest financial derivatives exchange in the world.


The exchange I’m talking about is the CME Group, and the asset – there are actually three assets: the Bitcoin futures contract, the Micro Bitcoin futures contract and the newest Bitcoin Friday futures contract (sized at 1/50 of a Bitcoin like the Micro Bitcoin and cash-settled every Friday).


These three assets trade on the CME where all participants see the same prices and quotes and you enjoy the price discovery of a transparent futures contract.  Of course, as a futures contract you can trade on the long and short side of the market.


If you’re a trader – in stocks, mutual funds, real estate, or other commodity futures such as stock indexes, precious metals, energies, grains, etc. and you’re looking to diversify your assets into digital currency and Bitcoin specifically, look into Bitcoin futures and trade with assurance in the asset.

Trade Micro Bitcoin with real-time price and DEMO money INSTANTLY


stars


Daily Levels for September 13, 2024

6cf7e978 b701 4e04 9259 b2e519612327

d2f804c7 f7ea 40e2 9b38 5681293c1d7f


December Gold

December gold has resumed its rally into new highs. This has the chart aim at its third upside PriceCount objective to the 2620 area. It would be normal to get a near term reaction int the form of a consolidation or corrective trade, at least, upon satisfying the count. The low percentage fourth target to 3325 is not shown here for presentation purposes.

The PriceCount study is a tool that can help to project the distance of a move in price. The counts are not intended to be an ‘exact’ science but rather offer a target area for the four objectives which are based off the first leg of a move with each subsequent count having a smaller percentage of being achieved. It is normal for the chart to react by correcting or consolidating at an objective and then either resuming its move or reversing trend. Best utilized in conjunction with other technical tools, PriceCounts offer one more way to analyze charts and help to manage your positions and risk. Learn more at www.qtchartoftheday.com


Trading in futures, options, securities, derivatives or OTC products entails significant risks which must be understood prior to trading and may not be appropriate for all investors. Past performance of actual trades or strategies is not necessarily indicative of future results.


Economic Reports
provided by: ForexFactory.com
All times are Eastern Time ( New York)
eec19d1c d9dd 4580 90df 6b97ecac0720

Improve Your Trading Skills

Get access to proprietary indicators and trading methods, consult with an experienced broker at 1-800-454-9572.

Explore trading methods. Register Here

3b644da2 2bee 4d39 8d98 5208a20bec39

* This is not a solicitation of any order to buy or sell, but a current market view provided by Cannon Trading Inc. Any statement of facts here in contained are derived from sources believed to be reliable, but are not guaranteed as to accuracy, nor they purport to be complete. No responsibility is assumed with respect to any such statement or with respect to any expression of opinion herein contained. Readers are urged to exercise their own judgement in trading.

Post-CPI Market Reversal: Stock Indices Lead the Charge, Eyes on Jobless Claims and PPI Tomorrow

Get Real Time updates and more by joining our Private Facebook Group!
Subscribe to our YouTube Channel
Listen to our Market Recap Podcasts on Apple Podcasts


C35


Interesting action to say the least following CPI this morning.

Indices, energies and metals sold off and then made a V type reversal, mostly with stock indices, NASDAQ and SP leading the way – ES and NQ.

See a 30 minute chart from today below.

As far as tomorrow:

US weekly jobless claims will be released at 7:30 am CT Thursday morning, initial claims are expected at 225,000, down -2,000 from the prior week.


US August producer price indices (PPI) will be released Thursday morning at 7:30 am CT, analysts expect final demand PPI +0.2% month over month, and expect the core PPI up +0.2% compared to the previous month.

ECB Press conference at 7:45 AM Central time.

Natural gas inventories at 9:30 Am central


stars


Daily Levels for September 12, 2024

6cf03336 57ef 4777 a5b8 bc2c418b295c


Economic Reports
provided by: ForexFactory.com
All times are Eastern Time ( New York)
d8c7300d 8cae 4a1f b883 a486c4f2bbb9

Improve Your Trading Skills

Get access to proprietary indicators and trading methods, consult with an experienced broker at 1-800-454-9572.

Explore trading methods. Register Here

3b644da2 2bee 4d39 8d98 5208a20bec39

* This is not a solicitation of any order to buy or sell, but a current market view provided by Cannon Trading Inc. Any statement of facts here in contained are derived from sources believed to be reliable, but are not guaranteed as to accuracy, nor they purport to be complete. No responsibility is assumed with respect to any such statement or with respect to any expression of opinion herein contained. Readers are urged to exercise their own judgement in trading.
Crude Oil Plunge, Tropical Storm Francine, and Tomorrow’s CPI – Movers and Shakers

Get Real Time updates and more by joining our Private Facebook Group!
Subscribe to our YouTube Channel
Listen to our Market Recap Podcasts on Apple Podcasts


C69


Movers and shakers!

By John Thorpe, Senior Broker


Oil took a $2.40 nosedive when OPEC announced a smaller than expected demand growth forecast for 2025. Flirting with the low end of the 25 month old range, October crude held it’s ground around $66.00/bbl , a mere dollar from the springtime 2023 lows.

Tropical Storm Francine landfall, Basel III Endgame, and tomorrows big number (hint, CPI)

Tonight: Debate for the Presidency 8 p.m. Central.

Today’s News:

Updated: September 10, 2024 5:30 am

**NFIB August US small business optimism index: 91.2 ; prior month 93.7


Updated: September 10, 2024 5:51 am

Chinese customs data released Tuesday showed they imported a record 12.14 mln mt of Soybeans during August 2024, up +29% over August 2023 imports. January through August 2024 soy imports are 70.48 mln mt, up +2.8% over the same period in 2023.


Updated: September 10, 2024 7:01 am

**OPEC cut their 2024 worldwide crude oil demand growth forecast to 2.03 mln bpd from the previous 2.11 mln bpd


Updated: September 10, 2024 7:55 am

Redbook Weekly US Retail Sales Headline Recap


**Redbook Weekly US Retail Sales were +6.5% in the first week of September 2024 vs September 2023

**Redbook Weekly US Retail Sales were +6.5% in the week ending September 7 vs yr ago week


Updated: September 10, 2024 9:21 am

*Federal Reserve Vice Chair of Bank Supervision Barr Tuesday said he’ll recommend regulators re-propose “Basel endgame” and worldwide systemically important bank surcharge capital rules. Seeks to exempt banks under $250 billion in assets from most new requirements, and update for changes to inflation and economic growth


Updated: September 10, 2024 12:26 pm

Shell on Tuesday said they’ve shuttered oil production at their Perdido, Aug er and Enchilada/Salsa platforms in the Gulf of Mexico due to downstream impacts from TS Francine

Updated: September 10, 2024 12:49 pm

On Tuesday, the Port of New Orleans said terminal operations will be shuttered as tropical storm Francine approaches the Louisiana coast, and following damage assessments, they expect operations to resume on Sept 12th.

Updated: September 10, 2024 12:51 pm

Energy industry sources say Exxon Mobil ahead of the tropical storm is reducing their Baton Rouge refinery production, but plans to operate the facility with minimum staff levels.


Watch Tomorrow’s Movers and Shakers:


CPI Consumer Price Index @ 7:30 am CDT.


Consensus Outlook

Overall prices are expected to rise 0.2 percent in August that would match the as-expected 0.2 percent rise in July. Core prices also increased an as-expected 0.2 percent in July with August’s consensus also at 0.2 percent. Annual rates, which in July were 2.9 percent overall and 3.2 percent for the core (both 1 tenth lower than June), are expected at 2.6 and 3.2 percent, respectively.


Earnings: very quiet, only 22 firms reporting


stars


Daily Levels for September 11, 2024

c59e4551 2064 44b4 b6d9 fd0a7bbd0017
e1d285c5 1cdb 4750 b2c0 b059b8a1833d

December-March Meal Spread

The Dec-March meal spread corrected after completing its first downside PriceCount objective last month. Now, the chart is threatening to break down and resume its slide. New sustained lows from here would project a possible run to the second count to the -7.3 area.

The PriceCount study is a tool that can help to project the distance of a move in price. The counts are not intended to be an ‘exact’ science but rather offer a target area for the four objectives which are based off the first leg of a move with each subsequent count having a smaller percentage of being achieved. It is normal for the chart to react by correcting or consolidating at an objective and then either resuming its move or reversing trend. Best utilized in conjunction with other technical tools, PriceCounts offer one more way to analyze charts and help to manage your positions and risk. Learn more at www.qtchartoftheday.com

Trading in futures, options, securities, derivatives or OTC products entails significant risks which must be understood prior to trading and may not be appropriate for all investors. Past performance of actual trades or strategies is not necessarily indicative of future results.


Economic Reports
provided by: ForexFactory.com
All times are Eastern Time ( New York)
d69d902a c4af 4385 9b49 b86bad3d51cd

Improve Your Trading Skills

Get access to proprietary indicators and trading methods, consult with an experienced broker at 1-800-454-9572.

Explore trading methods. Register Here

3b644da2 2bee 4d39 8d98 5208a20bec39

* This is not a solicitation of any order to buy or sell, but a current market view provided by Cannon Trading Inc. Any statement of facts here in contained are derived from sources believed to be reliable, but are not guaranteed as to accuracy, nor they purport to be complete. No responsibility is assumed with respect to any such statement or with respect to any expression of opinion herein contained. Readers are urged to exercise their own judgement in trading.

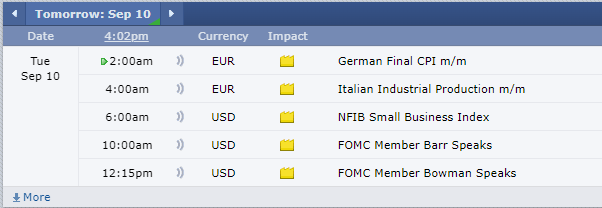
Reports for the Week Ahead and Trading Levels for 9.10.24

Get Real Time updates and more by joining our Private Facebook Group!
Subscribe to our YouTube Channel
Listen to our Market Recap Podcasts on Apple Podcasts


C77


Reports for the week ahead below. Make it a solid, disciplined trading week!


98136344 aff7 400d bd45 248b070c9383


stars


Daily Levels for September 10, 2024

c51f080c b663 4fb0 bf37 590d1bf793a3


Economic Reports
provided by: ForexFactory.com
All times are Eastern Time ( New York)
fcbcb22a dd10 4414 85dc ece523618772

Improve Your Trading Skills

Get access to proprietary indicators and trading methods, consult with an experienced broker at 1-800-454-9572.

Explore trading methods. Register Here

3b644da2 2bee 4d39 8d98 5208a20bec39

* This is not a solicitation of any order to buy or sell, but a current market view provided by Cannon Trading Inc. Any statement of facts here in contained are derived from sources believed to be reliable, but are not guaranteed as to accuracy, nor they purport to be complete. No responsibility is assumed with respect to any such statement or with respect to any expression of opinion herein contained. Readers are urged to exercise their own judgement in trading.

Weekly Newsletter: Learn About Key Economic Reports + Trading Levels for Sept. 9th

Get Real Time updates and more by joining our Private Facebook Group!
Subscribe to our YouTube Channel

Future S&P Trade

Cannon Futures Weekly Letter Issue # 1207

In this issue:

  •  Important Notices – PPI, CPI, WASDE, Fed Blackout Period
  • Futures 101 – Videos :Learn to Trade Around Economic Reports
  • Hot Market of the Week – October Feeder Cattle
  • Broker’s Trading System of the Week – British Pound Swing Trading System
  • Trading Levels for Next Week
  • Trading Reports for Next Week

Important Notices – Next Week Highlights:

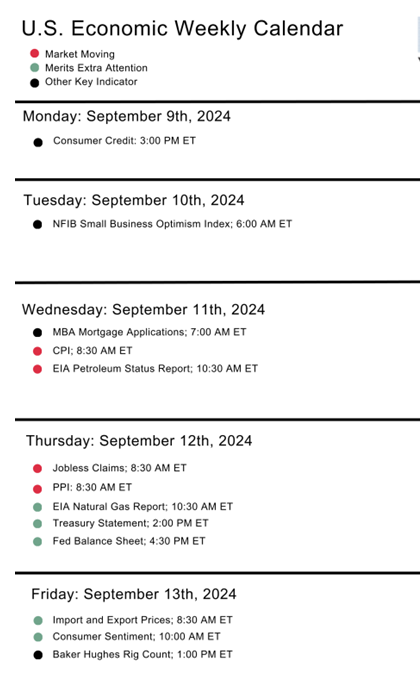
  • CPI and PPI headline next week’s market volatility 

    Economic Data:

    Mon. Wholesale Trade and Consumer Credit

    Tue. Redbook

    Wed. CPI

    Thu. Core PPI, Initial Jobless Claims, Fed, Govt, Monthly Budget Statement

    Fri. Export Prices, Michigan Consumer Sentiment.


    Fed Speakers:

    FED “Blackout Period” begins tomorrow: No FOMC speakers until Chair Powell at the conclusion of the September 18th rate decision.


    Agriculture:

    Thu. WASDE and Prop Production


    Earnings:


    Mon. Oracle

    Tue. Gamestop

    Thu. Adobe


  • Futures 101: Trading Key Economic Reports.

    As a trader, you will come across many factors that you must consider before entering or exiting the markets. Some of the most important aspects to look for are economic events that can move the markets drastically one way or another.

    There are many types of economic events including releases by a governing body, changes in sales or consumption of commodities, and increases in supply and demand. All of these can affect the markets you trade, making it important for you to know how and when these changes are happening.
    In this “Trading Around Key Economic Reports” FREE Course you will learn:

    • What is GDP?
    • About the Retail Sales Report
    • What is NFP ( non farm payroll) Report?
    • Understanding US housing Data
    • FOMC
    • Understanding Oil Data Report
    • Importance of Consumer Confidence Survey

    ACCESS THE COURSE NOW


stars

3b644da2 2bee 4d39 8d98 5208a20bec39


    • Hot Market of the Week – October Feeders

    Hot market of the week is provided by QT Market Center, A Swiss army knife charting package that’s not just for Hedgers, Cooperatives and Farmers alike but also for Spread traders, Swing traders and shorter time frame application for intraday traders with a unique proprietary indicator that can be applied to your specific trading needs.

    FREE TRIAL AVAILABLE

    October Feeder Cattle


    October Feeder Cattle completed its first downside PriceCount objective last month and corrected. IF the chart can resume its break into new sustained lows, the second count would project a possible slide to the 223.94 area.


    PriceCounts – Not about where we’ve been, but where we might be going next!

58f81953 7a5b 4ce9 afa7 8dd0788b66ed
The PriceCount study is a tool that can help to project the distance of a move in price. The counts are not intended to be an ‘exact’ science but rather offer a target area for the four objectives which are based off the first leg of a move with each subsequent count having a smaller percentage of being achieved. It is normal for the chart to react by correcting or consolidating at an objective and then either resuming its move or reversing trend. Best utilized in conjunction with other technical tools, PriceCounts offer one more way to analyze charts and help to manage your positions and risk. Learn more at www.qtchartoftheday.com
Trading in futures, options, securities, derivatives or OTC products entails significant risks which must be understood prior to trading and may not be appropriate for all investors. Past performance of actual trades or strategies is not necessarily indicative of future results.

   Broker’s Trading System of the Week

With algorithmic trading systems becoming more prevalent in portfolio diversification, the following system has been selected as the broker’s choice for this month.

CONES BRITISH YM LUDOVIC

PRODUCT

BP – British Pound


SYSTEM TYPE

Swing


Recommended Cannon Trading Starting Capital

$12,000


COST

USD 90 / monthly

Get Started

Learn More

44a9cf4e f7dc 4e1b b69a fadf4b5ac1f9

The performance shown above is hypothetical in that the chart represents returns in a model account. The model account rises or falls by the average single contract profit and loss achieved by clients trading actual money pursuant to the listed system’s trading signals on the appropriate dates (client fills), or if no actual client profit or loss available – by the hypothetical single contract profit and loss of trades generated by the system’s trading signals on that day in real time (real‐time) less slippage, or if no real time profit or loss available – by the hypothetical single contract profit and loss of trades generated by running the system logic backwards on back adjusted data. Please read full disclaimer HERE.
Would you like to receive daily support & resistance levels?
Yes
S
No
S

Daily Levels for September 9th 2024

86c38fb0 967e 4577 b7e4 23b9e18e159e


Trading Reports for Next Week

ab53f06b c2e1 4782 a8a8 9062334e5339

bf9b3e0d 9c23 44e8 980c a8c01bfbe2cf

Trading Reports for Next Week

First Notice (FN), Last trading (LT) Days for the Week:
bbe2138c 1472 4ce9 9bd9 da22f88802f0

Improve Your Trading Skills

Get access to proprietary indicators and trading methods, consult with an experienced broker at 1-800-454-9572.

Explore trading methods. Register Here

* This is not a solicitation of any order to buy or sell, but a current market view provided by Cannon Trading Inc. Any statement of facts here in contained are derived from sources believed to be reliable, but are not guaranteed as to accuracy, nor they purport to be complete. No responsibility is assumed with respect to any such statement or with respect to any expression of opinion herein contained. Readers are urged to exercise their own judgement in trading.