Crude Oil Futures Chart & Futures/Commodities Levels 5.07.2014

Connect with Us! Use Our Futures Trading Levels and Economic Reports RSS Feed.

Like us on FacebookFollow us on TwitterView our profile on LinkedInFind us on Google+Cannon Trading Futures Trading Resistance & Support Levels and Economic ReportsFind us on Yelp

1. Market Commentary
2. Futures Support and Resistance Levels – S&P, Nasdaq, Dow Jones, Russell 2000, Dollar Index
3. Commodities Support and Resistance Levels – Gold, Euro, Crude Oil, T-Bonds
4. Commodities Support and Resistance Levels – Corn, Wheat, Beans, Silver
5. Futures Economic Reports for Wednesday May 7, 2014

Hello Traders,

For 2014 I would like to wish all of you discipline and patience in your trading!

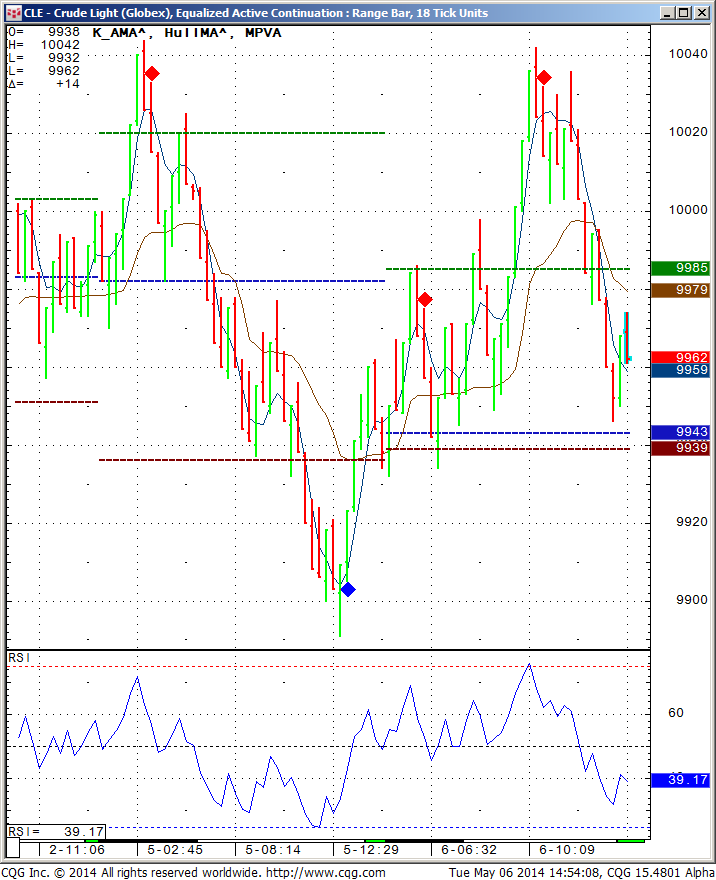
 Below is a screen shot of the Crude Oil chart from the last few trading sessions. I use 18 ticks range bar chart. This model does well when the market has two sided volatility and action like in the chart below but tend to get chopped when there is a strong trend.


809 Continue reading “Crude Oil Futures Chart & Futures/Commodities Levels 5.07.2014”
Futures Market Trading News & Economic Reports 5.06.2014

Connect with Us! Use Our Futures Trading Levels and Economic Reports RSS Feed.

Like us on FacebookFollow us on TwitterView our profile on LinkedInFind us on Google+Cannon Trading Futures Trading Resistance & Support Levels and Economic ReportsFind us on Yelp

1. Market Commentary
2. Futures Support and Resistance Levels – S&P, Nasdaq, Dow Jones, Russell 2000, Dollar Index
3. Commodities Support and Resistance Levels – Gold, Euro, Crude Oil, T-Bonds
4. Commodities Support and Resistance Levels – Corn, Wheat, Beans, Silver
5. Futures Economic Reports for Tuesday May 6, 2014

Hello Traders,

For 2014 I would like to wish all of you discipline and patience in your trading!


TradeTheNews.com Weekly Market Update: No Mayday for Steady Markets

Fri, 02 May 2014 16:28 PM EST- After a rough start for stocks in April, the DJIA and S&P500 erased 3% declines to end the month higher by about 0.5% a piece, at or near record highs. The moves for the Nasdaq were even more extreme, as investors backed out of a wide spectrum of high-flying technology and biotech stocks. This week volatility in US and European markets dried up and equities saw steady if modest gains. Excellent UK GDP data, good German jobs numbers, incremental gains in Eurozone inflation and the monster US April jobs report supported the positive tone, while the weak US GDP reading was overlooked. The FOMC policy meeting was the least impactful in some time, with no notable changes except Kocherlakota withdrawing his dissent (as expected). Nearly two-thirds of S&P500 companies have now reported quarterly earnings, and with a few exceptions most of corporate America is meeting or beating profit expectations, even if revenue growth has been clearly anemic. In Ukraine, Kiev’s offensive to reestablish control over its eastern provinces has more or less fallen flat and belligerent Russian rhetoric has only increased. On Monday, the US placed additional sanctions on a handful of Russian officials, none of whom were the chief actors in the Ukraine drama. For the week, the DJIA and the S&P500 each rose 0.9%, and the Nasdaq gained 1.2%.- Most analysts are shrugging off the +0.1% advance Q1 GDP reading, citing the well-worn excuse of unusually severe winter weather. The focus has been on the consumption component of the first reading of Q1 GDP, which was +3.0%, roundly beating expectations, bolstered by a 4.4% jump in spending on services. The latter was due to the expansion of healthcare spending under Obamacare. Note that domestic investment (both residential and nonresidential), trade and government spending subtracted much more from growth than anticipated.- The April jobs report greatly exceeded expectations with the 288K non-farm payrolls gain the strongest since January 2012. Gains were broad-based across sectors, including construction. Most importantly, nothing in the data suggests the increase in the payroll series was a statistical fluke. The same cannot be said for the unexpectedly steep decline in the unemployment rate to 6.3%. The three-tenths drop in joblessness did not reflect an increase in employment – as measured by the household survey employment actually fell by 73K – but rather the 806K workers reporting themselves as being out of the labor market, pushing the labor force participation rate down 0.4 points to 62.8%. Analysts highlight that this is a very noisy measure and will certainly be revised.

– Data out this week suggested that, like much else in the US economy, the housing industry will also bounce back from its winter weather slump. The pending home sales data saw its first positive m/m reading in nine months in March, widely beating expectations. Data out last week showed that existing home sales fell to their lowest levels in nearly two years in March, but the pending homes report suggests the downward trend may have run its course. While there is hope for further improvement in the housing market, it looks like there is little chance for housing reform in Washington, DC this year. The Senate Banking Committee scheduled an April 29th markup session for the GSE reform bill, but with committee work starting so late in the session there is little chance for much to get done before Congress shifts into full-on election mode.

– Federal prosecutors are planning criminal charges against BNP Paribas and Credit Suisse Group for separate alleged offenses, raising fears that one or both could possibly be forced out of the US market. The DoJ is seeking criminal charges against BNP for allegedly skirting economic sanctions against Iran, and charges against Credit Suisse for helping clients avoid taxes. Reportedly BNP faces charges of up to $2 billion, and while there are said to be discussions of ways to avoid revocation of the bank’s New York charter in case of a guilty verdict, the Fed still might move to take away its licenses. Elsewhere in the annals of financial misbehavior, Bank of America disclosed an embarrassing error in calculating its capital ratios, forcing it to suspend capital returns to shareholders and redo its CCAR submissions to the Fed.

– Rising crude and natural gas prices were the trend in the first quarter, although not all of the global oil majors benefitted equally from the improved pricing environment. ConocoPhillips and Exxon reported much better-than-expected first quarter results, although Exxon’s lower upstream production pulled profits down on a y/y basis while Conoco’s higher production boosted its profits. Both beat consensus EPS estimates. Meanwhile, Chevron missed both top- and bottom-line expectations as production fell 2% y/y and weaker refining margins hurt bottom-line results. BP’s profits slumped and revenue was down significantly as the company continues to shed assets. BP’s profit from its Rosneft joint venture shrank by 75% in the quarter thanks to the Ukraine crisis weakening the ruble.

– April auto sales were mixed. General Motor’s sales gained 6.9%, more than expected, Chrysler slightly topped expectations and Ford missed. A GM sales executive said retail demand was steady in the month as the economy continues to strengthen. Toyota and Nissan’s sales were very strong, up 13.3% y/y and 18.3% y/y, respectively. Ford was the only major auto firm to report a decline in monthly sales, however truck sales remained very strong, with overall April sales +8%, twice the March gain. In addition, Ford announced that CEO Alan Mulally would step down as chief on July 1st. Over his eight-year term, Mulally transformed Ford from a money-loser to a thriving firm. He will be replaced by Mark Fields, the current chief operating officer.

– Pharmaceutical industry deal making continued after last week’s big announcements. There were repeated reports that Allergan would make a second attempt to acquire Shire to fend off Valeant’s $46-billion unsolicited bid, or even try to sell the company to Johnson & Johnson or Sanofi. AstraZeneca disclosed this week that back in January, Pfizer had offered £46.61/share to acquire the firm was rebuffed, and that Pfizer had renewed its approach. On Friday, Pfizer hiked its offer for AstraZeneca to approximately £50.00/share, valuing the firm at more than $106B. Forest Laboratories said it would buy Furiex Pharmaceuticals for $1.5 billion to get access to its gastrointestinal disease treatments. In other deal news, the contest to acquire Alstom’s energy units is now between Siemens and General Electric, with bids said to be running around €11-12 billion.

– The eagerly awaited Eurozone April annualized CPI was slightly lower than expected, at +0.7% versus +0.8%e, while core was in-line at +1.0%. Recall that the March figure that really lit the fire under QE talk was a mere +0.5%, so the slight increase lent some credibility to ECB assertions that the Eurozone will avoid deflation. In a meeting with German legislators, President Draghi said there was still no chance of deflation in the Eurozone and that launching a QE program was only a distant possibility. EUR/USD traded in only a slightly broader range than last week, between 1.3800 and 1.3890.

– UK GDP saw its fifth consecutive quarter of growth in Q1, with the advance annualized figure at +3.1%, up from +2.7% in the final quarter of 2013. This was the highest annualized rate of growth seen in six years, and BoE Governor Carney said the data shows the UK is entering a sustainable recovery. GBP/USD hit a fresh 4-year highs above 1.6900 toward week’s end.

– The Bank of Japan held pat in its policy statement out this week and cut its GDP forecast for the FY14/FY15 period to +1.1% from +1.4% prior, and maintained its inflation outlook for the period. This marked one year since the bank launched its ambitious program to double the monetary base and achieve 2% inflation within two years. The March labor cash earnings report – a closely watched gauge of consumer “cost-push” inflation from salaries – moved to a two-year high of +0.7%, giving government officials a reason to celebrate Abenomics. However, the April Markit manufacturing PMI saw its first contraction in over a year, with both output and new export orders components in contraction as well. USD/JPY spent most of the week locked in the 102 handle, only briefly surging above 103 in the immediate aftermath of the US jobs report on Friday.


If you like the information we share? We would appreciate your positive reviews on our new yelp!!

GOOD TRADING

Trading Futures, Options on Futures, and retail off-exchange foreign currency transactions involves substantial risk of loss and is not suitable for all investors. You should carefully consider whether trading is suitable for you in light of your circumstances, knowledge, and financial resources. You may lose all or more of your initial investment. Opinions, market data, and recommendations are subject to change at any time.

If you like Our Futures Trading Daily Support and Resistance Levels, Please share!

Futures Trading Levels

Contract June 2014  SP500 (big & Mini) Nasdaq100 (big & Mini) Dow Jones (big & Mini) Mini Russell Dollar Index
Resistance 3 1904.50 3663.33 16700 1147.80 79.68
Resistance 2 1892.25 3630.67 16591 1137.60 79.63
Resistance 1 1885.00 3613.33 16524 1129.90 79.59
Pivot 1872.75 3580.67 16415 1119.70 79.54
Support 1 1865.50 3563.33 16348 1112.00 79.49
Support 2 1853.25 3530.67 16239 1101.80 79.44
Support 3 1846.00 3513.33 16172 1094.10 79.40
Contract June Gold July Silver June Crude Oil June Bonds  June Euro
Resistance 3 1333.9 2001.2 101.79 137  4/32 1.3906
Resistance 2 1324.8 1987.8 101.12 136 26/32 1.3896
Resistance 1 1317.8 1975.2 100.26 136  9/32 1.3885
Pivot 1308.7 1961.8 99.59 135 31/32 1.3875
Support 1 1301.7 1949.2 98.73 135 14/32 1.3864
Support 2 1292.6 1935.8 98.06 135  4/32 1.3854
Support 3 1285.6 1923.2 97.20 134 19/32 1.3843
Contract July Corn July Wheat July Beans July SoyMeal July bean Oil
Resistance 3 519.7 746.3 1480.17 488.80 41.41
Resistance 2 514.3 740.7 1476.08 486.50 41.36
Resistance 1 511.2 734.8 1469.67 482.60 41.26
Pivot 505.8 729.2 1465.58 480.30 41.21
Support 1 502.7 723.3 1459.2 476.4 41.1
Support 2 497.3 717.7 1455.08 474.10 41.06
Support 3 494.2 711.8 1448.67 470.20 40.96
5. Economic Reports

source:http://www.forexfactory.com/calendar.php

All times are Eastern time Zone (EST)

Date 4:06pm Currency Impact Detail Actual Forecast Previous Graph
TueMay 6  3:00am EUR Spanish Unemployment Change -49.1K -16.6K
3:15am EUR Spanish Services PMI 54.3 54.0
3:45am EUR Italian Services PMI 51.2 49.5
4:00am EUR Final Services PMI 53.1 53.1
5:00am EUR Retail Sales m/m -0.2% 0.4%
All Day EUR ECOFIN Meetings
8:30am USD Trade Balance -40.1B -42.3B
10:00am USD IBD/TIPP Economic Optimism 47.6 48.0
5:30pm USD FOMC Member Stein Speaks

This is not a solicitation of any order to buy or sell, but a current market view provided by Cannon Trading Inc. Any statement of facts here in contained are derived from sources believed to be reliable, but are not guaranteed as to accuracy, nor they purport to be complete. No responsibility is assumed with respect to any such statement or with respect to any expression of opinion herein contained. Readers are urged to exercise their own judgment in trading.

Monthly Unemployment #s tomorrow & Futures Economic Reports 5.02.2014

Connect with Us! Use Our Futures Trading Levels and Economic Reports RSS Feed.

Like us on FacebookFollow us on TwitterView our profile on LinkedInFind us on Google+Cannon Trading Futures Trading Resistance & Support Levels and Economic ReportsFind us on Yelp

1. Market Commentary
2. Futures Support and Resistance Levels – S&P, Nasdaq, Dow Jones, Russell 2000, Dollar Index
3. Commodities Support and Resistance Levels – Gold, Euro, Crude Oil, T-Bonds
4. Commodities Support and Resistance Levels – Corn, Wheat, Beans, Silver
5. Futures Economic Reports for Friday May 2, 2014

Hello Traders,

For 2014 I would like to wish all of you discipline and patience in your trading!


Monthly unemployment numbers tomorrow at 8:30 Am EST.

Definitely a market mover news release.


For most traders, I recommend staying out, letting the smoke clear before trying to trade – unless you feel like being a gambler or your strategy is built around big news events.


Some more experienced and more capitalized traders will sometime try to “play” big news events by placing sell orders quite a bit above the market and placing buy orders quite a bit below the market, looking for the market to get out of “norm” and then return to balance. For me personally too much risk and the moves can be too fast but then again each of us is different in terms of trading personality, trading capital, trading experience  and risk tolerance…..


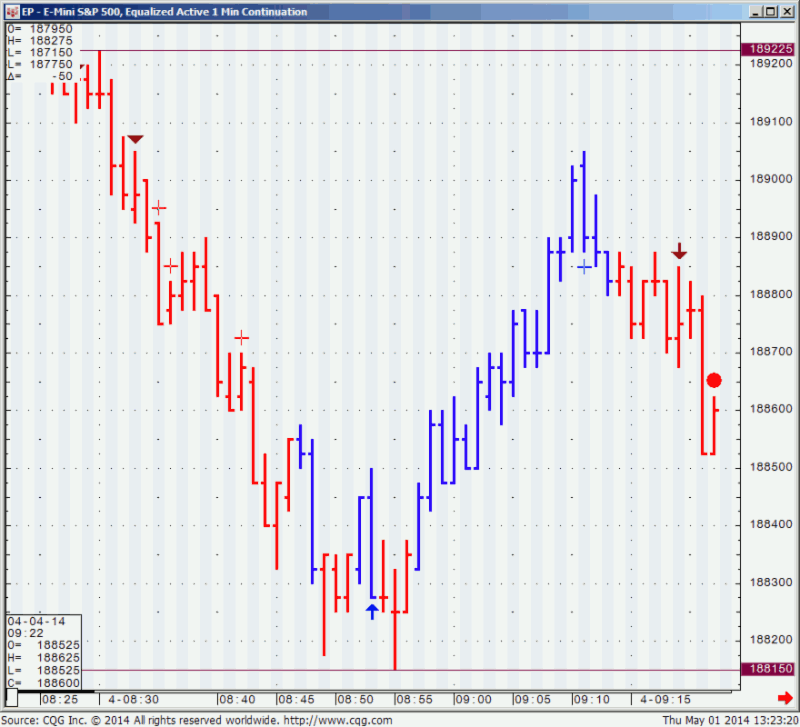
Below is a 1 minute chart of the mini SP from the last monthly unemployment numbers as a reference. Was not as volatile as previous reports but still 11 full points of swings in the first few minutes of trading.


808


If you like the information we share? We would appreciate your positive reviews on our new yelp!!

GOOD TRADING

Trading Futures, Options on Futures, and retail off-exchange foreign currency transactions involves substantial risk of loss and is not suitable for all investors. You should carefully consider whether trading is suitable for you in light of your circumstances, knowledge, and financial resources. You may lose all or more of your initial investment. Opinions, market data, and recommendations are subject to change at any time.

If you like Our Futures Trading Daily Support and Resistance Levels, Please share!

Futures Trading Levels

Contract June 2014  SP500 (big & Mini) Nasdaq100 (big & Mini) Dow Jones (big & Mini) Mini Russell Dollar Index
Resistance 3 1894.75 3639.67 16614 1157.17 79.76
Resistance 2 1888.75 3622.58 16575 1144.83 79.68
Resistance 1 1883.50 3604.67 16533 1134.37 79.63
Pivot 1877.50 3587.58 16494 1122.03 79.56
Support 1 1872.25 3569.67 16452 1111.57 79.51
Support 2 1866.25 3552.58 16413 1099.23 79.43
Support 3 1861.00 3534.67 16371 1088.77 79.38
Contract June Gold July Silver June Crude Oil June Bonds  June Euro
Resistance 3 1308.5 1987.0 101.10 137  7/32 1.3907
Resistance 2 1300.8 1956.0 100.50 136 18/32 1.3897
Resistance 1 1292.8 1930.5 99.95 136  2/32 1.3881
Pivot 1285.1 1899.5 99.35 135 13/32 1.3871
Support 1 1277.1 1874.0 98.80 134 29/32 1.3855
Support 2 1269.4 1843.0 98.20 134  8/32 1.3845
Support 3 1261.4 1817.5 97.65 133 24/32 1.3829
Contract July Corn July Wheat July Beans July SoyMeal July bean Oil
Resistance 3 522.9 718.0 1532.33 505.77 42.04
Resistance 2 519.3 715.8 1517.67 499.63 41.85
Resistance 1 513.2 711.5 1489.33 488.17 41.50
Pivot 509.6 709.3 1474.67 482.03 41.31
Support 1 503.4 705.0 1446.3 470.6 41.0
Support 2 499.8 702.8 1431.67 464.43 40.77
Support 3 493.7 698.5 1403.33 452.97 40.42
5. Economic Reports

source:http://www.forexfactory.com/calendar.php

All times are Eastern time Zone (EST)

Date 4:07pm Currency Impact Detail Actual Forecast Previous Graph
FriMay 2  3:15am EUR Spanish Manufacturing PMI 53.2 52.8
3:45am EUR Italian Manufacturing PMI 53.0 52.4
4:00am EUR Final Manufacturing PMI 53.3 53.3
5:00am EUR Unemployment Rate 11.9% 11.9%
8:30am USD Non-Farm Employment Change 216K 192K
USD Unemployment Rate 6.6% 6.7%
USD Average Hourly Earnings m/m 0.2% 0.0%
10:00am USD Factory Orders m/m 1.5% 1.6%

This is not a solicitation of any order to buy or sell, but a current market view provided by Cannon Trading Inc. Any statement of facts here in contained are derived from sources believed to be reliable, but are not guaranteed as to accuracy, nor they purport to be complete. No responsibility is assumed with respect to any such statement or with respect to any expression of opinion herein contained. Readers are urged to exercise their own judgment in trading.

FOMC Interest Rate Decision & Futures Economic Levels 5.01.2014

Connect with Us! Use Our Futures Trading Levels and Economic Reports RSS Feed.

Like us on FacebookFollow us on TwitterView our profile on LinkedInFind us on Google+Cannon Trading Futures Trading Resistance & Support Levels and Economic ReportsFind us on Yelp

1. Market Commentary
2. Futures Support and Resistance Levels – S&P, Nasdaq, Dow Jones, Russell 2000, Dollar Index
3. Commodities Support and Resistance Levels – Gold, Euro, Crude Oil, T-Bonds
4. Commodities Support and Resistance Levels – Corn, Wheat, Beans, Silver
5. Futures Economic Reports for Thursday May 1, 2014

Hello Traders,

For 2014 I would like to wish all of you discipline and patience in your trading!


The FOMC interest rate decision is behind us and so is April. This was one of the LESS volatile FOMC announcements. 

Hope everyone will enjoy a great trading month in May!

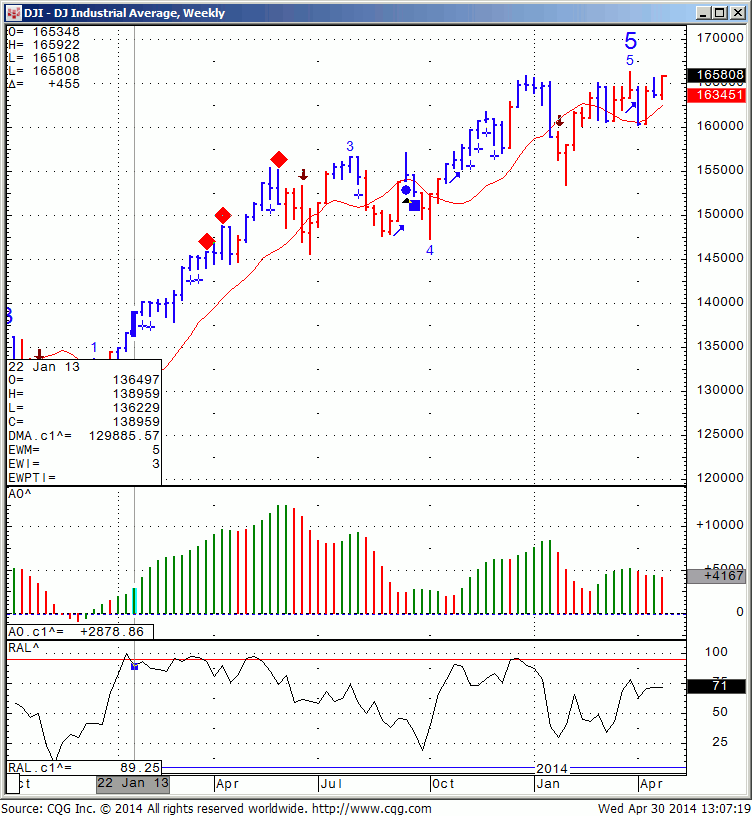
We still have monthly unemployment this Friday and just for visual, below is the weekly Dow Jones Cash chart, flirting with all time highs…….

807


If you like the information we share? We would appreciate your positive reviews on our new yelp!!

GOOD TRADING

Trading Futures, Options on Futures, and retail off-exchange foreign currency transactions involves substantial risk of loss and is not suitable for all investors. You should carefully consider whether trading is suitable for you in light of your circumstances, knowledge, and financial resources. You may lose all or more of your initial investment. Opinions, market data, and recommendations are subject to change at any time.

If you like Our Futures Trading Daily Support and Resistance Levels, Please share!

Futures Trading Levels

Contract June 2014  SP500 (big & Mini) Nasdaq100 (big & Mini) Dow Jones (big & Mini) Mini Russell Dollar Index
Resistance 3 1896.50 3627.08 16642 1151.87 80.40
Resistance 2 1888.00 3602.42 16584 1138.13 80.21
Resistance 1 1883.25 3588.33 16549 1131.07 79.89
Pivot 1874.75 3563.67 16491 1117.33 79.70
Support 1 1870.00 3549.58 16456 1110.27 79.38
Support 2 1861.50 3524.92 16398 1096.53 79.19
Support 3 1856.75 3510.83 16363 1089.47 78.87
Contract June Gold July Silver June Crude Oil June Bonds  June Euro
Resistance 3 1310.9 1990.7 102.06 136  6/32 1.4019
Resistance 2 1304.6 1970.8 101.41 135 18/32 1.3948
Resistance 1 1297.4 1945.7 100.65 135  7/32 1.3910
Pivot 1291.1 1925.8 100.00 134 19/32 1.3839
Support 1 1283.9 1900.7 99.24 134  8/32 1.3801
Support 2 1277.6 1880.8 98.59 133 20/32 1.3730
Support 3 1270.4 1855.7 97.83 133  9/32 1.3692
Contract July Corn July Wheat July Beans July SoyMeal July bean Oil
Resistance 3 525.1 730.3 1528.17 500.70 42.87
Resistance 2 522.2 726.5 1520.58 497.50 42.62
Resistance 1 520.6 724.0 1516.67 495.60 42.36
Pivot 517.7 720.3 1509.08 492.40 42.11
Support 1 516.1 717.8 1505.2 490.5 41.9
Support 2 513.2 714.0 1497.58 487.30 41.60
Support 3 511.6 711.5 1493.67 485.40 41.34
5. Economic Reports

source:http://www.forexfactory.com/calendar.php

All times are Eastern time Zone (EST)

Date 4:04pm Currency Impact Detail Actual Forecast Previous Graph
ThuMay 1 All Day EUR French Bank Holiday
All Day EUR German Bank Holiday
All Day EUR Italian Bank Holiday
 7:30am USD Challenger Job Cuts y/y -30.2%
8:30am USD Fed Chair Yellen Speaks
USD Unemployment Claims 317K 329K
USD Core PCE Price Index m/m 0.1% 0.1%
USD Personal Spending m/m 0.7% 0.3%
USD Personal Income m/m 0.4% 0.3%
9:00am USD Final Manufacturing PMI 55.8 55.4
10:00am USD ISM Manufacturing PMI 54.3 53.7
USD Construction Spending m/m 0.5% 0.1%
USD ISM Manufacturing Prices 59.4 59.0
10:30am USD Natural Gas Storage 75B 49B
All Day USD Total Vehicle Sales 16.2M 16.4M

This is not a solicitation of any order to buy or sell, but a current market view provided by Cannon Trading Inc. Any statement of facts here in contained are derived from sources believed to be reliable, but are not guaranteed as to accuracy, nor they purport to be complete. No responsibility is assumed with respect to any such statement or with respect to any expression of opinion herein contained. Readers are urged to exercise their own judgment in trading.

FOMC News and Futures Economic Numbers & Reports 4.30.2014

Connect with Us! Use Our Futures Trading Levels and Economic Reports RSS Feed.

Like us on FacebookFollow us on TwitterView our profile on LinkedInFind us on Google+Cannon Trading Futures Trading Resistance & Support Levels and Economic ReportsFind us on Yelp

1. Market Commentary
2. Futures Support and Resistance Levels – S&P, Nasdaq, Dow Jones, Russell 2000, Dollar Index
3. Commodities Support and Resistance Levels – Gold, Euro, Crude Oil, T-Bonds
4. Commodities Support and Resistance Levels – Corn, Wheat, Beans, Silver
5. Futures Economic Reports for Wednesday April 30, 2014

Hello Traders,

For 2014 I would like to wish all of you discipline and patience in your trading!

The FOMC interest rate decision is due at 14:00 ET in the US tomorrow ( Wednesday,  April  30th).

This FOMC will follow more than a few important reports that will be released earlier in the morning, so I expect a volatile session. 

FOMC days have different characteristics than other trading days. If you have traded for a while, check your trading notes from past FOMC days that may help you prepare for tomorrow.

If you are a newcomer, take a more conservative approach and make sure you understand that the news can really move the market.

The following are suggestions on trading during FOMC days:

  • Reduce trading size
  • Be extra picky = no trade is better than a bad trade
  • Choose entry points wisely. Look at longer time frame support and resistance for entry. Take the approach of entering at points where you normally would have placed protective stops. Example, trader x looking to go long the mini SP at 1875.00 with a stop at 1869.00, instead “stretch the price bands” due to volatility and place an entry order to buy at 1869.75 and place a stop a few points below in this hypothetical example.
  • Expect the higher volatility during and right after the announcement
  • Expect to see some “vacuum” ( low volume, big zigzags) right before the number.
  • Consider using automated stops and limits attached to your entry order as the market can move very fast at times.
  • Know what the market was expecting, learn what came out and observe market reaction for clues
  • This is another great example why a trading journal would be an asset, as you can go back and check your notes from previous FOMC days.
  • Be patient and be disciplined

Continue reading “FOMC News and Futures Economic Numbers & Reports 4.30.2014”

Futures Trading Advice for Beginners Infographics

Do you often find yourself overwhelmed by the game of numbers that dictates the nerves of the markets? Are you often perplexed by the amusing gains and losses that investors count their wealth by? Here is an interesting way to understand commodities and trading, for all those who are inquisitive about the art of investment. In case you think commodities can be your ticket to extra earnings, the infographic presents some hard facts that you ought to rote before you fall in the temptation of trading. That said, once you have the basics by your side and the facts by your fingers, trading in commodities can be another asset class to consider.

The infographic that Cannon presents, is a graphic insight into how investing in commodities through futures should be done. It also establishes certain general tips one can follow when trading futures. The infographic uses basic examples from day to day life to explain difficult concepts of trading, a matter that generally requires expert intervention or hours of discussion so as to understand thoroughly. The basic features of futures trading have also be highlighted in the simplest possible manner, through this infographic made by Cannon Trading.


Futures Trading Infographics
This Infographic created by:: Cannon Trading

Continue reading “Futures Trading Advice for Beginners Infographics”

Futures Market Volatility News 4.29.2014

Connect with Us! Use Our Futures Trading Levels and Economic Reports RSS Feed.

Like us on FacebookFollow us on TwitterView our profile on LinkedInFind us on Google+Cannon Trading Futures Trading Resistance & Support Levels and Economic ReportsFind us on Yelp

1. Market Commentary
2. Futures Support and Resistance Levels – S&P, Nasdaq, Dow Jones, Russell 2000, Dollar Index
3. Commodities Support and Resistance Levels – Gold, Euro, Crude Oil, T-Bonds
4. Commodities Support and Resistance Levels – Corn, Wheat, Beans, Silver
5. Futures Economic Reports for Tuesday April 29, 2014

Hello Traders,

For 2014 I would like to wish all of you discipline and patience in your trading!

TradeTheNews.com Weekly Market Update: Russia Menaces Ukraine, Squelches Earnings Enthusiasm

Fri, 25 Apr 2014 16:08 PM EST- US equity markets bounced erratically between earnings enthusiasm and Ukraine-induced fear this week in a low-volume, post-Easter holiday environment. Strong quarterly results from major tech names and Dow components helped push indices higher, with Apple and Facebook the particular standouts. In addition, several huge merger deals in the pharmaceutical space also helped risk appetite. But the steady deterioration in the Ukraine situation dragged things lower and the continuing rotation out of momentum names whipped around the Nasdaq all week. For the week, the DJIA is down 0.3%, the S&P500 is off 0.1% and the Nasdaq fell 0.5%.

– The Ukraine crisis deepened this week as Kiev pressed its “anti-terrorist” operations in Eastern Ukraine and Russia conducted “military exercises” along the border. At one point, Russian armor was said to have moved in force to within one kilometer of the border, inspiring real fears that the invasion was imminent. Russia President Putin called the use force against pro-Russian forces in Ukraine “a crime” that will have consequences, while Russia’s UN ambassador went as far as invoking a nation’s right to self-defense under the UN charter as a justification for potential direct intervention in Ukraine. Officials in Kiev warned that any Russian incursions would be met directly with military force, while the Western powers convened on Friday to discuss arranging possible sanctions on the broader Russian economy.

– New home sales in the US tumbled to eight-month low in March, dropping 14.5% y/y. However the January and February totals were revised up 3% and 2%, respectively. Affordability is likely becoming a big factor for the market: the median new home price rose to a record high of $290K, up 13% y/y.

– Front month WTI crude lost over 3% this week, dropping from nearly $104 to just above $100 on profit taking. Concerns about further builds in US crude oil inventories overshadowed tensions between Russia and Ukraine. Last Wednesday, the EIA weekly report showed that US crude inventories were only 3.4 million barrels below the peak reached in May 2013. This week’s EIA report pushed US crude oil inventories above the 2013 high to 397.7 million barrels, levels not seen in 80 years.

– Excellent earnings from Apple, Facebook and Netflix could not save the Nasdaq from Amazon and the continuing rotation out of hot tech stocks this week. Both Facebook and Apple beat earnings and revenue targets, while Apple crushed expectations for iPhone shipments and boosted capital returns to shareholders. Facebook saw solid gains in user metrics and an 82% y/y gain in advertising revenue. Netflix sustained decent metrics and met expectations. Apple sustained 8% gains on the week, while gains in FB and NFLX evaporated rapidly. Amazon dropped 5% on the week after operating income shrank y/y and the firm’s second quarter revenue guidance fell short of consensus expectations. Microsoft offered solidly in-line, vanilla results.

– Results from the big US automakers were hampered, like everything else, by bad weather, although there were some self-inflicted wounds as well. General Motors beat earnings forecasts, despite a big decline in profits due to its recent recalls. Ford’s first quarter profit was down from the same period last year and missed expectations. Caterpillar posted a quarterly profit that topped analysts estimates and raised its full-year outlook on a stronger-than-expected rebound in sales in the construction industry.

Continue reading “Futures Market Volatility News 4.29.2014”

Volatility in the S&P Futures Markets and Mini S&P Chart 4.25.2014

Connect with Us! Use Our Futures Trading Levels and Economic Reports RSS Feed.

Like us on FacebookFollow us on TwitterView our profile on LinkedInFind us on Google+Cannon Trading Futures Trading Resistance & Support Levels and Economic ReportsFind us on Yelp

1. Market Commentary
2. Futures Support and Resistance Levels – S&P, Nasdaq, Dow Jones, Russell 2000, Dollar Index
3. Commodities Support and Resistance Levels – Gold, Euro, Crude Oil, T-Bonds
4. Commodities Support and Resistance Levels – Corn, Wheat, Beans, Silver
5. Futures Economic Reports for Friday April 25, 2014

Hello Traders,

For 2014 I would like to wish all of you discipline and patience in your trading!

WOW! Volatility the first 90 minutes of cash open reminded me almost of the summer of 2008…..
Market gaped higher based on APPLE earnings yesterday but when cash opened took a nose dive based on news from Ukraine….

Times like that are dangerous for MOST traders. yes, some of the more experienced or perhaps well capitalized traders look for days like this but for many others the fast and powerful moves can be a little too much…..

My advice? Know who you are as trader, learn to trade with stops, learn to lower your exposure/ trading quantity when volatility picks up and most of all if at any time you feel VERY UNCOMFORTABLE…take a few minutes, step away from the machine, take some deep breaths and decide if and how to continue….

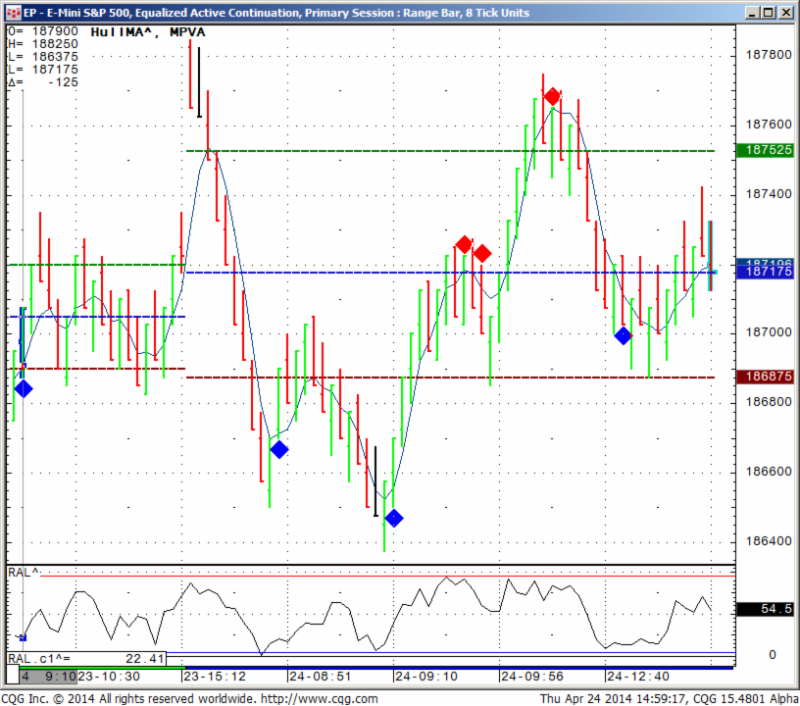
In between see below my mini SP 500 chart ( 8 ticks range chart) along with my proprietary indicators/ ALGO from today:

EP - E-mini S&P 500, Equalized Active Continuation, Primary Session: : Range Bar, 8 Tick Units
EP – E-mini S&P 500, Equalized Active Continuation, Primary Session: : Range Bar, 8 Tick Units

Would you like to have access to my DIAMOND and TOPAZ ALGOs as shown above and be able to apply for any market and any time frame on your own PC ?  You can now have a three weeks free trial where I enable the ALGO along with few studies for your own sierra/ ATcharts OR CQG Q Trader.

Continue reading “Volatility in the S&P Futures Markets and Mini S&P Chart 4.25.2014”

Futures Market Observations and Economic Reports 4.24.2014

Connect with Us! Use Our Futures Trading Levels and Economic Reports RSS Feed.

Like us on FacebookFollow us on TwitterView our profile on LinkedInFind us on Google+Cannon Trading Futures Trading Resistance & Support Levels and Economic ReportsFind us on Yelp

1. Market Commentary
2. Futures Support and Resistance Levels – S&P, Nasdaq, Dow Jones, Russell 2000, Dollar Index
3. Commodities Support and Resistance Levels – Gold, Euro, Crude Oil, T-Bonds
4. Commodities Support and Resistance Levels – Corn, Wheat, Beans, Silver
5. Futures Economic Reports for Thursday April 24, 2014

Hello Traders,

For 2014 I would like to wish all of you discipline and patience in your trading!

Getting Clues from other markets?

When day-trading a specific market do you only look at the chart for that specific market? maybe you took it a step further and you are viewing multiple time frame charts for the same market which is a good step in my eyes.

Now lets take this even one step further by observing what markets have correlation, direct or inverse to the market you are trading, perhaps this can help you make decisions when trading.

I will give a few examples from my experience:

When I am in a position in the mini SP 500, I will often observe what the bonds are doing ( many times inverse correlation), I will take notice of what the Dow, Russell and NASDAQ are doing as well ( direct correlation)

If I am trading crude oil, I will many times pay attention to what unleaded gas and heating oil are doing (very close, although not direct correlation) as well as what WTI crude is doing.

One more example may be when I have a position trade in beans and I will try to get a feel for the overall direction of the grain markets (is there a trend? are they sideways?) by looking at corn, wheat in general and then look to see what bean oil and soy meal which are by products of beans are doing.

One question that can be asked is “what do you mean observe this or that market”? and a good example will be:

Lets say I am short the mini SP 500 and I am not sure if to take profit or not. I look at the mini Russell and see that mini Russell just made new lows, that will give me more confidence to stay in my short position as I feel there might be more room to the downside.

Continue reading “Futures Market Observations and Economic Reports 4.24.2014”

Futures Mini Indices Volume and Mini S&P Chart 4.22.2014

Connect with Us! Use Our Futures Trading Levels and Economic Reports RSS Feed.

Like us on FacebookFollow us on TwitterView our profile on LinkedInFind us on Google+Cannon Trading Futures Trading Resistance & Support Levels and Economic ReportsFind us on Yelp

1. Market Commentary
2. Futures Support and Resistance Levels – S&P, Nasdaq, Dow Jones, Russell 2000, Dollar Index
3. Commodities Support and Resistance Levels – Gold, Euro, Crude Oil, T-Bonds
4. Commodities Support and Resistance Levels – Corn, Wheat, Beans, Silver
5. Futures Economic Reports for Tuesday April 22, 2014

Hello Traders,

For 2014 I would like to wish all of you discipline and patience in your trading!

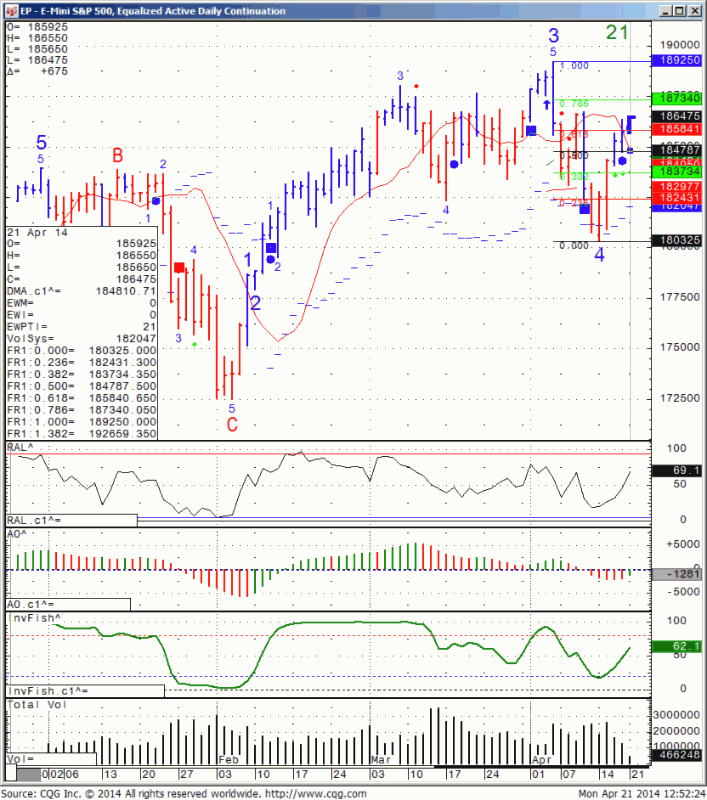
Extremely light volume in the markets today as Europe was still on a holiday. Volume in the mini SP contract was about 35% of the average normal daily volume as of lately. I suspect that both market participants and volatility should return tomorrow from the Easter holiday.

Daily chart of the mini SP for your review below:

805

Continue reading “Futures Mini Indices Volume and Mini S&P Chart 4.22.2014”