Monday Morning Support and Resistance Numbers

If you would like these numbers before the market opens, make sure you SIGN UP with your email above.

Here’s a morning cup o’ joe for all you futures traders, our morning support and resistance levels. Good trading!

divider black 190

Support and Resistance Levels – S&P 500, Nasdaq 100, Dow Jones, Mini Russell 2000, 30-Year US Bond, 10-Year US Note

Contract (September) Mini S&P 500 Mini Nasdaq 100 Dow Jones Mini Russell 2000 30-Year US Bond Sep ’12 10-Year US Note Sep ’12
Resistance Level 3 ——————————————Resistance Level 2

——————————————

Resistance Level 1

——————————————

Support Level 1

——————————————

Support Level 2

——————————————

Support Level 3

1411.751389


1385


1369


1360.75


1353.25

26952658


2650


2615.5


2598


2583

1328413144


13061


12911


12832


12761

807.60799.00


797.1


789.1


783.8


779.1

1512515110


15026


15002


14924


14911

13427.513421


13414.5


13405


13401.5


13326.5

Continue reading “Monday Morning Support and Resistance Numbers”

Friday Morning Support and Resistance Numbers

If you would like these numbers before the market opens, make sure you SIGN UP with your email above.

Here’s a morning cup o’ joe for all you futures traders, our morning support and resistance levels. Good trading!

divider black 190

Support and Resistance Levels – S&P 500, Nasdaq 100, Dow Jones, Mini Russell 2000, 30-Year US Bond, 10-Year US Note

Contract (September) Mini S&P 500 Mini Nasdaq 100 Dow Jones Mini Russell 2000 30-Year US Bond Sep ’12 10-Year US Note Sep ’12
Resistance Level 3 ——————————————Resistance Level 2 ——————————————

Resistance Level 1

——————————————

Support Level 1

——————————————

Support Level 2

——————————————

Support Level 3

13761372

1365


1353.75


1348


1343

2613.252604

2588


2565


2556


2541

1299212936

12895


12786


12729


12678

797.1789.90

782.6


774


771.2


768.4

1521715202

15125


15028


15004


14911

13503.513428

13423.5


13429.5


13424.5


13411.5

Continue reading “Friday Morning Support and Resistance Numbers”
Trading Levels and Reports for June 27, 2012

Jump to a section in this post:

1. Market Commentary
2. Support and Resistance Levels – S&P, Nasdaq, Dow Jones, Russell 2000, Dollar Index
3. Support and Resistance Levels – Gold, Euro, Crude Oil, T-Bonds
4. Support and Resistance Levels – Corn, Wheat, Beans, Silver
5. Economic Reports for Friday July 27, 2012


Hello Traders,

Comforting words out of Europe helped the stock market bounce nicely today.

Also the end of the month is approaching, which in recent months we saw some rallies during the last few days of the month.

With that being said, I still think the market has equal chances of going either way. You can see my daily chart below with possible upside targets (marked with -3-) and possible downside targets (marked with -4-).

ES mini S&P Daily Chart July 26 2012

Be patient, be disciplined!

Also please like us on Facebook!!

Trading Levels and Reports for July 26, 2012

Jump to a section in this post:

1. Market Commentary
2. Support and Resistance Levels – S&P, Nasdaq, Dow Jones, Russell 2000, Dollar Index
3. Support and Resistance Levels – Gold, Euro, Crude Oil, T-Bonds
4. Support and Resistance Levels – Corn, Wheat, Beans, Silver
5. Economic Reports for Thursday July 26, 2012


Hello Traders,

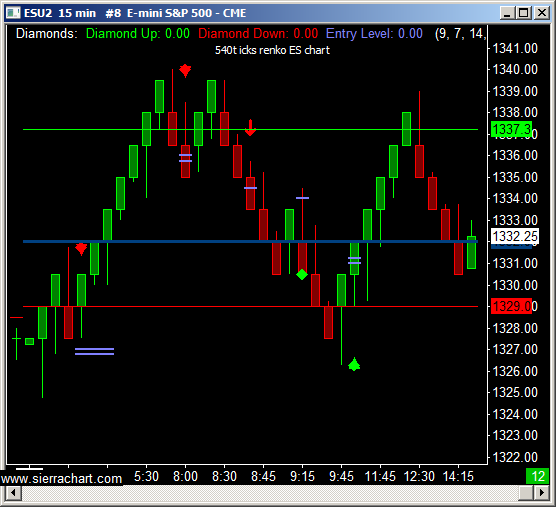
Here is a screen shot from my intraday set up from today’s session for the mini SP500.  Please inquire if you have questions.

Mini sp daily chart

Would you like to have access to my DIAMOND and TOPAZ ALGOs as shown above and be able to apply for any market and any time frame on your own PC ?   You can now have a two weeks free trial where I enable the ALGO along with few studies for your own sierra/ ATcharts.

To start your trial, please visit:https://www.cannontrading.com/tools/intraday-futures-trading-signals

OR

send me an email with the following information:

1. Are you currently trading futures?

2. Charting software you use?

3. If you use sierra or ATcharts, please let me know the user name so I can enable you

4. Markets you currently trading?

Also please like us on Facebook!!

Continue reading “Trading Levels and Reports for July 26, 2012”

Trading Levels and Reports for July 25, 2012

Jump to a section in this post:

1. Market Commentary
2. Support and Resistance Levels – S&P, Nasdaq, Dow Jones, Russell 2000, Dollar Index
3. Support and Resistance Levels – Gold, Euro, Crude Oil, T-Bonds
4. Support and Resistance Levels – Corn, Wheat, Beans, Silver
5. Economic Reports for Wednesday July 25, 2012


Hello Traders,

Are you currently evaluating a trading system?  Need help/ feedback in trying to assess validity of back testing and hypothetical results? Perhaps you need a second pair of eyes/ reason to review actual trading performance?

Feel free to contact us and one of our experienced brokers will be able to provide feedback and try to help you based on our experience in the trading world and dealing with variety of different trading systems in accordance to your risk tolerance and trading experience.

PS: like us on Facebook!!

Monday Morning Support and Resistance Numbers

If you would like these numbers before the market opens, make sure you SIGN UP with your email above.

Here’s a morning cup o’ joe for all you futures traders, our morning support and resistance levels. Good trading!

divider black 190

Support and Resistance Levels – S&P 500, Nasdaq 100, Dow Jones, Mini Russell 2000, 30-Year US Bond, 10-Year US Note

Contract (September) Mini S&P 500 Mini Nasdaq 100 Dow Jones Mini Russell 2000 30-Year US Bond Sep ’12 10-Year US Note Sep ’12
Resistance Level 3 ——————————————Resistance Level 2

——————————————

Resistance Level 1

——————————————

Support Level 1

——————————————

Support Level 2

——————————————

Support Level 3

1356.751352.25


1347.25


1339.25


1332.75


1330.5

26132603


2591


2570


2562


2545

1374612701


12651


12572


12535


12460

790.20786.10


781.4


774.5


768.20


763.7

1532915316


15301 (all time high)

15212


15200


15122

13527.513516.5


13512 (all time high)

13504


13431.5


13424

Continue reading “Monday Morning Support and Resistance Numbers”

Friday Morning Support and Resistance Numbers

If you would like these numbers before the market opens, make sure you SIGN UP with your email above.

Here’s a morning cup o’ joe for all you futures traders, our morning support and resistance levels. Good trading!

divider black 190

Support and Resistance Levels – S&P 500, Nasdaq 100, Dow Jones, Mini Russell 2000, 30-Year US Bond, 10-Year US Note

Contract (September) Mini S&P 500 Mini Nasdaq 100 Dow Jones Mini Russell 2000 30-Year US Bond Sep ’12 10-Year US Note Sep ’12
Resistance Level 3 —————————————— Resistance Level 2 ——————————————

Resistance Level 1

——————————————

Support Level 1

——————————————

Support Level 2

——————————————

Support Level 3

13761370.5


1367.25


1361.5


1354.25


1347.75

26922658


2648


2622


2604


2587

1393612884


12852


12808


12740


12680

807.6801.40


797.50


791.2


787.30


774.8

1521015124


15118


15008


14919


14830

13500.5 (all time time)13429.5

13425.5


13423.5


13420


13414

Continue reading “Friday Morning Support and Resistance Numbers”

Trading Levels and Reports for 7-19-2012

Jump to a section in this post:

1. Market Commentary
2. Support and Resistance Levels – S&P, Nasdaq, Dow Jones, Russell 2000, Dollar Index
3. Support and Resistance Levels – Gold, Euro, Crude Oil, T-Bonds
4. Support and Resistance Levels – Corn, Wheat, Beans, Silver
5. Economic Reports for Thursday July 19, 2012


Hello Traders,

We have a day full of reports tomorrow and SP500 is sitting against resistance at 1275. I would treat this as a pivot point, i.e. if we break and close above it based on the hourly chart, then there is a chance for another leg up. On the flip side, failure to do so may open the door for a pull back. To be honest I do not have a strong feeling one way or the other. My advice when this happens is PATIENCE! Let the market develop and provide you with clues.
Once you know how you want to attack the market, devise a plan and then execute the plan that you made while you were calm and not under market pressure OR in simple words, plan your trade, trade your plan.

Trading Levels and Reports for July 18, 2012

Jump to a section in this post:

1. Market Commentary
2. Support and Resistance Levels – S&P, Nasdaq, Dow Jones, Russell 2000, Dollar Index
3. Support and Resistance Levels – Gold, Euro, Crude Oil, T-Bonds
4. Support and Resistance Levels – Corn, Wheat, Beans, Silver
5. Economic Reports for Wednesday July 18, 2012

Hello Traders,

Somewhat of an intraday reversal we witnessed in the mini SP 500 today and market closed
ABOVE yesterday’s high which is a semi bullish signal
and puts the next target for the SP500 at 1375.


Another market that caught my eyes today is the Euro currency. I am getting a small buy signal as well for the Euro with possible targets at 123.96 and 125.34 and stop somewhere below the recent low of 121.71 ( 121.35?) in case I am wrong. If I am wrong and the market does take out the recent low, we may see another leg down before this market bounces.

Daily Euro Continuation Chart Continue reading “Trading Levels and Reports for July 18, 2012”