FOMC Provided Volatility, Economic Reports & Levels 9.18.2014

Hello Traders,

For 2014 I would like to wish all of you discipline and patience in your trading!

FOMC day provided the volatility expected. I speculate that we will see more volatility tomorrow as well.

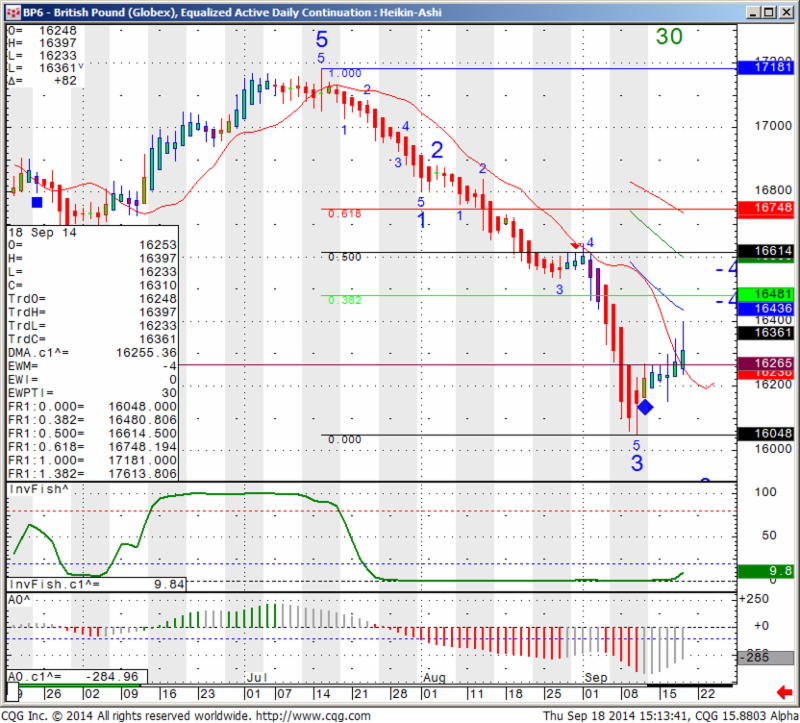
In addition we got the vote in Scotland that can affect the British Pound as well as some other currencies. My outlook for the pound is available here.

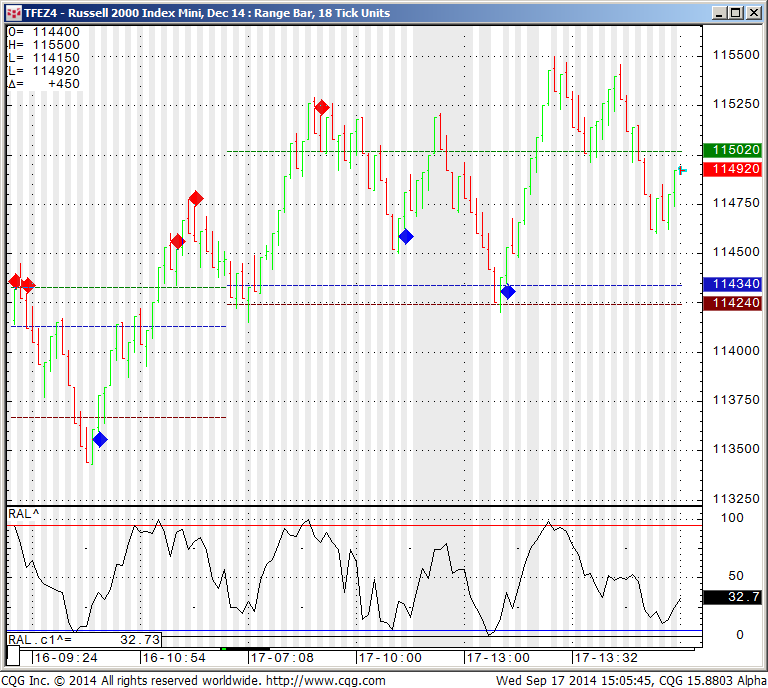
On a different note, I am sharing with you a screen shot of my mini Russell chart. 18 ticks range bar chart along with my DIAMOND ALGO, which works better when there is two sided action like we seen the last couple of days versus when we have a strong trending day.
The DIAMOND ALGO tries to predict turning points in the market.

TFEZ4 - Russell 2000 Index Mini, Dex. 14 : Range Bar, 18 Tick Units
TFEZ4 – Russell 2000 Index Mini, Dex. 14 : Range Bar, 18 Tick Units

Would you like to have access to my DIAMOND and TOPAZ ALGOs as shown above and be able to apply for any market and any time frame on your own PC ?  You can now have a three weeks free trial where I enable the ALGO along with few studies for your own sierra/ ATcharts OR CQG Q Trader.

To start your trial, please visit: http://levex.net/trading-algo/

Continue reading “FOMC Provided Volatility, Economic Reports & Levels 9.18.2014”

Mini S&P Futures outlook, Economic Reports & Levels 9.10.2014

Hello Traders,

For 2014 I would like to wish all of you discipline and patience in your trading!

These last few days I actually “sensed” something in the market that I have not in a long time…The intraday short positions actually had a chance to win.

What I mean is with QE and FED policy of the last few years, it turns out that anyone trying to fight the FED and go short was simply blind (myself included) so while I think in the long term this balloon can be very loud when it gets poked…..in the short term the plays have been to buy the dips.

I am hoping that we are seeing real clues that this is changing and that “normal market factors” will dictate price action but I am sure the change will not be overnight as traders been conditioned since 2009 to be “scared” of the short side (with the simple pain of watching your short positions lose… )


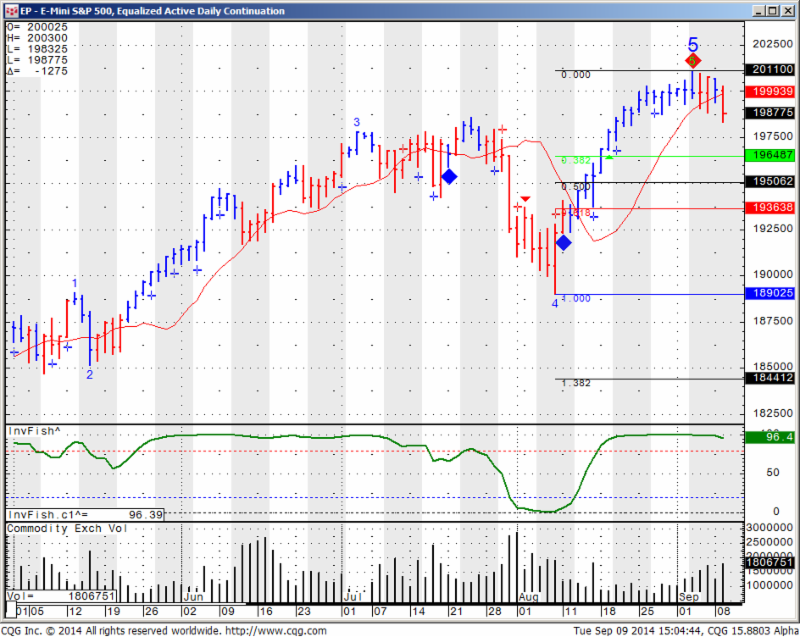
So once again I am sharing my indicators/ ALGO which gave the first sell signal on the SP500 in a few months ( see chart below). If there is enough follow through we should see 1965 BUT simply read above

829


Would you like to have access to my DIAMOND and TOPAZ ALGOs as shown above

and be able to apply for any market and any time frame on your own PC ?   You can now have a three weeks free trial where I enable the ALGO along with few studies for your own sierra/ ATcharts.


To start your trial, please visit:


http://levex.net/trading-algo/


HYPOTHETICAL PERFORMANCE RESULTS HAVE MANY INHERENT LIMITATIONS, SOME OF WHICH ARE DESCRIBED BELOW.  NO REPRESENTATION IS BEING MADE THAT ANY ACCOUNT WILL OR IS LIKELY TO ACHIEVE PROFITS OR LOSSES SIMILAR TO THOSE SHOWN.  IN FACT, THERE ARE FREQUENTLY SHARP DIFFERENCES BETWEEN HYPOTHETICAL PERFORMANCE RESULTS AND THE ACTUAL RESULTS SUBSEQUENTLY ACHIEVED BY ANY PARTICULAR TRADING PROGRAM.


ONE OF THE LIMITATIONS OF HYPOTHETICAL PERFORMANCE RESULTS IS THAT THEY ARE GENERALLY PREPARED WITH THE BENEFIT OF HINDSIGHT.  IN ADDITION, HYPOTHETICAL TRADING DOES NO INVOLVE FINANCIAL RISK, AND NO HYPOTHETICAL TRADING RECORD CAN COMPLETELY ACCOUNT FOR THE IMPACT OF FINANCIAL RISK IN ACTUAL TRADING.  FOR EXAMPLE, THE ABILITY TO WITHSTAND LOSSES OR TO ADHERE TO A PARTICULAR TRADING PROGRAM IN SPITE OF TRADING LOSSES ARE MATERIAL POINTS WHICH CAN ALSO ADVERSELY AFFECT ACTUAL TRADING RESULTS.  THERE ARE NUMEROUS OTHER FACTORS RELATED TO THE MARKETS IN GENERAL OR TO THE IMPLEMENTATION OF ANY SPECIFIC TRADING PROGRAM WHICH CANNOT BE FULLY ACCOUNTED FOR IN THE PREPARATION OF HYPOTHETICAL PERFORMANCE RESULTS AND ALL OF WHICH CAN ADVERSELY AFFECT ACTUAL TRADING RESULTS


Trading Futures, Options on Futures, and retail off-exchange foreign currency transactions involves substantial risk of loss and is not suitable for all investors.  You should carefully consider whether trading is suitable for you in light of your circumstances, knowledge, and financial resources. You may lose all or more of your initial investment. Opinions, market data, and recommendations are subject to change at any time.


Continue reading “Mini S&P Futures outlook, Economic Reports & Levels 9.10.2014”

Futures Levels and Economic Reports for 9.10.2014

Hello Traders,

For 2014 I would like to wish all of you discipline and patience in your trading!

As I often do on Mondays…quick recap and lok ahead for fundamentals affecting major markets from our friends at www.TradeTheNews.com


TradeTheNews.com Weekly Market Update: ECB Acts, Markets React

– With Europe slowly sinking into deflation and looming recession, the ECB took action this week, cutting rates and pledging to launch an asset-backed securities buying program. In the US, the August jobs report was weaker than expected, although analysts largely explained away the miss. The S&P500 has seemed reluctant to go much higher after topping 2000 for the first time last week. The conflict in Ukraine turned from warfare to diplomacy yet again as evidence of Russia’s hand in the fighting became more and more obvious and Western allies threatened additional economic sanctions. China PMI readings stabilized, which was enough to send the Shanghai Composite up nearly five percent, its biggest weekly gain in over a year. For the week, the DJIA rose 0.2%, the S&P500 gained 0.2% and the Nasdaq edged up less than 0.1%.

– On Thursday the ECB cut its refinancing rate to 0.05% from 0.15% and its deposit rate to -0.2% from -0.1%, and announced that it would launch an asset purchase program focused on private asset-backed securities. ECB President Draghi pronounced that that the ECB was now officially at the lower bound of interest rates and that no more rate cuts were possible. The decisions were not unanimous, however Draghi said a “comfortable majority” was in favor of the new measures. Observers pointed out that the European ABS market was relatively small and that the program might not be the sort of weapon that would do much to forestall deflation. The big bazooka of sovereign bond purchases remains on the shelf, with German opposition to its use still very strong; note that the Bundesbank’s Weidmann was the most vocal opponent to the rate cuts and ABS program announced this week.

– The August US jobs report disappointed markets on Friday with a sizable miss in the nonfarm payrolls (+142K v +230Ke). The NFP was the lowest reading in 2014 so far and broke a six-month stretch of 200K+ monthly gains, the longest run seen since the late 1990s. Commentators noted that the August data has the greatest chance of being revised higher due to seasonal factors, and many analysts suggest the final estimate will rise to the upper half of the 150-200K range. In addition, over the last 12 years or so, every NFP print over +300K has been followed by one near or under +100K, suggesting that the July/August data are following a well-established pattern.

– Coming into the week, the situation in Ukraine was going from bad to worse, with reports indicating more columns of Russian tanks and troops were entering the country to reinforce pro-Russian separatists in their offensive against government forces. On Wednesday Russia President Putin and Ukraine President Poroshenko restarted diplomacy that had broken off a week before, agreeing to discuss another ceasefire on Friday. It was not lost on anyone that Putin’s overture came as the planned NATO summit convened in Wales. Ahead of the confab, US President Obama reiterated the alliance’s defense commitments to its eastern members, and at the summit NATO finalized agreements for more aid to Ukraine and leaders said more sanctions on Russia are imminent. On Friday, Kiev and the separatists agreed to a temporary ceasefire and talks continue for a more enduring truce.

– Shares of BP dropped sharply on Thursday, pulling the FTSE lower with it, after a US judge ruled that the company was grossly negligent in the 2010 Macondo oil spill. Recall that BP has already agreed to pay $13.7 billion in fines for the Gulf of Mexico spill, but the “gross negligence” finding means BP could face quadruple damages and a maximum of $18 billion in additional fines. Transocean and Halliburton were found to be partly culpable but cleared of gross negligence in the case.

– August auto sales were mostly beat expectations, highlighted by Chrysler’s sales up 20% y/y. The overall industry continues to see sales volumes recover to levels last seen before the recession. A Ford sales executive said the industry is very strong at this stage in the US economic recovery, with August industry SAAR running around a mid-17M unit annualized rate, the best rate since 2006.

– Homebuilders Toll Brothers and Hovnanian both beat expectations in third quarter reports out this week, and both firms saw very good y/y gains in revenues and profits. Toll Brothers narrowed its FY14 guidance for expected deliveries and said ASPs would be higher than expected, sending the company’s shares lower. Hovnanian did not offer guidance, but its metrics for the quarter were pretty solid, with the backlog up by double digits.

– According to press reports, Alibaba plans to kick off its IPO roadshow in New York City starting on Monday, Sept 8th. On Friday, the IPO pricing range was set at $60-66/ADS implying a valuation around $150 billion (similar to the market cap of Amazon). Alibaba is expected to price the IPO on Sept 18th and begin trading its shares on the NYSE on Sept 19th.

– In M&A, two large deals were announced on Tuesday. Norwegian Cruise Line Holdings agreed to acquire Prestige Cruises International Inc. in a deal valued at about $3.03 billion. Prestige is owned by PE firm Apollo Global Management, which also has a 20% stake in Norwegian. Compuware reached a tentative deal to sell itself for $2.5 billion to PE fund Thomas Bravo. Compuware had been under pressure from activist investors to cut costs, lay off staff, and solicit buyout offers for more than a year.

– The ECB policy decision on Thursday slammed the euro, driving the biggest one-day decline in EUR/USD since October 2011, with the pair dropping to 1.2920 from 1.3150. EUR/USD spent all of Thursday and Friday below 1.30. EUR/CHF tested 1.2045, getting as close to the SNB floor as the pair has been since it was established in September 2011. The pound was softer as traders positioned nervously ahead of the Scottish independence referendum scheduled for September 18th. A YouGov poll out this week suggested that support for Scottish independence had risen eight points over the past month, dangerously close to the 50% threshold. Analysts pointed out that a significant GBP risk event could unfold as UK economic data has begun to soften across the board.

– USD/JPY hit 6-year highs late in the week after Japan PM Abe offered LDP deputy policy chief Yasuhisa Shiozaki the Health Minister cabinet post, sparking hopes of early GPIF pension reform. Shiozaki has been the LDP’s largest proponent of GPIF pension reform including diversification into more domestic equities and foreign securities and away from domestic bonds.

– The Bank of Japan maintained its assessment for the 13th consecutive meeting that “economy continued to recover moderately as a trend”, and despite some speculation of a more upbeat language, it largely stuck to the familiar script. The only change in the latest BOJ statement was a downgrade on the property market, noting the “decline in housing investment following front-loaded increase has continued.” Also of note out of Japan, wage inflation is finally accelerating more meaningfully, with the latest data out of Labor Statistics showing July cash earnings growing by 2.6% y/y – the largest increase since 1997. This should provide some welcome relief to Abenomics, just as the cabinet approval ratings for PM Abe also headed higher following this week’s cabinet reshuffle. Late on Friday, Japan’s Economy Minister Amari pledged more caution in the government’s expected December decision on whether to proceed with another round of sales tax hikes.

– China PMI figures showed the economy diverging in favor of the services sector, which would be in line with policy objectives in Beijing. Official non-manufacturing PMI rose for the first time in 3 months to 54.4 from 54.2, while HSBC services PMI hit a 17-month high of 54.1 following an alarming record low of 50.0 print in July. In contrast, the official manufacturing PMI slowed for the first time in 6 months to 51.1, and the final HSBC manufacturing PMI fell to a 3-month low. HSBC chief China economist was cautious on both measures, noting subdued domestic demand and considerable downside risks to growth in the second half of 2014 related to the property sector slowdown justifying expectations for more easing measures to support the recovery. The Shanghai Composite was bid higher by an impressive 4.9% this week – the biggest gain since early 2013 and the highest level for the index in 15 months.
Source:

http://www.tradethenews.com/?storyId=1598274


Trading Futures Spreads & Options, Reports & Levels 8.22.2014

Hello Traders,

For 2014 I would like to wish all of you discipline and patience in your trading!


Most of the time I write about day trading, psychology of day trading, techniques etc. but I must say that day-trading is only one way of trading futures.

Over the years I have been exposed and used the following techniques / methods in trading:
buying options
selling options
using options spreads
swing trading using futures
position trading using futures and options
break out trading
and of course day-trading….

All methods can lose money, make money and in between. Some carry higher degree of risk than others, some have better probability of success but losses can be significant….The bottom line is each trader is different and may find a method that he/she feels more comfortable with. I actually wrote an article for SFO magazine a few years back about this subject, called “trading for your blood type” ( email me for a copy if you like).

One method I like for trading futures that can be applied both for day-trading but usually more common for swing/longer term trading is futures spreads. My colleague here at Cannon, Mark O’Brien wrote a good article about it last year which you can access at:


Continue reading “Trading Futures Spreads & Options, Reports & Levels 8.22.2014”

Different Methods to enter in Futures Trades, Reports & Levels 8.20.2014

Hello Traders,

For 2014 I would like to wish all of you discipline and patience in your trading!


Few ways to enter a trade….


There are so many different aspects to trading.

From financial, emotional aspects to actual details of when to enter a trade, when to exit a trade and SO MUCH more in between…..

An important part of trading is trade entry. Assuming a trader knows why he/ she about to enter a trade the next step sounds simple right? simply buy or sell the contract you wish to trade….

Many times it is that simple, depending on the time frame you are trading you may simply buy @ market and get the market price at that time. Some traders try to make small profits where every tick counts hence they may use the “buy bid” or “sell ask” button in order to get in at the best market price at that time. Many times you may save a tick by doing so but other times you may find yourself chasing the bid or the ask…


Another way is for a trader to decide that yes she wants to enter the specific market but she would like to get in at a price that is better and will use a limit order. Example may be, trader got the signal she was looking for to sell the mini SP 500 futures. The September contract was at 1982.75. Trader decided that she is willing to take the risk of not getting into the trade but she will only sell if the market hits her limit price of 1983.75 for example. There are times that this patience will allow for a better entry price, hence better chances to meet target but there are times that trader will not get in and “miss a possible winning trade”

One more common way that some traders use is to enter on a stop. Most beginner traders will use stops for protection and not as much for trade entry. Traders with a bit more experience will at times use stops to enter a trade. Example may be that Joe decided to buy crude oil futures because he got his condition met ( crude in this hypothetical example is trading at 93.42), however Joe would like to see that price action follows the signal and break a minor level on the chart which he thinks serves as minor resistance at 93.49. In this case Joe will place a buy stop at 93.49 that if triggered will enter him into a long trade.


Again, there are so many more ins and outs to trading in general and to trade entry in specific and I hope this quick overview may opened your mind to different ways of entering a trade.


Continue reading “Different Methods to enter in Futures Trades, Reports & Levels 8.20.2014”

Crude Oil Futures Renko Charts & Economic Reports 7.23.2014

Connect with Us! Use Our Futures Trading Levels and Economic Reports RSS Feed.

Like us on FacebookFollow us on TwitterView our profile on LinkedInFind us on Google+Cannon Trading Futures Trading Resistance & Support Levels and Economic ReportsFind us on Yelp

1. Market Commentary
2. Futures Support and Resistance Levels – S&P, Nasdaq, Dow Jones, Russell 2000, Dollar Index
3. Commodities Support and Resistance Levels – Gold, Euro, Crude Oil, T-Bonds
4. Commodities Support and Resistance Levels – Corn, Wheat, Beans, Silver
5. Futures Economic Reports for Wednesday July 23, 2014

Hello Traders,

For 2014 I would like to wish all of you discipline and patience in your trading!

I mentioned in previous posts that I am getting to like range bar charts and Renko charts more and more when it comes for very short term trading.

The main reason why I like these type of charts along with volume charts when it comes to any time frame less than 10 minutes is because I think it helps filter out noise during slow times and help you get a quicker signal when there is time of heavier action in the market.

Example, let’s say you are using a 5 minute chart along with certain studies, to make a simple example, moving averages cross overs. Before you get a signal, the 5 minute bar has to finish so you can see the value of the moving averages and see if you got a cross over or not. There are times when the market is fast with heavy volume and you may miss 80% of the move because 5 minutes can be a long time for day traders…..On the other hand if you are using Renko/volume charts/Range bars and there is good volume, fast action, these bars will complete much faster to provide a much faster signal. On the same token, if the market is slow with low volume, you will sometimes get your moving averages cross over simply because time has passed….With volume / Renko charts you may be able to filter this out simply because the bars WONT complete unless there is enough volume/ price action. Obviously, these type of charts are by no means “holly grail” but I think one should observe and pay attention to the type of charts especially if you are a short term day trader.

Below is an example of crude oil 18 ticks range bar from today as well as a 5 minutes chart from today with the same studies/ conditions applied just to get a visual idea. If you like to try out the same charts I am sharing, feel free to contact Cannon Futures Trading and we will set you up for a free trial:

Crude Oil 5 minute chart 7-22-2014

Crude Oil 5 Minute Chart 7-22-2014

Continue reading “Crude Oil Futures Renko Charts & Economic Reports 7.23.2014”

Global Events & Economic Reports for 7.18.2014

Connect with Us! Use Our Futures Trading Levels and Economic Reports RSS Feed.

Like us on FacebookFollow us on TwitterView our profile on LinkedInFind us on Google+Cannon Trading Futures Trading Resistance & Support Levels and Economic ReportsFind us on Yelp

1. Market Commentary
2. Futures Support and Resistance Levels – S&P, Nasdaq, Dow Jones, Russell 2000, Dollar Index
3. Commodities Support and Resistance Levels – Gold, Euro, Crude Oil, T-Bonds
4. Commodities Support and Resistance Levels – Corn, Wheat, Beans, Silver
5. Futures Economic Reports for Friday July 18, 2014

Hello Traders,

For 2014 I would like to wish all of you discipline and patience in your trading!

Just as I wrote about summer trading, unfortunate events with Malaysian airlines plane crash as well as other Geo political events, sent the market down pretty hard along with two sided volatile action.

Personally this was not an easy trading day, as I did not adjust the stops to match increased volatility only to see the direction of trade come back the way I wanted it.

Trading is not easy mentally! I have seen myself and other traders get frustrated when that happens and start a chain of actions that was not in the game plan and can many times cause much bigger losses…. Revenge trading, doubling down are just a few of our “bad friends” who show up when you are not focused and disciplined….

This is when one should take a pause, small break from trading. Step out, stretch, get fresh air and collect one self composure before deciding if to continue trading and how.

I am glad to share that this actually helped me today stay within my game plan and minimize losses to what i consider “acceptable levels”…

Continue reading “Global Events & Economic Reports for 7.18.2014”

Futures Levels & Economic Reports for 7.17.2014

Connect with Us! Use Our Futures Trading Levels and Economic Reports RSS Feed.

Like us on FacebookFollow us on TwitterView our profile on LinkedInFind us on Google+Cannon Trading Futures Trading Resistance & Support Levels and Economic ReportsFind us on Yelp

1. Market Commentary
2. Futures Support and Resistance Levels – S&P, Nasdaq, Dow Jones, Russell 2000, Dollar Index
3. Commodities Support and Resistance Levels – Gold, Euro, Crude Oil, T-Bonds
4. Commodities Support and Resistance Levels – Corn, Wheat, Beans, Silver
5. Futures Economic Reports for Thursday July 17, 2014

Hello Traders,

For 2014 I would like to wish all of you discipline and patience in your trading!

 In the last few days we witnessed “summer trading” with low volume which encouraged me to share the following with you on the different types of trading days:

  • In my opinion there are 3 main types of trading days.

1. The most common day are two sided trading action with swings up and down – this type of trading day is most suitable for using support and resistance levels along with overbought/oversold indicators.

2. Strong trending days, mostly one directional – this type of trading day is the least common, many times will happen on Mondays and maybe 3-5 times a month at most – this type of trading day is most suitable for using ADX, MACD crossovers and pretty much looking for pullbacks to jump on the trend.

3. Slow and/or choppy trading days – this type of trading day is best suited for taking small profits from the market by looking at volume spikes, using stochastics as possible entry signals and usually wait for a pullback before jumping in.

  • A good question I’ve been asked is how can one asses what type of trading day we will have while the market is still trading….I have been doing some work in finding the answers and will be happy to hear feedback via email but here are some initial observations:
    1. Was the overnight session a wide, two sided trading range? If the answer is yes, good chances for similar trading day during the primary session (primary session is when the cash/stock market is open)
    2. Mondays have the highest chance for trending days
    3. The behavior of the first hour of trading can also suggests the type of action for the rest of the day.
    4. If the first 30 minutes of the trading day have good volume, better chances for type 1 or type 2 trading days.
    5. Low volume during the first 30 minutes can suggest a choppy (type 3 trading day)

Continue reading “Futures Levels & Economic Reports for 7.17.2014”

Earnings Season Started & Economic Reports 07.10.2014

Connect with Us! Use Our Futures Trading Levels and Economic Reports RSS Feed.

Like us on FacebookFollow us on TwitterView our profile on LinkedInFind us on Google+Cannon Trading Futures Trading Resistance & Support Levels and Economic ReportsFind us on Yelp

1. Market Commentary
2. Futures Support and Resistance Levels – S&P, Nasdaq, Dow Jones, Russell 2000, Dollar Index
3. Commodities Support and Resistance Levels – Gold, Euro, Crude Oil, T-Bonds
4. Commodities Support and Resistance Levels – Corn, Wheat, Beans, Silver
5. Futures Economic Reports for Thursday July 10, 2014

Hello Traders,

For 2014 I would like to wish all of you discipline and patience in your trading!


Earnings season has started. Make sure you are aware of when major market movers are reporting.

The calendar can be found at: http://www.morningstar.com/earnings/earnings-calendar.aspx

Today I want to refresh our blog readers with what I call “there is life after mini SP for day-traders….” One of my favorite markets for day-trading is the 30 year bonds.

Too many of our clients trade the mini SP 500 and that’s it. I think that if one has the capital/ time/ knowledge, one should be looking to trade more than one market for purposes of diversification.

Each market has a different personality and behavior is dependent on the time of day when it’s most active.. If you are finding that the ES ( mini SP) is not giving you enough risk/opportunities then start monitoring a couple of other markets and perhaps explore them in the demo / simulated mode.


There are more than a few markets that I think are suitable for day-trading. Below you will find some observations, tips along with what is unique about these markets, their personality and the most active trading hours.


Interest Rates, 10 year and 30 year.


In most platforms, the symbols are ZB for 30 year bonds and ZN for 10 year notes. The current front month is September which is U. So ZBU4 for example.

Product Symbol ZB
Contract Size The unit of trading shall be U.S. Treasury Bonds having a face value at maturity of one hundred thousand dollars ($100,000) or multiples thereof
Price Quotation Points ($1,000) and 1/32 of a point. For example, 134-16 represents 134 16/32. Par is on the basis of 100 points.
Product Symbol ZN


Underlying Unit One U.S. Treasury note having a face value at maturity of $100,000.
Deliverable Grades U.S. Treasury notes with a remaining term to maturity of at least six and a half years, but not more than 10 years, from the first day of the delivery month. The invoice price equals the futures settlement price times a conversion factor, plus accrued interest. The conversion factor is the price of the delivered note ($1 par value) to yield 6 percent.
Price Quote Points ($1,000) and halves of 1/32 of a point. For example, 126-16 represents 126 16/32 and 126-165 represents 126 16.5/32. Par is on the basis of 100 points.
Tick Size
(minimum fluctuation)
One-half of one thirty-second (1/32) of one point ($15.625, rounded up to the nearest cent per contract), except for intermonth spreads, where the minimum price fluctuation shall be one-quarter of one thirty-second of one point ($7.8125 per contract).
Contract Months The first five consecutive contracts in the March, June, September, and December quarterly cycle.

These contracts are often affected by many of the economic reports that come out at 8:30 Am Eastern and there is very active volume between the hours of 8 am EST and 3 PM EST

Volume on both contracts is very good. Ten years will often have 1 million contracts traded per day

(might be the second most active US futures market after the mini SP 500) and the bonds will avg. around 300,000 contracts.

These markets can experience very volatile movements during and right after different reports but then will often trade smooth or in an intraday trend the rest of the day.


If you like the information we share? We would appreciate your positive reviews on our new yelp!! Continue reading “Earnings Season Started & Economic Reports 07.10.2014”

Cannon Trading Releases New Futures Trading Platform, Shogun Trade Executor 7.09.2014

Cannon Trading Releases New Futures Trading Platform, Shogun Trade Executor™

Cannon Trading launches Shogun Trade Executor™, a futures platform that provides a cutting edge experience for futures traders and combines 25 years of experience into a simple trading platform. Set apart by its access to unfiltered data and statistical analysis, Shogun Trade Executor™ is the perfect program for traders who want to improve their game.

Beverly Hills, California (PRWEB) July 08, 2014

http://www.prweb.com/releases/cannon-trading/shogun-trade-executor/prweb11998947.htm

Cannon Trading Co, Inc., an Independent Introducing Brokerage firm, is releasing its latest futures trading software, Shogun Trade Executer,™ a trading platform tailored to provide the most cutting edge user experience for futures traders.

The new software allows traders to benefit from the company’s 25 years of experience and compiles a user-interface that is both intuitive and highly functional. What separates Shogun Trade Executor™ from the other platforms lies in a few different levels of trading mechanics.

“Besides single click orders, Shogun Trade Executor™ offers tools to help the trader regulate himself and observe his statistics. With an implemented daily loss limit, a trader can now stay disciplined and set daily loss limits to protect profits and/ or limit losses for any given day, directly from the platform,” says Mike Levy, President, Cannon Trading.

“At the end of the day, users can study themselves as traders and observe their own individual trading statistics. Shogun Trade Executor™ provides free charting with over 100 technical indicators, trading algorithms, and unfiltered historical data,” he adds.

These are just some of the features that separate Shogun Trade Executor™ from other platforms. For more information and to actually try it out, traders can start with no cost Demo version.

As the industry has changed, Cannon has always been mindful of the evolving environment and has always kept customer interests in mind. The brokers at Cannon Trading look forward to finding out whether the futures trading landscape is something that will work for customers.

Cannon Trading has consistently tried to be a place where the traders and brokers work together as a team to assist clients in any way possible.

The result is a unique and progressive infrastructure that enables them to meet the varied needs of our clients with tailored services and execution.

Cannon Trading Company has won a Customer Service Finalist of 2003 Readers Choice Award, and the brokers have been quoted in SFO, Futures Magazine and Bloomberg. The Company is a proud member of the NFA andCFTC since 1988.

Visit the website and take advantage of many of the offers and educational tools.

Good Trading

Contact Details:
Name: Cannon Trading Co, Inc.
Email-id: info(at)cannontrading(dot)com
Address: 9301 Wilshire Blvd. Suite 515 Beverly Hills, CA 90210
Phone Number: (800)-454-9572
Website: https://www.cannontrading.com

TRADING COMMODITY FUTURES AND OPTIONS INVOLVE SUBSTANTIAL RISK OF LOSS. THESE ARE RISKY MARKETS AND ONLY RISK CAPITAL SHOULD BE USED. PAST PERFORMANCES ARE NOT NECESSARILY INDICATIVE OF FUTURE RESULTS.