CPI, FOMC Minutes + Futures Trading Levels for 04.10.2024

Get Real Time updates and more by joining our Private Facebook Group!
Subscribe to our YouTube Channel


C40


CPI and FOMC minutes Tomorrow

CPI Tomorrow! The CPI will be critical to the inflation outlook for Fed policymakers.


Previous CPI reports have created velocity logic events in the stock indices at the CME.


Please read more details about velocity logic and price banding HERE.


The above reports will Bookend the FOMC minutes release @1pm CT on tomorrow.

My previous notes suggest to do the following if you are an index day trader:

Get out before the 730 AM CPI.

Wait for the smoke to clear.

Resume trading.

Look at market volume and behavior after 9:30 AM Central time to decide if and how to resume trading.

I usually stop trading and resume after 1 PM once FOMC minutes are out.
AGAIN…This is just my PERSONAL preferences…


stars

e35cb555 9ff3 4f00 9fe8 0655b28fbd90

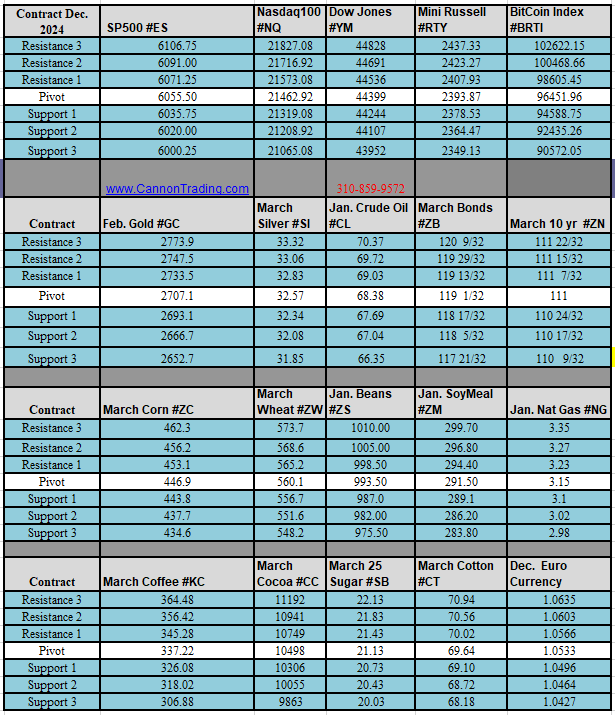
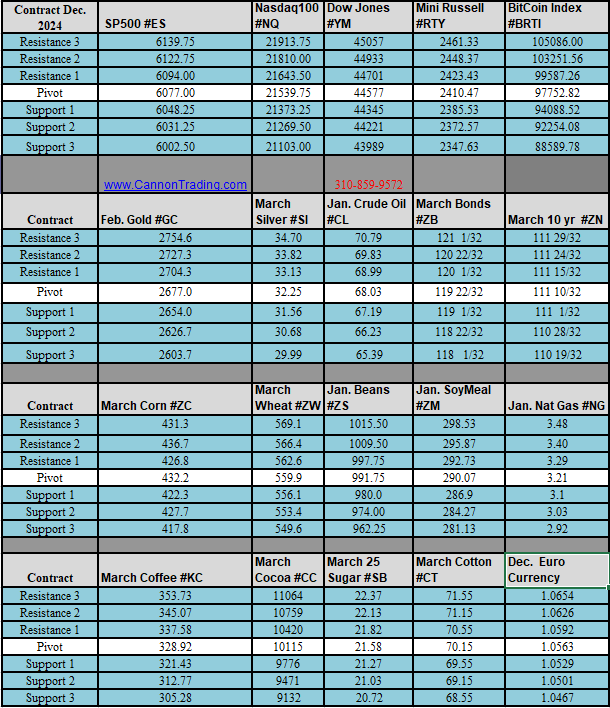
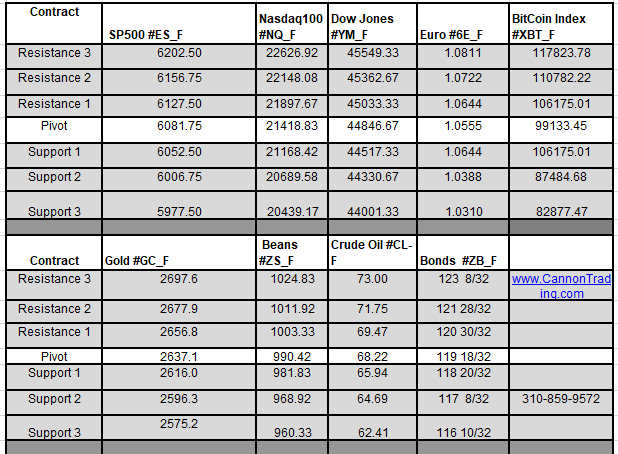
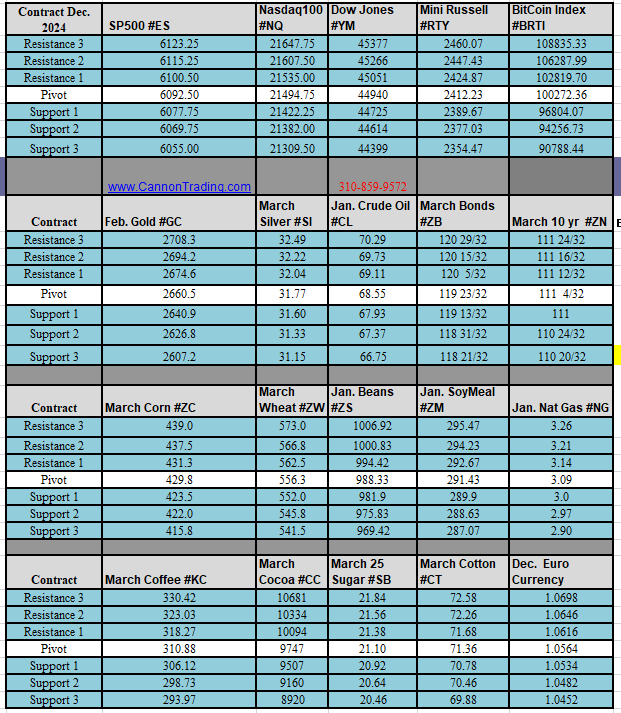
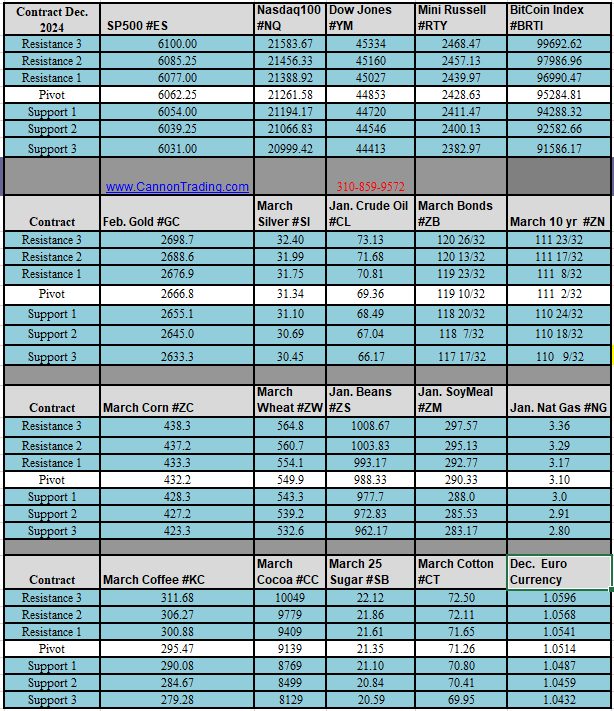
Daily Levels for April 10th, 2024

5383c6e5 a58d 4118 853a e01b43be5f04

thumbnail?url=http%3A%2F%2Fi.ytimg.com%2Fvi%2FJnHAMUGdNoM%2Fhqdefault

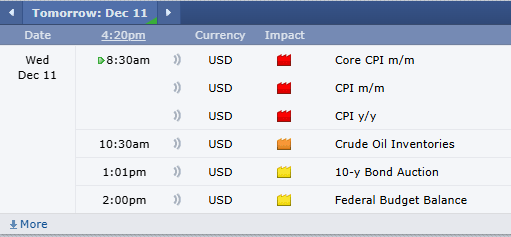
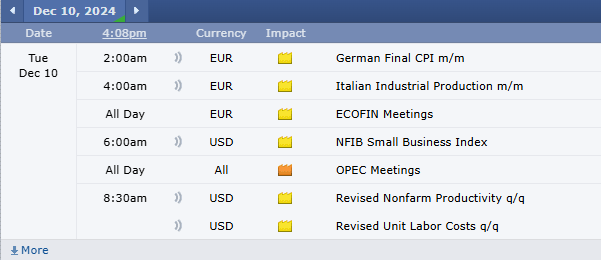
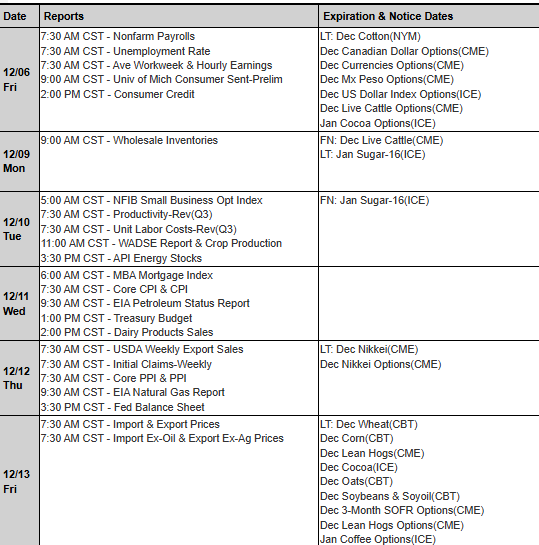
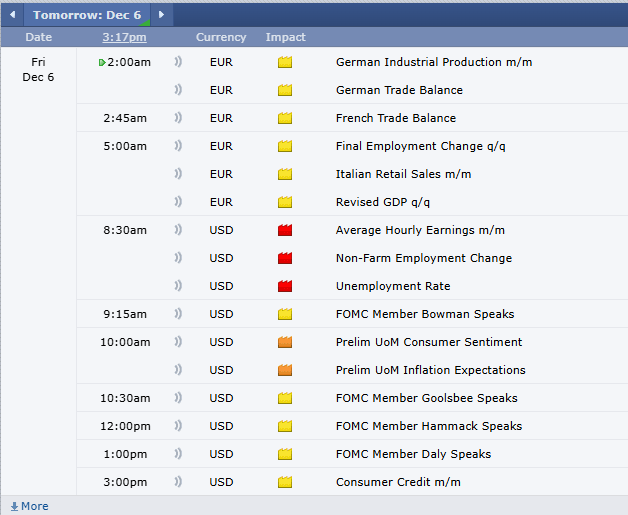
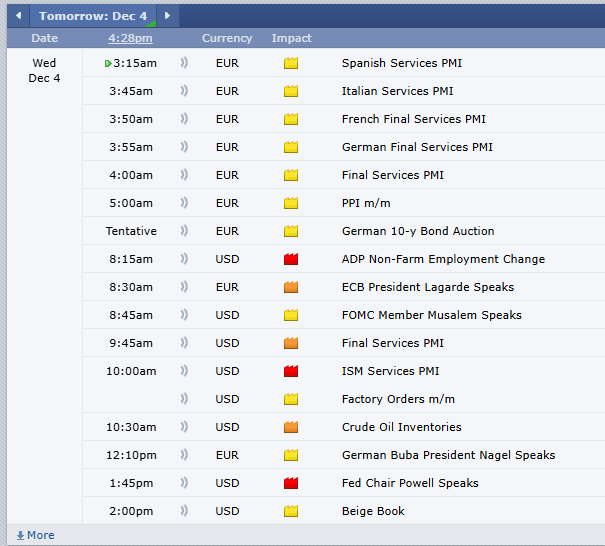
Economic Reports
provided by: ForexFactory.com
All times are Eastern Time ( New York)
66b77b8d 725c 4cbf a600 a2928cfab8d5

Improve Your Trading Skills
Get access to proprietary indicators and trading methods, consult with an experienced broker at 1-800-454-9572.

Explore trading methods. Register Here

3b644da2 2bee 4d39 8d98 5208a20bec39

* This is not a solicitation of any order to buy or sell, but a current market view provided by Cannon Trading Inc. Any statement of facts here in contained are derived from sources believed to be reliable, but are not guaranteed as to accuracy, nor they purport to be complete. No responsibility is assumed with respect to any such statement or with respect to any expression of opinion herein contained. Readers are urged to exercise their own judgement in trading.

Choppy Markets Today, (Tomorrow?) Ahead of CPI + Futures Trading Levels for 04.09.2024

Get Real Time updates and more by joining our Private Facebook Group!
Subscribe to our YouTube Channel


C39


Markets Heat up MidWeek

by John Thorpe, Senior Broker


CPI Report Wednesday

The CPI report for March 2024 will be released by the Bureau of Labor Statistics on Monday at 7:30 a.m. CDT. As of February’s CPI report, annual inflation is 3.2%, or 3.8% excluding food and energy. That data compares with the FOMC’s annual inflation target of 2%.

What To Expect

These data set move the Equity, Bond, Metals and currency markets the most as the market drivers are directly related to what the FED will do next with Interest rates this summer. Provided inflation comes at a monthly rate close to 0.3% or lower for March, that should be sufficient for the FOMC to keep its plan to start cutting interest rates this summer. If the report shows a 0.4% monthly increase or greater, that would be a concern. It would suggest relatively high inflation readings seen in January, and to a lesser extent in February, are perhaps more of a trend. Here is your BLS CPI Data center https://www.bls.gov/cpi/

Monthly inflation at or below 0.2% would generally be considered positive news, perhaps giving more conviction to rate cutting plans. Still the CPI release is just one data point that the Fed will use to assess how inflation is trending. The FOMC will also keep a close eye on the jobs market, which so far has been strong enough to enable the Fed to be patient in considering interest rate cuts. A slowdown in job growth might matter for the Fed’s plans as much as upcoming inflation data releases.


96e42ebd 7d12 4d66 9991 767f68bdc10a


stars

e35cb555 9ff3 4f00 9fe8 0655b28fbd90

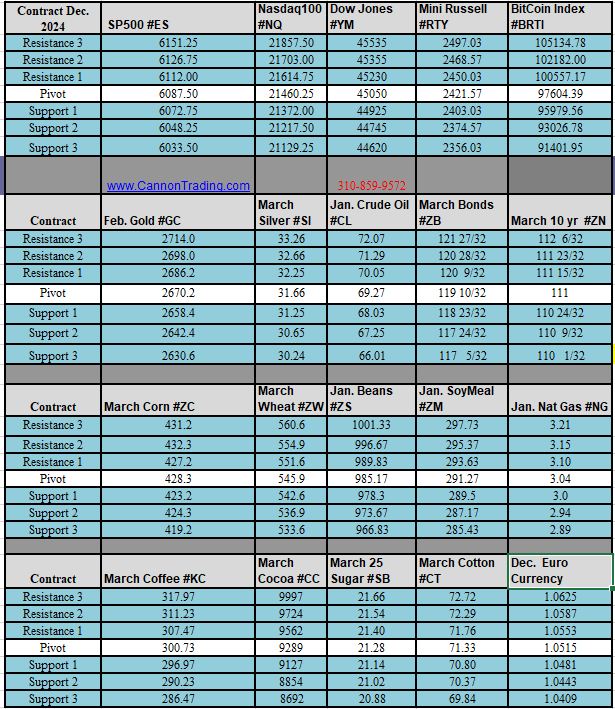
Daily Levels for April 9th, 2024

c247a741 517f 4a5e 9e22 58289021c011

thumbnail?url=http%3A%2F%2Fi.ytimg.com%2Fvi%2FJnHAMUGdNoM%2Fhqdefault

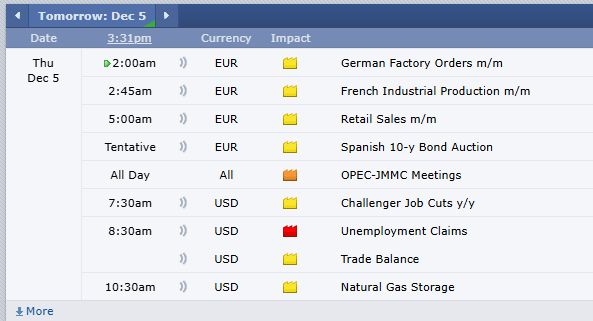
Economic Reports
provided by: ForexFactory.com
All times are Eastern Time ( New York)
d992cb25 b20f 4725 ad38 1fdde9ca456b

Improve Your Trading Skills

Get access to proprietary indicators and trading methods, consult with an experienced broker at 1-800-454-9572.

Explore trading methods. Register Here

3b644da2 2bee 4d39 8d98 5208a20bec39

* This is not a solicitation of any order to buy or sell, but a current market view provided by Cannon Trading Inc. Any statement of facts here in contained are derived from sources believed to be reliable, but are not guaranteed as to accuracy, nor they purport to be complete. No responsibility is assumed with respect to any such statement or with respect to any expression of opinion herein contained. Readers are urged to exercise their own judgement in trading.

Weekly Newsletter: Notional Value, May Copper Outlook & Trading Levels for April 8th

Get Real Time updates and more by joining our Private Facebook Group!
Subscribe to our YouTube Channel

C38

Cannon Futures Weekly Letter Issue # 1188

In this issue:
  •  Important Notices – Earnings Season Starts April 12th
  • Trading Resource of the Week – About Contract Notional Value
  • Hot Market of the Week – May Copper
  • Broker’s Trading System of the Week – RBOB Swing System
  • Trading Levels for Next Week
  • Trading Reports for Next Week


Important Notices –

  • Market Moving Data Wed. /Thur.  CPI and PPI respectively , w/Jobless Claims Thur. as well
  • 1 Fed discussion RE: new BASEL lll requirements Wed. AM (raises min. Cap Req from 2% to 4.5% for all banks)
  • AG WASDE Thur.
  • Q1 Earnings Season Begins Fri. the 12th Bank Earnings, JPM, C, WFC, BLK all report on this day.


Trading Resource of the Week : About Contract Notional Value by CMEgroup.com

Contract Unit
The contract unit is a standardized size unique to each futures contract and can be based on volume, weight, or a financial measurement, depending on the contract and the underlying product or market.
For example, a single COMEX Gold contract unit (GC) is 100 troy ounces, which is measured by weight.
A NYMEX WTI Crude Oil contract unit (CL) is 1,000 barrels of oil, measured by volume.
The E-mini S&P 500 contract unit (ES) is a financial calculation based on a fixed multiplier times the S&P 500 Index.
Contract Notional Value
Contract notional value, also known as contract value, is the financial expression of the contract unit and the current futures contract price.
Determining Notional Value
Assume a Gold futures contract is trading at price of $1,000. The notional value of the contract is calculated by multiplying the contract unit by the futures price.
Contract unit x contract price = notional value
100 (troy ounces) x $1,000 = $100,000
If WTI Crude Oil is trading at $50 dollars and the contract unit is 1000 barrels, the notional would be;
$50 x 1,000 = $50,000
Now assume E-mini S&P 500 futures are trading at 2120.00. The multiplier for this contract is $50.
$50 x 2120.00 = $106,000


stars

3b644da2 2bee 4d39 8d98 5208a20bec39


  • Hot Market of the Week – May Copper
Hot market of the week is provided by QT Market Center, A Swiss army knife charting package that’s not just for Hedgers, Cooperatives and Farmers alike but also for Spread traders, Swing traders and shorter time frame application for intraday traders with a unique proprietary indicator that can be applied to your specific trading needs.
May Copper
May copper is completing its third upside PriceCount objective that is consistent with a challenge of the contract high. It would be normal to get a reaction in the form of a near term consolidation or corrective trade, at least, from this level. From here, IF the chart can sustain further gains, we are left with the low percentage fourth upside count to the 4.94 area to aim for (not shown here for presentation purposes).
PriceCounts – Not about where we’ve been , but where we might be going next!
26a5ed14 ac68 4e3d 87d7 32b6f353a42b
The PriceCount study is a tool that can help to project the distance of a move in price. The counts are not intended to be an ‘exact’ science but rather offer a target area for the four objectives which are based off the first leg of a move with each subsequent count having a smaller percentage of being achieved. It is normal for the chart to react by correcting or consolidating at an objective and then either resuming its move or reversing trend. Best utilized in conjunction with other technical tools, PriceCounts offer one more way to analyze charts and help to manage your positions and risk. Learn more at www.qtchartoftheday.com
Trading in futures, options, securities, derivatives or OTC products entails significant risks which must be understood prior to trading and may not be appropriate for all investors. Past performance of actual trades or strategies is not necessarily indicative of future results.
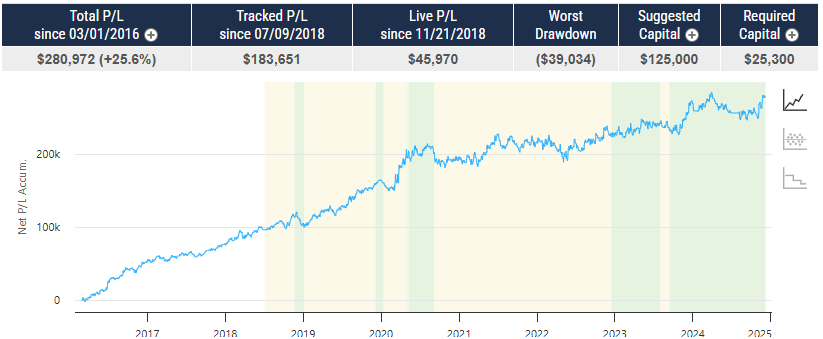
  • Broker’s Trading System of the Week

With algorithmic trading systems becoming more prevalent in portfolio diversification, the following system has been selected as the broker’s choice for this month.
PRODUCT
SYSTEM TYPE
Swing
COST
USD 160 / monthly
Recommended Cannon Trading Starting Capital
$25,000
83550ce4 cf9c 4afc ab89 e5ee2fd9dd36
The performance shown above is hypothetical in that the chart represents returns in a model account. The model account rises or falls by the average single contract profit and loss achieved by clients trading actual money pursuant to the listed system’s trading signals on the appropriate dates (client fills), or if no actual client profit or loss available – by the hypothetical single contract profit and loss of trades generated by the system’s trading signals on that day in real time (real‐time) less slippage, or if no real time profit or loss available – by the hypothetical single contract profit and loss of trades generated by running the system logic backwards on back adjusted data. Please read full disclaimer HERE.
Would you like to receive daily support & resistance levels?
Yes
S
No
S


Daily Levels for April 8th 2024

4d7ce40c c23b 4ee7 b34c e5b2c3d70422

Trading Reports for Next Week

7e9a5c96 d05e 4beb 9567 5c95f07367e0
d259df9c bf07 4429 9fa8 d12b53c37804
First Notice (FN), Last trading (LT) Days for the Week:
d43865c8 31dd 4466 b8a5 e96ddde4d232

Improve Your Trading Skills

Get access to proprietary indicators and trading methods, consult with an experienced broker at 1-800-454-9572.

Explore trading methods. Register Here

* This is not a solicitation of any order to buy or sell, but a current market view provided by Cannon Trading Inc. Any statement of facts here in contained are derived from sources believed to be reliable, but are not guaranteed as to accuracy, nor they purport to be complete. No responsibility is assumed with respect to any such statement or with respect to any expression of opinion herein contained. Readers are urged to exercise their own judgement in trading.

NFP Tomorrow + Futures Trading Levels for 04.05.2024

Get Real Time updates and more by joining our Private Facebook Group!
Subscribe to our YouTube Channel


C37


  • NonFarm Payrolls, NFP one of the biggest data points every month tomorrow @ 7:30CDT
  • Expectations are 200K added ( the market pays attention to the revisions equally)
  • Manage your capital well, take on less risk than you would during normal time frames.
  • 4 FED Speakers tomorrow Beginning @ 7:30AM CDT.


May Copper chart for your review below.

49df7b82 c10f 4ad1 8b49 5d1c81f9a81e


stars

e35cb555 9ff3 4f00 9fe8 0655b28fbd90

Daily Levels for April 5th, 2024

8afc3dcb 7af1 4acc 8557 4d06cf22b2e9

thumbnail?url=http%3A%2F%2Fi.ytimg.com%2Fvi%2FJnHAMUGdNoM%2Fhqdefault

Economic Reports
provided by: ForexFactory.com
All times are Eastern Time ( New York)
20333e1d 9936 4e97 81f9 e3956dff7265

Improve Your Trading Skills

Get access to proprietary indicators and trading methods, consult with an experienced broker at 1-800-454-9572.

Explore trading methods. Register Here

3b644da2 2bee 4d39 8d98 5208a20bec39

* This is not a solicitation of any order to buy or sell, but a current market view provided by Cannon Trading Inc. Any statement of facts here in contained are derived from sources believed to be reliable, but are not guaranteed as to accuracy, nor they purport to be complete. No responsibility is assumed with respect to any such statement or with respect to any expression of opinion herein contained. Readers are urged to exercise their own judgement in trading.

First Notice, Last Trading Days + Futures Trading Levels for 04.04.2024

Get Real Time updates and more by joining our Private Facebook Group!
Subscribe to our YouTube Channel


C36


Below are the contracts which are entering First Notice or Last Trading Day for the upcoming month. Be advised, for contracts that are deliverable, it is requested that all LONG positions be exited two days prior to First Notice and ALL positions be exited the day prior to Last Trading Day. If you have any questions please contact the Trade Desk


bac7c593 9977 4089 a012 8c6fc8260c09

ee518d6e d05a 425d bb50 7dcce2603d76

US 30 yr Bonds chart for your review below.

45110c36 6cc1 437c a8db 0ee5f220aeb9

Plan your trade and trade your plan


stars

e35cb555 9ff3 4f00 9fe8 0655b28fbd90

Daily Levels for April 4th, 2024

1e70b16d 0700 446c aa12 4c3e5950cef1

thumbnail?url=http%3A%2F%2Fi.ytimg.com%2Fvi%2FJnHAMUGdNoM%2Fhqdefault

Economic Reports
provided by: ForexFactory.com
All times are Eastern Time ( New York)
d2511a9f 0c19 4191 b814 53f114d51427

Improve Your Trading Skills

Get access to proprietary indicators and trading methods, consult with an experienced broker at 1-800-454-9572.

Explore trading methods. Register Here

3b644da2 2bee 4d39 8d98 5208a20bec39

* This is not a solicitation of any order to buy or sell, but a current market view provided by Cannon Trading Inc. Any statement of facts here in contained are derived from sources believed to be reliable, but are not guaranteed as to accuracy, nor they purport to be complete. No responsibility is assumed with respect to any such statement or with respect to any expression of opinion herein contained. Readers are urged to exercise their own judgement in trading.

OPEC Meeting + Futures Trading Levels for April 3rd

Get Real Time updates and more by joining our Private Facebook Group!
Subscribe to our YouTube Channel


C36


OPEC Meeting tomorrow

  • OPEC+ JMMC meets on Wednesday at 1100 GMT
  • Producers earlier agreed to extend output cuts
  • Oil rallies to $89 a barrel, highest this year

LONDON, April 2 (Reuters) – An OPEC+ ministerial panel is unlikely to recommend any oil output policy changes at a meeting on Wednesday, five OPEC+ sources told Reuters, as oil prices hit their highest this year.

The Organization of the Petroleum Exporting Countries and allies led by Russia, known as OPEC+, will hold an online joint ministerial monitoring committee meeting (JMMC) on April 3 to review the market and members’ implementation of output cuts they have already agreed to extend.

Gold hit all time highs!

Gold chart for your review below.


9d030a51 bab9 46e6 89ea f013c8027406


Plan your trade and trade your plan


stars

e35cb555 9ff3 4f00 9fe8 0655b28fbd90

Daily Levels for April 3rd, 2024

be9e5c9c a5a5 4cac 9bfb aa780f8e5287

thumbnail?url=http%3A%2F%2Fi.ytimg.com%2Fvi%2FJnHAMUGdNoM%2Fhqdefault

Economic Reports
provided by: ForexFactory.com
All times are Eastern Time ( New York)
28be01ed 32e0 4782 9729 af04dbcb3640

Improve Your Trading Skills

Get access to proprietary indicators and trading methods, consult with an experienced broker at 1-800-454-9572.

Explore trading methods. Register Here

3b644da2 2bee 4d39 8d98 5208a20bec39

* This is not a solicitation of any order to buy or sell, but a current market view provided by Cannon Trading Inc. Any statement of facts here in contained are derived from sources believed to be reliable, but are not guaranteed as to accuracy, nor they purport to be complete. No responsibility is assumed with respect to any such statement or with respect to any expression of opinion herein contained. Readers are urged to exercise their own judgement in trading.

Gold Outlook + Futures Trading Levels for April 2, 2024

Get Real Time updates and more by joining our Private Facebook Group!
Subscribe to our YouTube Channel


C35


First Week of Q2!

  • Heavy Fed Speeches, 19 Count ’em, Tuesday thru Friday with JPowell on Wednesday @ 11:10 a.m. CDT from Stanford.
  • Earnings season will officially begin the middle of April.
  • Economic Data Highlights : Jobless Claims early Thursday and NonFarm Payrolls headline Friday pre-opening
  • Gold Chart for your viewing below


9d030a51 bab9 46e6 89ea f013c8027406


4ee7278b 3e12 4019 8b79 e3382861f0be

Plan your trade and trade your plan


stars

e35cb555 9ff3 4f00 9fe8 0655b28fbd90

Daily Levels for April 2nd, 2024

b6b1a0dd 2eaf 4af9 bcd8 7c8b7e9715d7

thumbnail?url=http%3A%2F%2Fi.ytimg.com%2Fvi%2FJnHAMUGdNoM%2Fhqdefault

Economic Reports
provided by: ForexFactory.com
All times are Eastern Time ( New York)
76a21941 8f5f 45be 8344 a285dcf4b0e7

Improve Your Trading Skills

Get access to proprietary indicators and trading methods, consult with an experienced broker at 1-800-454-9572.

Explore trading methods. Register Here

3b644da2 2bee 4d39 8d98 5208a20bec39

* This is not a solicitation of any order to buy or sell, but a current market view provided by Cannon Trading Inc. Any statement of facts here in contained are derived from sources believed to be reliable, but are not guaranteed as to accuracy, nor they purport to be complete. No responsibility is assumed with respect to any such statement or with respect to any expression of opinion herein contained. Readers are urged to exercise their own judgement in trading.

Good Friday Schedule and Futures Trading Levels for March 28th

Get Real Time updates and more by joining our Private Facebook Group!
Subscribe to our YouTube Channel


C25


Good Friday Holiday Trading Schedule – 2024

  • Thursday March 28, 2024 all CME markets have a regular close.
  • No CME trading for Friday March 29, 2024 trade date in observance of Good Friday.
  • See full schedule here.


aa10efaf 79df 42c5 8a2c a369230fa306


Plan your trade and trade your plan


stars

e35cb555 9ff3 4f00 9fe8 0655b28fbd90

Daily Levels for March 28th, 2024

f3a34518 22f1 467c 9274 98c2c6ed58f0

b0ba1776 c0cd 4536 92c1 eef6595d7173

Economic Reports
provided by: ForexFactory.com
All times are Eastern Time ( New York)
df730780 4f5c 4d3f b456 839b8ca4fa8c

Improve Your Trading Skills

Get access to proprietary indicators and trading methods, consult with an experienced broker at 1-800-454-9572.

Explore trading methods. Register Here

3b644da2 2bee 4d39 8d98 5208a20bec39

* This is not a solicitation of any order to buy or sell, but a current market view provided by Cannon Trading Inc. Any statement of facts here in contained are derived from sources believed to be reliable, but are not guaranteed as to accuracy, nor they purport to be complete. No responsibility is assumed with respect to any such statement or with respect to any expression of opinion herein contained. Readers are urged to exercise their own judgement in trading.

Weekly Hueber Report: Now is it time to worry? Trading Levels for March 27th

Get Real Time updates and more by joining our Private Facebook Group!
Subscribe to our YouTube Channel


C33


The Following is analysis from Dan Hueber. You can find his analysis on Our QT Market Trading platform


Weekly Hueber Report: Now is it time to worry?


According to the Federal l Reserve Bank of New York, household debt in the United States grew by $212 billion to reach $17.5 trillion in the fourth quarter of last year. The lion’s share of this debt is wrapped up in mortgages and home equity lines of credit, which grew $112 billion during the quarter and reached $12.25 trillion. Auto loans rose $12 billion to $1.61 trillion, and student loans were flat at around $1.6 trillion, but the most significant percentage growth came via credit cards, which jumped $50 billion to $1.13 trillion.


5a13d0b4 a6a5 48cc a290 65d90fbed22a

Do keep in mind that as the overall population continues to grow, it is only natural for debt to expand along with it. Still, when you add in the fact that savings went backward during that same period, it would appear that the American consumer is increasingly relying on debt to meet day-to-day needs and wants. I should point out that savings balances have not slipped to as low as they were during the second quarter of 2022 and remain relatively consistent with the period between 2010 and 2018. However, both the amount being tucked away and the personal savings rate have been trending lower again.

e03bcb42 a23c 4b1d 9194 571e57e3713e

There is one more telling chart that we need to throw into the mix—the delinquency rate on credit cards. While nowhere near the nearly 7% level witnessed during the Great Recession or even the averages seen throughout much of the 1990s, it has been climbing steadily for the past two years and has risen to the highest level since the second quarter of 2011.

6dfc3180 7d60 42c0 b005 7fa2df52ca85

Granted, not all of this news has been bleak, at least not if you are in the banking sector. Last year, they reported an estimated $92 billion in earnings, and this after taking into account funding costs and loan losses. This is more than double what they were earning from credit cards a decade ago. As the old proverb says, one man’s poison is another man’s pleasure. While there are a number of other elements that factor into this, it should come as no surprise that recent surveys find that 41% of Americans believe they are worse off than four years ago. In case you were wondering, 24% say they are better off, and 34% said they were about the same. That still leaves the majority of people thinking that at least they have been holding their own, but these debt trends would appear to suggest that number may shrink in the months ahead.

**The views expressed above are entirely those of the author.

DH


Plan your trade and trade your plan


stars

e35cb555 9ff3 4f00 9fe8 0655b28fbd90

Daily Levels for March 27th, 2024

53ed0cce e698 47a5 8126 45cb8fda23cd

b0ba1776 c0cd 4536 92c1 eef6595d7173

Economic Reports
provided by: ForexFactory.com
All times are Eastern Time ( New York)
6eaa8ebc d1a1 4b54 9f6f d28f636b6a04

Improve Your Trading Skills

Get access to proprietary indicators and trading methods, consult with an experienced broker at 1-800-454-9572.

Explore trading methods. Register Here

3b644da2 2bee 4d39 8d98 5208a20bec39

* This is not a solicitation of any order to buy or sell, but a current market view provided by Cannon Trading Inc. Any statement of facts here in contained are derived from sources believed to be reliable, but are not guaranteed as to accuracy, nor they purport to be complete. No responsibility is assumed with respect to any such statement or with respect to any expression of opinion herein contained. Readers are urged to exercise their own judgement in trading.

What to expect on this short trading week? Trading Levels for March 26th

Get Real Time updates and more by joining our Private Facebook Group!
Subscribe to our YouTube Channel


C32


What to expect on this short trading week?

With Good Friday coming up we will only have 4 days trading week.

Fed Chair Jay Powell said Wednesday that central bank officials discussed a strategy for how to slow the shrinking of the Fed’s balance sheet,

The plan to slow down the balance-sheet runoff could come as soon as May.

The Fed’s securities holdings topped out at $9 trillion in 2022 — the year it decided to pivot and act aggressively to tamp down rising inflation. The strategy is known as quantitative tightening, or QT. QE refers to the Fed buying assets to lower longer-term interest rates, and QT means the Fed is selling assets to put upward pressure on longer-term rates. QE is used when the Fed wants to stimulate the economy and reduce interest rates on longer-term securities. The Fed tried QT once before, starting in 2017, when Janet Yellen oversaw the central bank. That shrinking of its portfolio drained bank reserves held at the central bank and led to some unexpected turbulence in 2019 after Powell had taken over.

Expectations that the Fed would cut rates by June rose to around 75% in futures markets later Wednesday, up from closer to 50% earlier this week, according to CME Group.

What about the hot PPI and CPI reports that came in last week? The latest data haven’t really changed the overall story, which is that of inflation moving down gradually on a sometimes-bumpy road toward 2%.

Many economists and some inside the Fed anticipated that the central bank’s rate increases to bring inflation down would lead to higher unemployment and a recession. But economic growth has shown surprising resilience even as wage and price increases have slowed thanks to healed supply chains and an influx of workers into the labor force.

Using the Fed’s preferred gauge, inflation excluding volatile food and energy prices has fallen to around 2.8% recently, down from 4.8% one year ago.

FED said while officials didn’t “see this in the data right now,” a significant slowdown in the labor market “could also be a reason for us to begin the process of reducing rates.

Wage growth has continued to slow, and unemployment has steadily inched up, from 3.4% last April to 3.9% in February.

The stakes are high for Fed officials, who are trying to navigate two risks. One is that they ease too soon, allowing inflation to become entrenched at a level above their 2% target. The other is that they move too slowly and the economy crumples under the weight of higher rates.

The Summary of Economic Projections expects gross domestic product growth to hit 2.1% by the end of 2024, up from December’s 1.4% forecast.

Higher housing prices and stock-market gains are boosting wealth and thus supporting consumption, especially of high-income households. The price of bitcoin has recently surged to records, a sign of exuberant risk-taking.

Homebuilders ETF: XHB. Stocks – KBH, TOL, LEN.

e52e93ca 1eb6 4e57 bf49 075fca870f38


Plan your trade and trade your plan


stars

e35cb555 9ff3 4f00 9fe8 0655b28fbd90

Daily Levels for March 26th, 2024

423d9498 0c19 4ee3 b8a6 65ddd7cce524

b0ba1776 c0cd 4536 92c1 eef6595d7173

Economic Reports
provided by: ForexFactory.com
All times are Eastern Time ( New York)
33270553 86ad 4288 9840 a636553ae386

Improve Your Trading Skills

Get access to proprietary indicators and trading methods, consult with an experienced broker at 1-800-454-9572.

Explore trading methods. Register Here

3b644da2 2bee 4d39 8d98 5208a20bec39

* This is not a solicitation of any order to buy or sell, but a current market view provided by Cannon Trading Inc. Any statement of facts here in contained are derived from sources believed to be reliable, but are not guaranteed as to accuracy, nor they purport to be complete. No responsibility is assumed with respect to any such statement or with respect to any expression of opinion herein contained. Readers are urged to exercise their own judgement in trading.