Support & Resistance Levels 8.14.2018

____________________________________________________________________

Voted #1 Blog and #1 Brokerage Services on TraderPlanet for 2016!!  

____________________________________________________________________

Dear Traders,

Like us on FaceBook!
Get Real Time updates and market alerts on Twitter!
Jim Wyckoff Discusses Entry & Exit Strategies

I have received several email messages from my readers asking about how to best determine entry and exit strategies when trading markets. Here are just a few of their quotes:
  • “Though my success rate has been high, I am only breaking even financially, due to getting out too early in profit and letting my losses run too far.”
  • “Many articles are written showing when and where to enter trades… but how many articles are written about “running” positions? Where to exit surely has to be the biggest key to trading success!”
  • “I would appreciate some advice or tips on how to and when to enter a market and when to exit.”
Of course, if a trader knew exactly when to get into a market and when to get out, wouldn’t trading be easy! But even the most successful traders in the world can’t do that. The best they can strive for is to catch a bigger part of any move (trend) in the market, and then get out with a good profit before the market turns against them.
I’ve written past articles on trading with the trend and not against it, on the perils of trying to pick tops and bottoms, on support and resistance, and on letting profits run and cutting losses short, as well as trading the “breakouts.” I won’t repeat all those trading tenets here, but if you’ve missed some of my articles, drop me an email and I can attach some of them in an email to you.
 
84ed7e45 9d87 4182 ac9a 5b675b331a0e


Good Trading

Trading Futures, Options on Futures, and retail off-exchange foreign currency transactions involves substantial risk of loss and is not suitable for all investors.  You should carefully consider whether trading is suitable for you in light of your circumstances, knowledge, and financial resources. You may lose all or more of your initial investment. Opinions, market data, and recommendations are subject to change at any time.

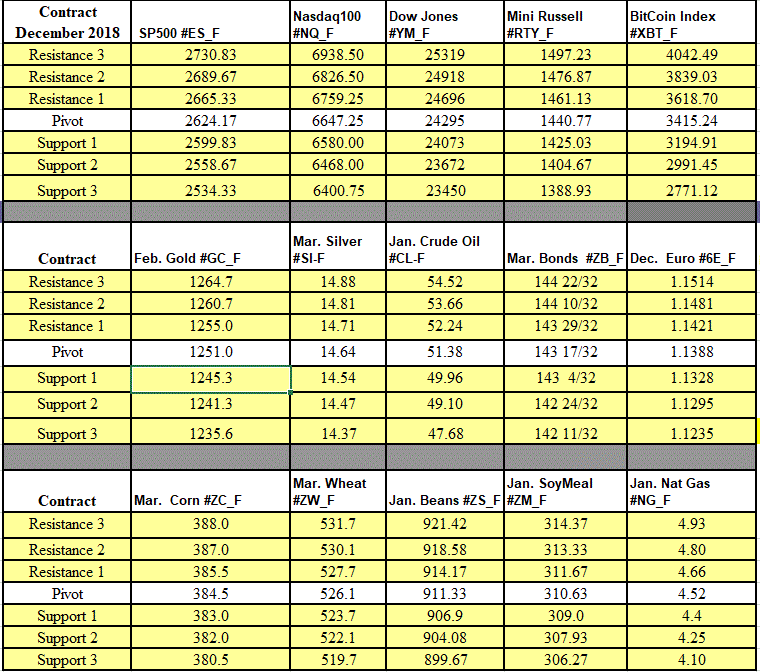
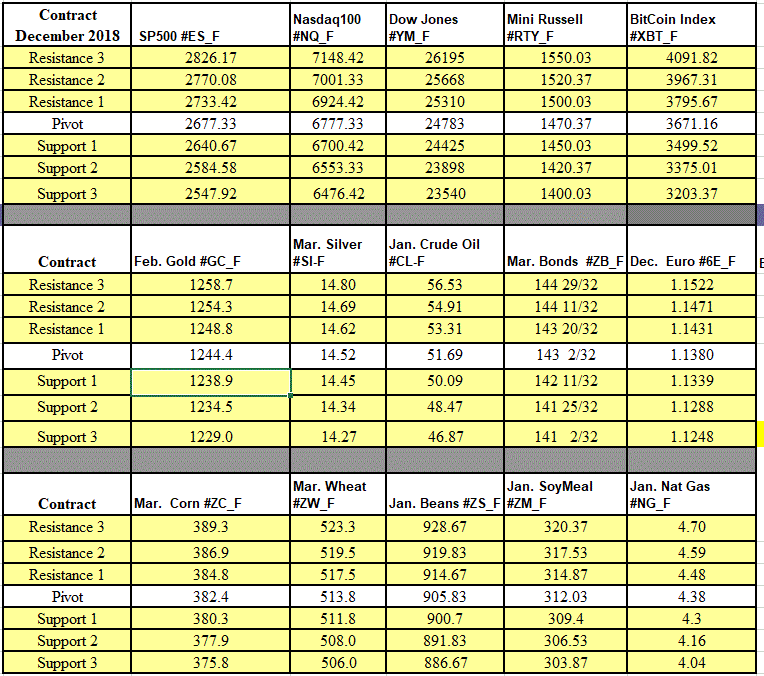
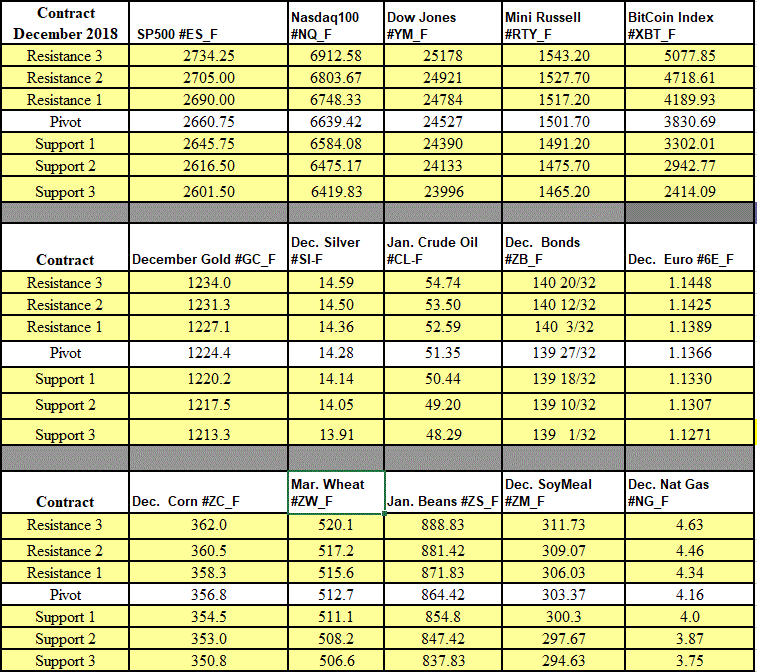
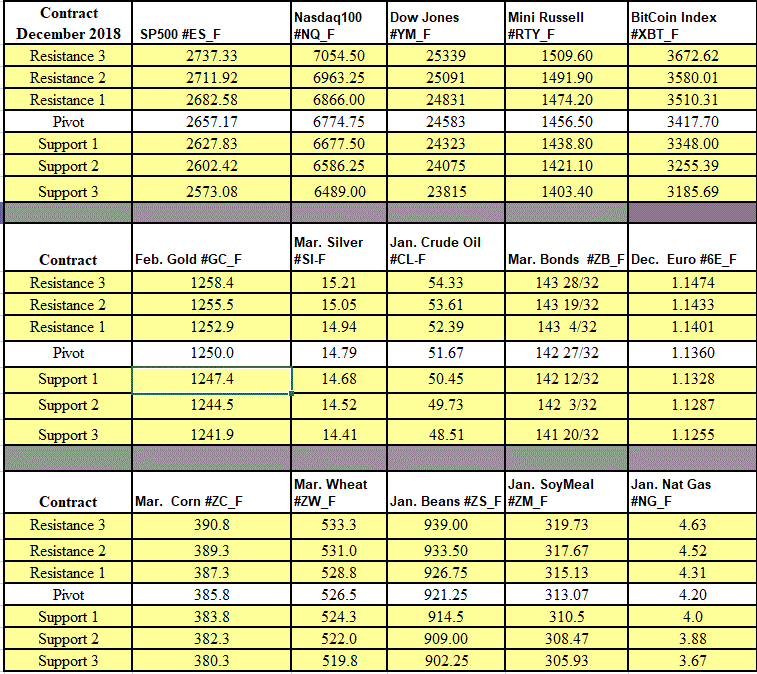
Futures Trading Levels

08-14-2018


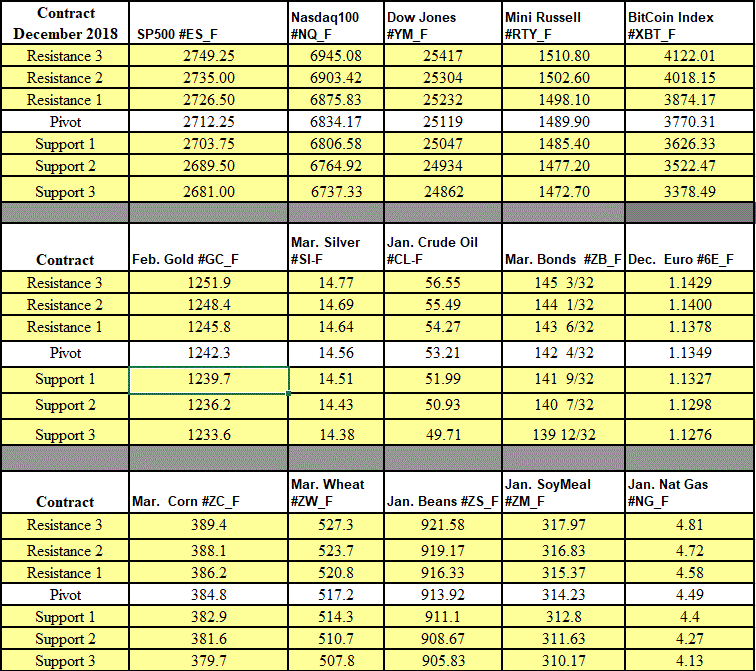
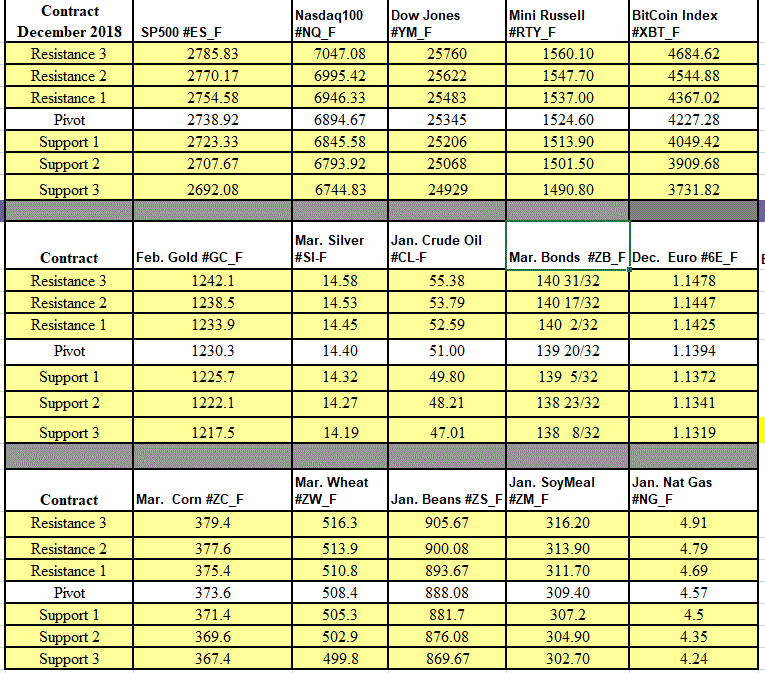
Contract September 2018  SP500 #ES_F Nasdaq100  #NQ_F Dow Jones  #YM_F Mini Russell #RTY_F BitCoin Index #XBT_F
Resistance 3 2862.92 7570.83 25572 1711.77 7179.07
Resistance 2 2853.33 7524.92 25471 1701.83 6899.52
Resistance 1 2839.17 7470.08 25342 1689.77 6563.93
Pivot 2829.58 7424.17 25241 1679.83 6284.38
Support 1 2815.42 7369.33 25112 1667.77 5948.79
Support 2 2805.83 7323.42 25011 1657.83 5669.24
Support 3 2791.67 7268.58 24882 1645.77 5333.65
Contract December Gold #GC_F Sept. Silver #SI-F Sept. Crude Oil #CL-F Sept.  Bonds  #ZB_F Sept.  Euro #6E_F
Resistance 3 1237.8 15.61 70.52 145 16/32 1.1529
Resistance 2 1229.6 15.48 69.23 145  4/32 1.1495
Resistance 1 1215.0 15.23 68.28 144 24/32 1.1462
Pivot 1206.8 15.10 66.99 144 12/32 1.1428
Support 1 1192.2 14.86 66.04 144 1.1394
Support 2 1184.0 14.73 64.75 143 20/32 1.1360
Support 3 1169.4 14.48 63.80 143  8/32 1.1327
Contract Dec.  Corn #ZC_F Sept. Wheat #ZW_F Nov. Beans #ZS_F Dec. SoyMeal #ZM_F Sept. Nat Gas #NG_F
Resistance 3 377.8 549.6 894.33 340.40 3.00
Resistance 2 374.5 545.2 882.42 335.00 2.97
Resistance 1 372.5 539.3 875.58 331.90 2.95
Pivot 369.3 534.9 863.67 326.50 2.92
Support 1 367.3 529.1 856.8 323.4 2.9
Support 2 364.0 524.7 844.92 318.00 2.87
Support 3 362.0 518.8 838.08 314.90 2.85

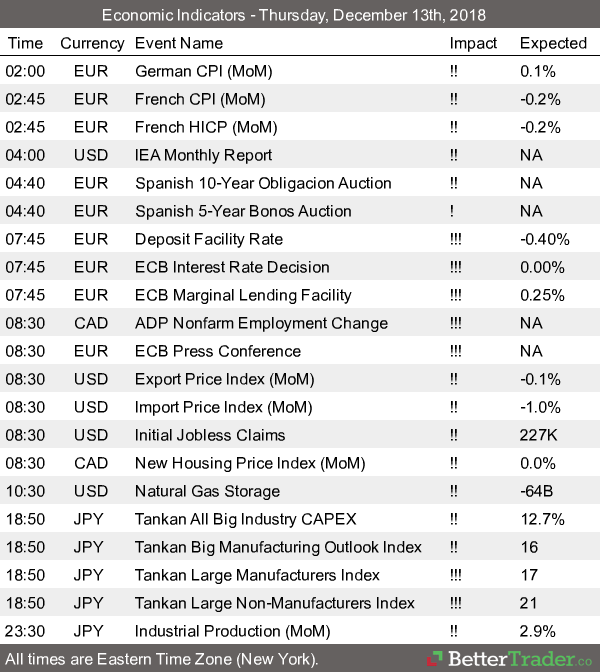
Economic Reports, source: 

https://app.bettertrader.com

32051449 a63f 4918 9625 9d9afd01d438


This is not a solicitation of any order to buy or sell, but a current market view provided by Cannon Trading Inc. Any statement of facts here in contained are derived from sources believed to be reliable, but are not guaranteed as to accuracy, nor they purport to be complete. No responsibility is assumed with respect to any such statement or with respect to any expression of opinion herein contained. Readers are urged to exercise their own judgement in trading.
8 Steps to improve your trading & Support & Resistance Levels 8.10.2018

____________________________________________________________________

Voted #1 Blog and #1 Brokerage Services on TraderPlanet for 2016!!  

____________________________________________________________________

Dear Traders,

Like us on FaceBook!
Get Real Time updates and market alerts on Twitter!
Some resources to share with you:
 

8 steps to improve your trading!


Good Trading

Trading Futures, Options on Futures, and retail off-exchange foreign currency transactions involves substantial risk of loss and is not suitable for all investors.  You should carefully consider whether trading is suitable for you in light of your circumstances, knowledge, and financial resources. You may lose all or more of your initial investment. Opinions, market data, and recommendations are subject to change at any time.

Futures Trading Levels

08-10-2018


Contract September 2018  SP500 #ES_F Nasdaq100  #NQ_F Dow Jones  #YM_F Mini Russell #RTY_F BitCoin Index #XBT_F
Resistance 3 2871.42 7548.00 25700 1713.67 6987.89
Resistance 2 2867.08 7526.75 25652 1706.43 6770.17
Resistance 1 2860.92 7501.25 25574 1699.57 6623.63
Pivot 2856.58 7480.00 25526 1692.33 6405.91
Support 1 2850.42 7454.50 25448 1685.47 6259.37
Support 2 2846.08 7433.25 25400 1678.23 6041.65
Support 3 2839.92 7407.75 25322 1671.37 5895.11
Contract December Gold #GC_F Sept. Silver #SI-F Sept. Crude Oil #CL-F Sept.  Bonds  #ZB_F Sept.  Euro #6E_F
Resistance 3 1231.2 15.67 68.16 144 14/32 1.1719
Resistance 2 1228.4 15.60 67.79 143 31/32 1.1684
Resistance 1 1224.0 15.53 67.24 143 23/32 1.1624
Pivot 1221.2 15.45 66.87 143  8/32 1.1589
Support 1 1216.8 15.38 66.32 143 1.1529
Support 2 1214.0 15.31 65.95 142 17/32 1.1494
Support 3 1209.6 15.24 65.40 142  9/32 1.1434
Contract Dec.  Corn #ZC_F Sept. Wheat #ZW_F Nov. Beans #ZS_F Dec. SoyMeal #ZM_F Sept. Nat Gas #NG_F
Resistance 3 391.9 579.5 920.50 341.57 2.99
Resistance 2 389.1 575.5 916.50 340.03 2.98
Resistance 1 385.9 570.0 910.25 337.47 2.96
Pivot 383.1 566.0 906.25 335.93 2.95
Support 1 379.9 560.5 900.0 333.4 2.9
Support 2 377.1 556.5 896.00 331.83 2.92
Support 3 373.9 551.0 889.75 329.27 2.90

Economic Reports, source: 

https://app.bettertrader.com

c11c3efa bcac 43fe 9d4d f15d20364a34


This is not a solicitation of any order to buy or sell, but a current market view provided by Cannon Trading Inc. Any statement of facts here in contained are derived from sources believed to be reliable, but are not guaranteed as to accuracy, nor they purport to be complete. No responsibility is assumed with respect to any such statement or with respect to any expression of opinion herein contained. Readers are urged to exercise their own judgement in trading.

Create Trading Rules + Support & Resistance Levels 8.9.2018

____________________________________________________________________

Voted #1 Blog and #1 Brokerage Services on TraderPlanet for 2016!!  

____________________________________________________________________

Dear Traders,

Like us on FaceBook!
Get Real Time updates and market alerts on Twitter!
Creating Trading Rules can help eliminate some of the emotions from trading when speaking of trading rules, I think there are two levels of the subject. One is in terms of general rules such as:
  • Only use risk capital
  • Do not over trade
  • Do not be greedy and many more of this nature
The other set of trading rules relate more to trading strategy perhaps even trade systems. In my opinion, the following are important trading rules when it comes to a trading strategy:
  1. Know which markets you are trading
  2. Know how many markets you are trading at any one give time
  3. Know the time frame for your trading, i.e. Are you day trading or swing trading?
Once you answer the questions above you can get into even more specific rules. For the sake of educational purposes let’s assume the following:
  • We will focus on trading crude oil, mini Russell 200 and gold futures.
  • We cannot be in more than 2 markets at any one given time.
  • We are approaching trading as an intraday activity, so we will be in and out within the primary trading sessions that starts at 8:30 AM EST and ends at 4 PM EST
Now that we know the answers for the first more general set of rules you need to decide and answer the questions below to create the following trading rules:
  1. When do we enter a trade?
  2. Quantity of contracts we will trade?
  3. Decide when to exit a trade when a trade is losing
  4. Decide rules for taking profits or exit targets.


Good Trading

Trading Futures, Options on Futures, and retail off-exchange foreign currency transactions involves substantial risk of loss and is not suitable for all investors.  You should carefully consider whether trading is suitable for you in light of your circumstances, knowledge, and financial resources. You may lose all or more of your initial investment. Opinions, market data, and recommendations are subject to change at any time.

Futures Trading Levels

08-09-2018


Contract September 2018  SP500 #ES_F Nasdaq100  #NQ_F Dow Jones  #YM_F Mini Russell #RTY_F BitCoin Index #XBT_F
Resistance 3 2871.00 7551.17 25721 1709.97 7366.32
Resistance 2 2866.75 7523.58 25676 1701.13 7080.50
Resistance 1 2861.50 7497.67 25608 1694.27 6698.67
Pivot 2857.25 7470.08 25563 1685.43 6412.85
Support 1 2852.00 7444.17 25495 1678.57 6031.02
Support 2 2847.75 7416.58 25450 1669.73 5745.20
Support 3 2842.50 7390.67 25382 1662.87 5363.37
Contract December Gold #GC_F Sept. Silver #SI-F Sept. Crude Oil #CL-F Sept.  Bonds  #ZB_F Sept.  Euro #6E_F
Resistance 3 1235.9 15.69 71.71 143 16/32 1.1726
Resistance 2 1229.8 15.58 70.54 143  6/32 1.1694
Resistance 1 1225.7 15.51 68.66 142 30/32 1.1670
Pivot 1219.6 15.40 67.49 142 20/32 1.1638
Support 1 1215.5 15.33 65.61 142 12/32 1.1614
Support 2 1209.4 15.22 64.44 142  2/32 1.1582
Support 3 1205.3 15.15 62.56 141 26/32 1.1558
Contract Dec.  Corn #ZC_F Sept. Wheat #ZW_F Nov. Beans #ZS_F Dec. SoyMeal #ZM_F Sept. Nat Gas #NG_F
Resistance 3 389.8 590.7 923.67 347.10 3.04
Resistance 2 388.7 584.3 918.83 342.40 2.99
Resistance 1 386.8 577.2 914.67 339.90 2.97
Pivot 385.7 570.8 909.83 335.20 2.93
Support 1 383.8 563.7 905.7 332.7 2.9
Support 2 382.7 557.3 900.83 328.00 2.86
Support 3 380.8 550.2 896.67 325.50 2.83

Economic Reports, source: 

https://app.bettertrader.com

0194aaa6 8fb8 48b0 82d3 1347d5c22e6f

This is not a solicitation of any order to buy or sell, but a current market view provided by Cannon Trading Inc. Any statement of facts here in contained are derived from sources believed to be reliable, but are not guaranteed as to accuracy, nor they purport to be complete. No responsibility is assumed with respect to any such statement or with respect to any expression of opinion herein contained. Readers are urged to exercise their own judgement in trading.
Different markets for day trading + Support & Resistance Levels 8.8.2018

____________________________________________________________________

Voted #1 Blog and #1 Brokerage Services on TraderPlanet for 2016!!  

____________________________________________________________________

Dear Traders,

Like us on FaceBook!
Get Real Time updates and market alerts on Twitter!
Each market has a different personality, different behavior along with different times of the day when it is most active. If you are finding that the ES (mini SP)  is not giving you enough risk/opportunities then start monitoring a couple of other markets and perhaps explore them in demo / simulated mode.
I think that there are more than a few markets that are suitable for day-trading. Below you will find some observations, tips along with what are unique about these markets, personality and most active trading hours (interest rates, mostly the ten year and 30 year).
In most platforms, the symbols are ZB for 30 year bonds and ZN for 10 year notes.
bfae2b31 e8b6 490e 86cd 693fc0f7b7a3
Product Symbol
ZB
Contract Size
The unit of trading shall be U.S. Treasury Bonds having a face value at maturity of one hundred thousand dollars ($100,000) or multiples thereof
Price Quotation
Points ($1,000) and 1/32 of a point. For example, 134-16 represents 134 16/32. Par is on the basis of 100 points.
Product Symbol
ZN
Underlying Unit
One U.S. Treasury note having a face value at maturity of $100,000.
Deliverable Grades
U.S. Treasury notes with a remaining term to maturity of at least six and a half years, but not more than 10 years, from the first day of the delivery month. The invoice price equals the futures settlement price times a conversion factor, plus accrued interest. The conversion factor is the price of the delivered note ($1 par value) to yield 6 percent.
Price Quote
Points ($1,000) and halves of 1/32 of a point. For example, 126-16 represents 126 16/32 and 126-165 represents 126 16.5/32. Par is on the basis of 100 points.
Tick Size
(minimum fluctuation)
One-half of one thirty-second (1/32) of one point ($15.625, rounded up to the nearest cent per contract), except for intermonth spreads, where the minimum price fluctuation shall be one-quarter of one thirty-second of one point ($7.8125 per contract).
Contract Months
The first five consecutive contracts in the March, June, September, and December quarterly cycle.
These contracts are often affected by many of the economic reports that come out at 8:30 AM Eastern and there is very active volume between the hours of 8 AM EST and 3 PM EST
Volume on both contracts is very good.  Ten years will often have 1 million contracts traded per day (might be the second most active US futures market after the mini SP 500) and the bonds will avg. around 300,000 contracts.
These markets can experience very volatile movements during and right after different reports but then will often trade smooth or in an intraday trend the rest of the day.
Currency Futures Markets
I personally prefer currency futures over FOREX any day. For more than a few reasons but the main ones are: currency futures trade a regulated main exchange (CME) while FOREX trades through different interbanks and other means of transactions that are not necessarily regulated. FOREX are “commission free” but in reality there is a spread built in that dealer marks up each time you buy or sell which makes FOREX more expensive to trade than futures.
The main ones I like to follow are:
The Euro , The Yen, The British Pound, The Australian. All are paired versus the US$.
Each market will have different times of higher volume which can allow for traders in all time zones to pick their market. Simply open an hourly chart and add the volume indicator to observe what times the market has the most action.
1 Euro tick is $6.25
1 Yen tick is $6.25
1 Aussie tick is $10
1 British tick is $6.25
Currency futures will often trend better than other segments and will experience different levels of volatility during economic reports in the different parts of the world.
If you plan on following any currencies, start in demo mode, know what reports are coming that affect the specific currency you are trading, take a look at the daily, weekly charts to get a feel and monitor the action for a while.
Crude Oil and Gold Futures.
More than a few similarities between the two markets.
They are both volatile and can move VERY fast. I have seen some very large moves happen in matter of minutes if not seconds. The “fear & greed” factor really plays a role in these specific two markets.
Both have active trading hours starting with Far East trading around 10 PM EST all the way to the next morning until about 3 PM EST. Good volume generally speaking but not close to the mini SP or Ten Year notes. So you may see some slippage on stops but the volume is more than enough to trade size.
Each tick in Gold is $10, so every dollar move =$100 against you or in your favor. Crude is similar, each tick = $10. One full $1 move = $1000.
I like using overbought/ oversold indicators on the two markets as well as using range / Renko charts.
bfae2b31 e8b6 490e 86cd 693fc0f7b7a3
practice first_


Good Trading

Trading Futures, Options on Futures, and retail off-exchange foreign currency transactions involves substantial risk of loss and is not suitable for all investors.  You should carefully consider whether trading is suitable for you in light of your circumstances, knowledge, and financial resources. You may lose all or more of your initial investment. Opinions, market data, and recommendations are subject to change at any time.

Futures Trading Levels

08-08-2018


Contract September 2018  SP500 #ES_F Nasdaq100  #NQ_F Dow Jones  #YM_F Mini Russell #RTY_F BitCoin Index #XBT_F
Resistance 3 2881.92 7542.75 25895 1707.77 7451.35
Resistance 2 2872.83 7514.75 25778 1702.53 7301.56
Resistance 1 2866.42 7496.25 25694 1696.47 7139.08
Pivot 2857.33 7468.25 25577 1691.23 6989.29
Support 1 2850.92 7449.75 25493 1685.17 6826.81
Support 2 2841.83 7421.75 25376 1679.93 6677.02
Support 3 2835.42 7403.25 25292 1673.87 6514.54
Contract December Gold #GC_F Sept. Silver #SI-F Sept. Crude Oil #CL-F Sept.  Bonds  #ZB_F Sept.  Euro #6E_F
Resistance 3 1231.9 15.69 70.65 143 28/32 1.1713
Resistance 2 1228.1 15.60 70.24 143 18/32 1.1678
Resistance 1 1223.2 15.49 69.63 143  2/32 1.1655
Pivot 1219.4 15.40 69.22 142 24/32 1.1620
Support 1 1214.5 15.29 68.61 142  8/32 1.1598
Support 2 1210.7 15.20 68.20 141 30/32 1.1563
Support 3 1205.8 15.09 67.59 141 14/32 1.1540
Contract Dec.  Corn #ZC_F Sept. Wheat #ZW_F Nov. Beans #ZS_F Dec. SoyMeal #ZM_F Sept. Nat Gas #NG_F
Resistance 3 389.5 592.3 921.00 338.97 2.95
Resistance 2 388.0 585.8 914.75 336.73 2.93
Resistance 1 386.3 577.0 910.25 334.67 2.91
Pivot 384.8 570.5 904.00 332.43 2.88
Support 1 383.0 561.8 899.5 330.4 2.9
Support 2 381.5 555.3 893.25 328.13 2.84
Support 3 379.8 546.5 888.75 326.07 2.83

Economic Reports, source: 

https://app.bettertrader.com

bd010a96 54a4 4b0d 9ba6 6ad712623258


This is not a solicitation of any order to buy or sell, but a current market view provided by Cannon Trading Inc. Any statement of facts here in contained are derived from sources believed to be reliable, but are not guaranteed as to accuracy, nor they purport to be complete. No responsibility is assumed with respect to any such statement or with respect to any expression of opinion herein contained. Readers are urged to exercise their own judgement in trading.
Weekly Directional Bias – Support & Resistance Levels 8.7.2018

____________________________________________________________________

Voted #1 Blog and #1 Brokerage Services on TraderPlanet for 2016!!  

____________________________________________________________________

Dear Traders,

Like us on FaceBook!
Get Real Time updates and market alerts on Twitter!
Every Monday morning (actually, Sunday night most of the time), I run a scan of the major commodities’ weekly charts using some indicators I have learned to trust.
The scan produces a list of markets that will meet certain criteria and point to the chances that any of those commodities will continue moving in a certain direction.
This week’s results revealed the following:
Above a 60% chance to see a continued higher trend:
Wheat
Mini SP
Mini Dow
Above 60% to see a continued lower trend:
British Pound
Japanese Yen
Gold
Ten year notes

We would be more than happy to assist you and go over more details and possible strategies, if interested.  Feel free to contact us any time.


Good Trading

Trading Futures, Options on Futures, and retail off-exchange foreign currency transactions involves substantial risk of loss and is not suitable for all investors.  You should carefully consider whether trading is suitable for you in light of your circumstances, knowledge, and financial resources. You may lose all or more of your initial investment. Opinions, market data, and recommendations are subject to change at any time.

Futures Trading Levels

08-07-2018


Contract September 2018  SP500 #ES_F Nasdaq100  #NQ_F Dow Jones  #YM_F Mini Russell #RTY_F BitCoin Index #XBT_F
Resistance 3 2875.83 7529.92 25700 1709.20 8087.45
Resistance 2 2864.67 7489.83 25604 1698.40 7829.58
Resistance 1 2857.33 7467.67 25538 1692.60 7389.64
Pivot 2846.17 7427.58 25442 1681.80 7131.77
Support 1 2838.83 7405.42 25376 1676.00 6691.83
Support 2 2827.67 7365.33 25280 1665.20 6433.96
Support 3 2820.33 7343.17 25214 1659.40 5994.02
Contract December Gold #GC_F Sept. Silver #SI-F Sept. Crude Oil #CL-F Sept.  Bonds  #ZB_F Sept.  Euro #6E_F
Resistance 3 1234.1 15.65 71.09 144  5/32 1.1650
Resistance 2 1230.1 15.58 70.51 143 27/32 1.1628
Resistance 1 1222.5 15.44 69.67 143 15/32 1.1609
Pivot 1218.5 15.37 69.09 143  5/32 1.1587
Support 1 1210.9 15.24 68.25 142 25/32 1.1568
Support 2 1206.9 15.17 67.67 142 15/32 1.1546
Support 3 1199.3 15.03 66.83 142  3/32 1.1527
Contract Dec.  Corn #ZC_F Sept. Wheat #ZW_F Nov. Beans #ZS_F Dec. SoyMeal #ZM_F Sept. Nat Gas #NG_F
Resistance 3 389.3 597.4 904.00 338.30 2.92
Resistance 2 387.8 586.8 899.50 335.30 2.89
Resistance 1 386.5 580.7 896.50 332.40 2.87
Pivot 385.0 570.1 892.00 329.40 2.85
Support 1 383.8 563.9 889.0 326.5 2.8
Support 2 382.3 553.3 884.50 323.50 2.80
Support 3 381.0 547.2 881.50 320.60 2.79

Economic Reports, source: 

https://app.bettertrader.com


db8f431e 407f 47c2 b354 015fa2439e3a

This is not a solicitation of any order to buy or sell, but a current market view provided by Cannon Trading Inc. Any statement of facts here in contained are derived from sources believed to be reliable, but are not guaranteed as to accuracy, nor they purport to be complete. No responsibility is assumed with respect to any such statement or with respect to any expression of opinion herein contained. Readers are urged to exercise their own judgement in trading.
Jobs Report – Support & Resistance Levels 8.3.2018

____________________________________________________________________

Voted #1 Blog and #1 Brokerage Services on TraderPlanet for 2016!!  

____________________________________________________________________

Dear Traders,

Like us on FaceBook!
Get Real Time updates and market alerts on Twitter!
Job Report Video Click Below
f3479327 138b 4702 b528 2c9c774309da
The monthly job report, also known as non farm payroll comes out on the first Friday of every month and is a market mover report across the board!
Watch the video above for more insight and feel free to reach out directly with any questions or if you want to chat trading.


Good Trading

Trading Futures, Options on Futures, and retail off-exchange foreign currency transactions involves substantial risk of loss and is not suitable for all investors.  You should carefully consider whether trading is suitable for you in light of your circumstances, knowledge, and financial resources. You may lose all or more of your initial investment. Opinions, market data, and recommendations are subject to change at any time.

Futures Trading Levels

08-03-2018


Contract September 2018  SP500 #ES_F Nasdaq100  #NQ_F Dow Jones  #YM_F Mini Russell #RTY_F BitCoin Index #XBT_F
Resistance 3 2879.50 7618.25 25633 1722.07 7920.84
Resistance 2 2854.50 7504.25 25482 1703.53 7813.09
Resistance 1 2841.00 7442.25 25390 1693.87 7675.66
Pivot 2816.00 7328.25 25239 1675.33 7567.91
Support 1 2802.50 7266.25 25147 1665.67 7430.48
Support 2 2777.50 7152.25 24996 1647.13 7322.73
Support 3 2764.00 7090.25 24904 1637.47 7185.30
Contract December Gold #GC_F Sept. Silver #SI-F Sept. Crude Oil #CL-F Sept.  Bonds  #ZB_F Sept.  Euro #6E_F
Resistance 3 1239.3 15.64 72.35 143 14/32 1.1762
Resistance 2 1234.7 15.57 70.86 143  4/32 1.1733
Resistance 1 1225.8 15.45 69.91 142 24/32 1.1678
Pivot 1221.2 15.38 68.42 142 14/32 1.1649
Support 1 1212.3 15.26 67.47 142  2/32 1.1594
Support 2 1207.7 15.19 65.98 141 24/32 1.1565
Support 3 1198.8 15.07 65.03 141 12/32 1.1510
Contract Dec.  Corn #ZC_F Sept. Wheat #ZW_F Nov. Beans #ZS_F Dec. SoyMeal #ZM_F Sept. Nat Gas #NG_F
Resistance 3 391.9 616.0 919.33 339.90 2.94
Resistance 2 389.6 604.5 910.17 337.80 2.88
Resistance 1 385.4 582.5 903.83 335.20 2.85
Pivot 383.1 571.0 894.67 333.10 2.79
Support 1 378.9 549.0 888.3 330.5 2.8
Support 2 376.6 537.5 879.17 328.40 2.71
Support 3 372.4 515.5 872.83 325.80 2.67

Economic Reports, source: 

www.forexfactory.com 

Date 3:59pm Currency Impact Detail Actual Forecast Previous Graph
FriAug 3  2:45am EUR
French Gov Budget Balance
-55.1B
3:15am EUR
Spanish Services PMI
54.4 55.4
3:45am EUR
Italian Services PMI
53.6 54.3
3:50am EUR
French Final Services PMI
55.3 55.3
3:55am EUR
German Final Services PMI
54.4 54.4
4:00am EUR
Final Services PMI
54.4 54.4
EUR
Italian Industrial Production m/m
0.4% 0.7%
4:30am GBP
Services PMI
54.7 55.1
5:00am EUR
Italian Retail Sales m/m
0.1% 0.8%
EUR
Retail Sales m/m
0.4% 0.0%
8:30am USD
Average Hourly Earnings m/m
0.3% 0.2%
USD
Non-Farm Employment Change
191K 213K
USD
Unemployment Rate
3.9% 4.0%
USD
Trade Balance
-46.5B -43.1B
9:45am USD
Final Services PMI
56.2 56.2
10:00am USD
ISM Non-Manufacturing PMI
58.6 59.1

This is not a solicitation of any order to buy or sell, but a current market view provided by Cannon Trading Inc. Any statement of facts here in contained are derived from sources believed to be reliable, but are not guaranteed as to accuracy, nor they purport to be complete. No responsibility is assumed with respect to any such statement or with respect to any expression of opinion herein contained. Readers are urged to exercise their own judgement in trading.
Trading Contest – Support & Resistance Levels 8.2.2018

____________________________________________________________________

Voted #1 Blog and #1 Brokerage Services on TraderPlanet for 2016!!  

____________________________________________________________________

Dear Traders,

Like us on FaceBook!
Get Real Time updates and market alerts on Twitter!
contest logo

Trading Competition

Start: August 19th at 5 PM CT

End: August 31st at 4 PM CT

Prizes (Commission Credits)

First Place: $1,000

Second Place: $500

Third Place: $250

Competition Details

  • All trades will be completed in the GAIN Trader Simulated Trading Environment using the white-labeled Contest Trader application
  • All traders will begin with a virtual account of $100,000. Your goal: increase the balance to as much as possible by the conclusion of the competition
  • Choose to trade from CME Group’s Gold(GGC), Crude Oil(GCL), Corn(ZC), Wheat(ZW), Soybean(ZS) products, and the 10-year treasury note(ZN)
  • Top three traders with the highest P&L balance at the end will get commission credits towards their live account trading post the contest
  • Contestants do not need to have a current live or active account, but the commission credits to the winners will only be credited to live trading on GAIN Capital Futures accounts

Rules/Guidelines

  • This trading completion is limited to non-professional individuals only. Entities and NFA registered persons are not eligible
  • Simulated commission charges set at $5.00 per side inclusive of fees
  • Only 1 demo account is permitted per client for the contest
  • Futures only will be traded
  • Top 10 rankings will be updated prior to the next trading day on https://gainfutures.com/ at close of market, with the winners announced Tuesday September 4, 2018
  • Using the Contest Trader front-end trading application will be mandatory amongst all contestants


24828127 8b10 4845 bf66 9d0405a6dbef


Do you have what it takes?


Good Trading

Trading Futures, Options on Futures, and retail off-exchange foreign currency transactions involves substantial risk of loss and is not suitable for all investors.  You should carefully consider whether trading is suitable for you in light of your circumstances, knowledge, and financial resources. You may lose all or more of your initial investment. Opinions, market data, and recommendations are subject to change at any time.

Futures Trading Levels

08-02-2018


Contract September 2018  SP500 #ES_F Nasdaq100  #NQ_F Dow Jones  #YM_F Mini Russell #RTY_F BitCoin Index #XBT_F
Resistance 3 2841.92 7365.08 25643 1697.23 8039.01
Resistance 2 2833.83 7334.42 25558 1687.27 7906.56
Resistance 1 2821.67 7302.33 25418 1677.53 7728.14
Pivot 2813.58 7271.67 25333 1667.57 7595.69
Support 1 2801.42 7239.58 25193 1657.83 7417.27
Support 2 2793.33 7208.92 25108 1647.87 7284.82
Support 3 2781.17 7176.83 24968 1638.13 7106.40
Contract December Gold #GC_F Sept. Silver #SI-F Sept. Crude Oil #CL-F Sept.  Bonds  #ZB_F Sept.  Euro #6E_F
Resistance 3 1240.4 15.67 69.65 144 17/32 1.1769
Resistance 2 1237.1 15.62 69.09 143 29/32 1.1754
Resistance 1 1231.1 15.51 68.44 143  3/32 1.1726
Pivot 1227.8 15.46 67.88 142 15/32 1.1711
Support 1 1221.8 15.35 67.23 141 21/32 1.1684
Support 2 1218.5 15.30 66.67 141  1/32 1.1669
Support 3 1212.5 15.19 66.02 140  7/32 1.1641
Contract Dec.  Corn #ZC_F Sept. Wheat #ZW_F Nov. Beans #ZS_F Dec. SoyMeal #ZM_F Sept. Nat Gas #NG_F
Resistance 3 394.1 573.5 916.67 346.47 2.82
Resistance 2 390.7 569.8 912.58 343.73 2.80
Resistance 1 385.1 564.0 907.17 339.87 2.78
Pivot 381.7 560.3 903.08 337.13 2.76
Support 1 376.1 554.5 897.7 333.3 2.7
Support 2 372.7 550.8 893.58 330.53 2.73
Support 3 367.1 545.0 888.17 326.67 2.70

Economic Reports, source: 

www.forexfactory.com 

Date 3:38pm Currency Impact Detail Actual Forecast Previous Graph
ThuAug 2  3:00am EUR
Spanish Unemployment Change
-87.6K -90.0K
4:30am GBP
Construction PMI
52.8 53.1
5:00am EUR
PPI m/m
0.3% 0.8%
Tentative EUR
Spanish 10-y Bond Auction
1.31|1.5
Tentative EUR
French 10-y Bond Auction
0.67|1.9
7:00am GBP
BOE Inflation Report
GBP
MPC Official Bank Rate Votes
7-0-2 3-0-6
GBP
Monetary Policy Summary
GBP
Official Bank Rate
0.75% 0.50%
GBP
Asset Purchase Facility
435B 435B
GBP
MPC Asset Purchase Facility Votes
0-0-9 0-0-9
7:30am GBP
BOE Gov Carney Speaks
USD
Challenger Job Cuts y/y
19.6%
8:30am USD
Unemployment Claims
220K 217K
10:00am USD
Factory Orders m/m
0.7% 0.4%
10:30am USD
Natural Gas Storage
39B 24B

This is not a solicitation of any order to buy or sell, but a current market view provided by Cannon Trading Inc. Any statement of facts here in contained are derived from sources believed to be reliable, but are not guaranteed as to accuracy, nor they purport to be complete. No responsibility is assumed with respect to any such statement or with respect to any expression of opinion herein contained. Readers are urged to exercise their own judgement in trading.
First Notice and Last Trading Days for August 8.01.2018

____________________________________________________________________

Voted #1 Blog and #1 Brokerage Services on TraderPlanet for 2016!!  

____________________________________________________________________

Dear Traders,

Like us on FaceBook!
Get Real Time updates and market alerts on Twitter!
Below are the contracts which are entering First Notice or Last Trading Day for the upcoming month.  Be advised, for contracts that are deliverable, it is our policy that all LONG positions be exited the day prior to First Notice Day and ALL positions be exited the day prior to Last Trading Day.  If you have any questions please contact the Trade Desk @ 800-454-9572 or + 1 310 859 9572.  If contracts are carried past that, there may be a liquidation fee, delivery fees and other penalties.
First Notice
Contract Month
Contract
6-Aug
August
Live Cattle
20-Aug
September
ICE Cocoa
23-Aug
September
ICE Coffee
28-Aug
September
London Coffee
30-Aug
September
2-Yr. & 5-Yr. Notes
30-Aug
September
10-Yr. Notes & 30-Yr. Bonds
30-Aug
September
Long Gilt (Liffe)
31-Aug
September
COMEX & ICE Metals
31-Aug
September
Wheat (CBOT, KC, MN)
31-Aug
September
CBOT Corn & Oats
31-Aug
September
CBOT Soybeans
31-Aug
September
CBOT Soybean Meal & Oil
31-Aug
September
CBOT Rice
Last Trading Day
Contract Month
Contract
13-Aug-18
August
CME Eurodollar
14-Aug-18
August
Lean Hogs
14-Aug-18
August
CBOT Soybeans
14-Aug-18
August
CBOT Soybean Meal & Oil
21-Aug-18
September
NYMEX Crude Oil
28-Aug-18
August
Milk III & Butter
29-Aug-18
August
COMEX & ICE Metals
29-Aug-18
September
NYMEX Natural Gas
30-Aug-18
August
Feeder Cattle
31-Aug-18
August
30-Day Fed Funds
31-Aug-18
September
NYMEX RBOB & Heating Oil
31-Aug-18
October
ICE Brent Crude Oil
31-Aug-18
August
Live Cattle


Good Trading

Trading Futures, Options on Futures, and retail off-exchange foreign currency transactions involves substantial risk of loss and is not suitable for all investors.  You should carefully consider whether trading is suitable for you in light of your circumstances, knowledge, and financial resources. You may lose all or more of your initial investment. Opinions, market data, and recommendations are subject to change at any time.

Futures Trading Levels

08-01-2018


Contract September 2018  SP500 #ES_F Nasdaq100  #NQ_F Dow Jones  #YM_F Mini Russell #RTY_F BitCoin Index #XBT_F
Resistance 3 2852.33 7391.08 25690 1712.83 8576.68
Resistance 2 2838.67 7337.67 25576 1696.27 8381.76
Resistance 1 2830.08 7296.08 25499 1686.43 8053.14
Pivot 2816.42 7242.67 25385 1669.87 7858.22
Support 1 2807.83 7201.08 25308 1660.03 7529.60
Support 2 2794.17 7147.67 25194 1643.47 7334.68
Support 3 2785.58 7106.08 25117 1633.63 7006.06
Contract August Gold #GC_F Sept. Silver #SI-F Sept. Crude Oil #CL-F Sept.  Bonds  #ZB_F Sept.  Euro #6E_F
Resistance 3 1255.3 15.93 71.55 144  2/32 1.1833
Resistance 2 1246.5 15.78 70.89 143 25/32 1.1812
Resistance 1 1240.1 15.67 69.81 143 13/32 1.1773
Pivot 1231.3 15.53 69.15 143  4/32 1.1751
Support 1 1224.9 15.42 68.07 142 24/32 1.1712
Support 2 1216.1 15.27 67.41 142 15/32 1.1691
Support 3 1209.7 15.16 66.33 142  3/32 1.1652
Contract Dec.  Corn #ZC_F Sept. Wheat #ZW_F Nov. Beans #ZS_F Dec. SoyMeal #ZM_F Sept. Nat Gas #NG_F
Resistance 3 395.2 584.8 945.08 355.87 2.88
Resistance 2 391.8 574.9 933.67 349.53 2.85
Resistance 1 389.2 564.3 926.33 345.47 2.82
Pivot 385.8 554.4 914.92 339.13 2.79
Support 1 383.2 543.8 907.6 335.1 2.8
Support 2 379.8 533.9 896.17 328.73 2.74
Support 3 377.2 523.3 888.83 324.67 2.70

Economic Reports, source: 

www.forexfactory.com 


Date 4:26pm Currency Impact Detail Actual Forecast Previous Graph
WedAug 1 2:00am GBP
Nationwide HPI m/m
0.1% 0.5%
3:15am EUR
Spanish Manufacturing PMI
53.1 53.4
3:45am EUR
Italian Manufacturing PMI
53.0 53.3
3:50am EUR
French Final Manufacturing PMI
53.1 53.1
3:55am EUR
German Final Manufacturing PMI
57.3 57.3
4:00am EUR
Final Manufacturing PMI
55.1 55.1
4:30am GBP
Manufacturing PMI
54.2 54.4
Tentative EUR
German 10-y Bond Auction
0.36|1.6
8:15am USD
ADP Non-Farm Employment Change
186K 177K
9:45am USD
Final Manufacturing PMI
55.5 55.5
10:00am USD
ISM Manufacturing PMI
59.4 60.2
USD
Construction Spending m/m
0.3% 0.4%
USD
ISM Manufacturing Prices
75.5 76.8
10:30am USD
Crude Oil Inventories
-2.6M -6.1M
All Day USD
Total Vehicle Sales
17.1M 17.5M
2:00pm USD
FOMC Statement
USD
Federal Funds Rate
<2.00% <2.00%


This is not a solicitation of any order to buy or sell, but a current market view provided by Cannon Trading Inc. Any statement of facts here in contained are derived from sources believed to be reliable, but are not guaranteed as to accuracy, nor they purport to be complete. No responsibility is assumed with respect to any such statement or with respect to any expression of opinion herein contained. Readers are urged to exercise their own judgement in trading.

Using Range Bars for Day Trading – Support & Resistance Levels 7.27.2018

____________________________________________________________________

Voted #1 Blog and #1 Brokerage Services on TraderPlanet for 2016!!  

____________________________________________________________________

Dear Traders,

Like us on FaceBook!
Get Real Time updates and market alerts on Twitter!
I have mentioned before that I like range bar charts and volume charts better than time charts for day trading.
The main reason is that when you are using time charts, lets say 3 minute bars, you have to wait for the bar to close in order to confirm your signals. In today’s market environment there are times when 3 minutes can translate for big $$ against you or in your favor…
( like today right at the cash close 3 PM CDT, Amazon Earnings came out and sent the NQ futures up and down almost 70 points in minutes!!)
Range bar charts and volume charts will complete FAST when the market is moving and will take much longer to build when the market is dead ( hence helps filter out some of the noise in my opinion).
I shared more on this topic in a video that while it focuses on crude oil as an example, the concept can be used for many other markets.
Check out the video at ( it is the 3rd video on the list):


Good Trading

Trading Futures, Options on Futures, and retail off-exchange foreign currency transactions involves substantial risk of loss and is not suitable for all investors.  You should carefully consider whether trading is suitable for you in light of your circumstances, knowledge, and financial resources. You may lose all or more of your initial investment. Opinions, market data, and recommendations are subject to change at any time.

Futures Trading Levels

07-27-2018


Contract September 2018  SP500 #ES_F Nasdaq100  #NQ_F Dow Jones  #YM_F Mini Russell #RTY_F BitCoin Index #XBT_F
Resistance 3 2861.33 7554.00 25776 1729.70 8489.44
Resistance 2 2853.92 7502.00 25672 1718.70 8400.33
Resistance 1 2848.08 7466.00 25600 1709.50 8334.09
Pivot 2840.67 7414.00 25496 1698.50 8244.98
Support 1 2834.83 7378.00 25424 1689.30 8178.74
Support 2 2827.42 7326.00 25320 1678.30 8089.63
Support 3 2821.58 7290.00 25248 1669.10 8023.39
Contract August Gold #GC_F Sept. Silver #SI-F Sept. Crude Oil #CL-F Sept.  Bonds  #ZB_F Sept.  Euro #6E_F
Resistance 3 1244.8 15.92 71.07 143 19/32 1.1862
Resistance 2 1240.1 15.81 70.50 143 14/32 1.1825
Resistance 1 1231.2 15.62 70.07 143  1/32 1.1757
Pivot 1226.5 15.51 69.50 142 28/32 1.1720
Support 1 1217.6 15.32 69.07 142 15/32 1.1652
Support 2 1212.9 15.21 68.50 142 10/32 1.1615
Support 3 1204.0 15.02 68.07 141 29/32 1.1547
Contract Dec.  Corn #ZC_F Sept. Wheat #ZW_F Nov. Beans #ZS_F Dec. SoyMeal #ZM_F Sept. Nat Gas #NG_F
Resistance 3 384.0 571.3 910.67 342.00 2.80
Resistance 2 381.8 562.5 903.33 339.30 2.79
Resistance 1 378.8 549.5 889.67 335.50 2.77
Pivot 376.5 540.8 882.33 332.80 2.76
Support 1 373.5 527.8 868.7 329.0 2.7
Support 2 371.3 519.0 861.33 326.30 2.73
Support 3 368.3 506.0 847.67 322.50 2.71

Economic Reports, source: 

http://app.bettertrader.co 


f1b66da5 7e05 4d46 8d90 dabc99a41c19


This is not a solicitation of any order to buy or sell, but a current market view provided by Cannon Trading Inc. Any statement of facts here in contained are derived from sources believed to be reliable, but are not guaranteed as to accuracy, nor they purport to be complete. No responsibility is assumed with respect to any such statement or with respect to any expression of opinion herein contained. Readers are urged to exercise their own judgement in trading.

Support & Resistance Levels 7.26.2018

____________________________________________________________________

Voted #1 Blog and #1 Brokerage Services on TraderPlanet for 2016!!  

____________________________________________________________________

Dear Traders,

Like us on FaceBook!
Get Real Time updates and market alerts on Twitter!
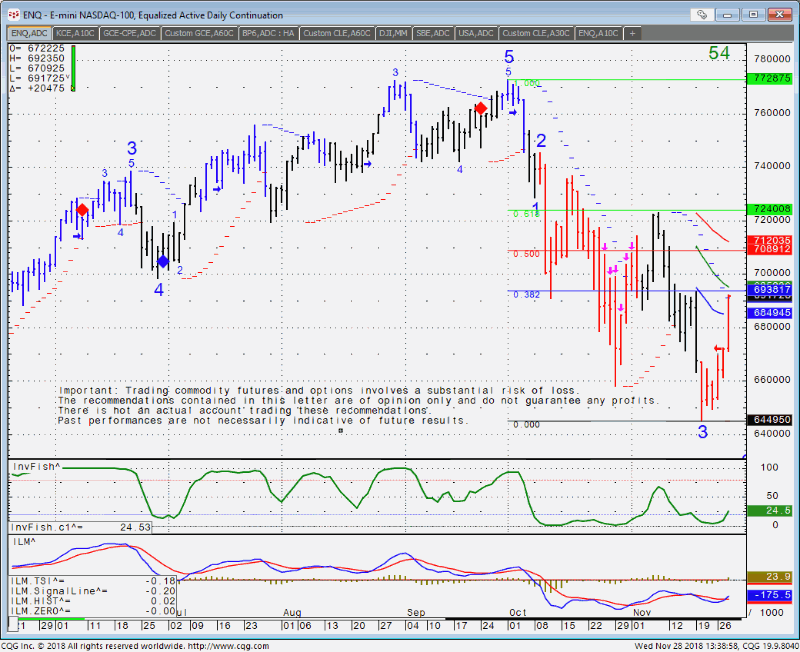
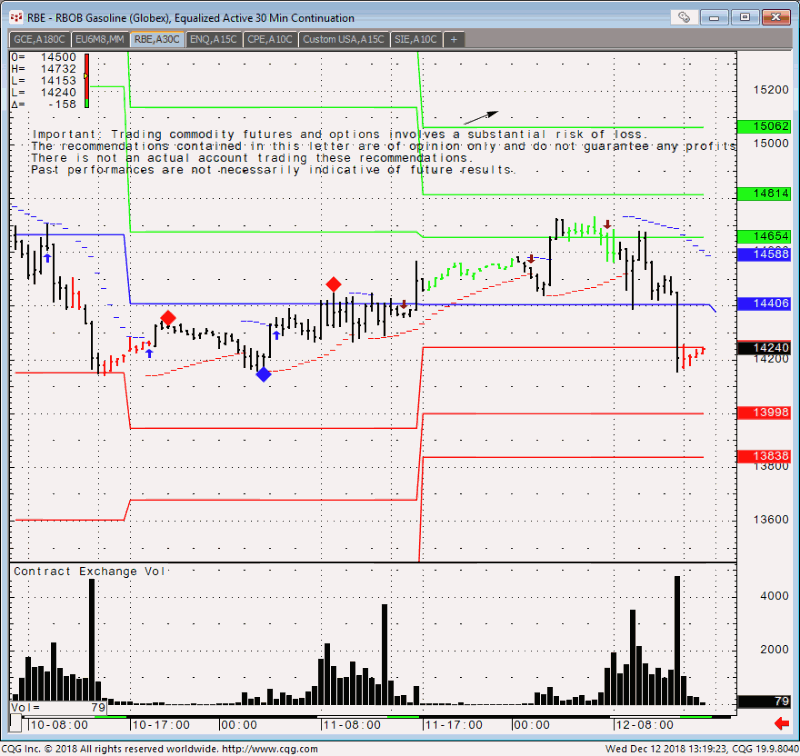
Take a look at the mini NASDAQ chart…wow….Also below the chart, if you are NOT yet a Cannon client, see if you can improve your rates.
5ebd8139 b0ab 443e 8baf 6f8c3ca00806
If you are a not a Cannon client yet, we can lower your commission rates in less than 7 minutes.
Want to learn more and see if you qualify, please talk to one our Cannon Trading brokers. Call us now at (800) 454-9572.
Competitive Pricing with a Premium Service

Before contacting the discount futures brokers and opening an account, ask yourself the following: “What am I getting myself into?” Am I about to “get what I paid for?” Does your broker call you before taking you out of a position at the market close, or do they just go ahead and pull the trigger? Will they take the time to walk you through simple/complex brackets, trailing stops, iceberg orders, or GTC’s? Will they help you set up your charts and indicators? After all, you deserve GOOD SERVICE!

Cannon has multiple arrangements with different clearing firms, allowing us to “shop on your behalf” when it comes to high volume/large traders/ institutional accounts/ high frequency traders.

We can provide you with some of the LOWEST rates in the industry. Call us at +310-859-9572 or simply fill out this form.


Good Trading

Trading Futures, Options on Futures, and retail off-exchange foreign currency transactions involves substantial risk of loss and is not suitable for all investors.  You should carefully consider whether trading is suitable for you in light of your circumstances, knowledge, and financial resources. You may lose all or more of your initial investment. Opinions, market data, and recommendations are subject to change at any time.

Futures Trading Levels

07-26-2018


Contract September 2018  SP500 #ES_F Nasdaq100  #NQ_F Dow Jones  #YM_F Mini Russell #RTY_F BitCoin Index #XBT_F
Resistance 3 2893.00 7677.17 25881 1711.50 8807.91
Resistance 2 2871.25 7603.58 25655 1701.20 8642.12
Resistance 1 2857.50 7544.17 25539 1695.40 8391.19
Pivot 2835.75 7470.58 25313 1685.10 8225.40
Support 1 2822.00 7411.17 25197 1679.30 7974.47
Support 2 2800.25 7337.58 24971 1669.00 7808.68
Support 3 2786.50 7278.17 24855 1663.20 7557.75
Contract August Gold #GC_F Sept. Silver #SI-F Sept. Crude Oil #CL-F Sept.  Bonds  #ZB_F Sept.  Euro #6E_F
Resistance 3 1247.6 15.89 71.43 143 16/32 1.1883
Resistance 2 1240.9 15.77 70.57 143 18/32 1.1834
Resistance 1 1236.5 15.71 69.93 143  4/32 1.1807
Pivot 1229.8 15.59 69.07 143  6/32 1.1758
Support 1 1225.4 15.52 68.43 142 24/32 1.1731
Support 2 1218.7 15.40 67.57 142 26/32 1.1682
Support 3 1214.3 15.34 66.93 142 12/32 1.1655
Contract Dec.  Corn #ZC_F Sept. Wheat #ZW_F Nov. Beans #ZS_F Dec. SoyMeal #ZM_F Sept. Nat Gas #NG_F
Resistance 3 380.5 573.6 887.17 334.40 2.81
Resistance 2 377.3 559.4 882.58 331.90 2.79
Resistance 1 375.3 551.1 879.17 330.20 2.77
Pivot 372.0 536.9 874.58 327.70 2.75
Support 1 370.0 528.6 871.2 326.0 2.7
Support 2 366.8 514.4 866.58 323.50 2.71
Support 3 364.8 506.1 863.17 321.80 2.69

Economic Reports, source: 

http://app.bettertrader.co 


64f9189b 7051 4941 91bc 3331162a6326


This is not a solicitation of any order to buy or sell, but a current market view provided by Cannon Trading Inc. Any statement of facts here in contained are derived from sources believed to be reliable, but are not guaranteed as to accuracy, nor they purport to be complete. No responsibility is assumed with respect to any such statement or with respect to any expression of opinion herein contained. Readers are urged to exercise their own judgement in trading.