Using Range Bar and Volume Charts for Scalping 7-20-2016

Connect with Us! Use Our Futures Trading Levels and Economic Reports RSS Feed.

Like us on FacebookFollow us on TwitterView our profile on LinkedInFind us on Google+Cannon Trading Futures Trading Resistance & Support Levels and Economic ReportsFind us on Yelp

1. Market Commentary
2. Futures Support and Resistance Levels – S&P, Nasdaq, Dow Jones, Russell 2000, Dollar Index
3. Commodities Support and Resistance Levels – Gold, Euro, Crude Oil, T-Bonds
4. Commodities Support and Resistance Levels – Corn, Wheat, Beans, Silver
5. Futures Economic Reports for Wedneday July 20, 2016

Hello Traders,

Why I Like to Use Tick and Volume Charts for Scalping

Today, I decided to touch more on an educational feature rather than provide a certain market outlook.

Many of my clients and blog readers know that when it comes to short-term trading I am a fan of using volume charts, tick charts, range bar charts and Renko charts rather than the traditional time charts like the 1 minutes, 5 minutes etc.

My rule of thumb is that if you as a trader who makes decisions based on charts that are less than 15 minutes time frame, it may be worth your time to research, back test and do some homework as to potentially using other type of charts like volume charts, Range charts etc.

Volume charts will draw a new bar once a user defined number of contracts traded. An example is the mini SP 10,000 volume chart which will draw a new bar once 10,000 contracts are traded.

Range bar charts will draw new charts once price action has exceeded a user’s pre-defined price or ticks range. An example might be an 18 ticks range bar chart on crude oil.

While volume charts rely ONLY on volume, the range bar charts rely ONLY on price action.

Their main advantage over traditional time charts is twofold in my opinion:

If the market is moving fast, reports have come out or there is heavy volume in the market, the traditional 5 minute chart will need 5 minutes to complete the next bar before it provides you with a signal…if you have day traded futures before you know what 5 minutes can do to these markets….The volume charts or range bar charts in this case will complete the bars MUCH faster because there is strong price action and strong volume and will be able to provide a signal faster than the time charts. Continue reading “Using Range Bar and Volume Charts for Scalping 7-20-2016”

SP chart +Support and resistance levels for 7.19.2016

Connect with Us! Use Our Futures Trading Levels and Economic Reports RSS Feed.

Like us on FacebookFollow us on TwitterView our profile on LinkedInFind us on Google+Cannon Trading Futures Trading Resistance & Support Levels and Economic ReportsFind us on Yelp

1. Market Commentary
2. Futures Support and Resistance Levels – S&P, Nasdaq, Dow Jones, Russell 2000, Dollar Index
3. Commodities Support and Resistance Levels – Gold, Euro, Crude Oil, T-Bonds
4. Commodities Support and Resistance Levels – Corn, Wheat, Beans, Silver
5. Futures Economic Reports for Tuesday July 19, 2016

Hello Traders,

It is Earnings season. If you are a stock index trader, make sure you know which important earnings are coming out and when.

Visit this page, scroll down to bottom to see today’s earnings:

http://www.reuters.com/finance/EarningsUS

On a different note, it feels like somewhat of “Summer Trading” – Low energy and lower “speed” in the markets. I would have expected to see much more volatility after the news from Turkey but the market for now has not paid much attention. Volume was relatively low today and the range of moves was relatively tight.

Looking at the mini SP 500 chart along with volume as markets make new highs leads me to believe it is somewhat artificial….but then again it is not wise to argue with price action  and I would rather get a signal correction is starting than trying to predict the correction.

 Mini SP 500 Chart

Continue reading “SP chart +Support and resistance levels for 7.19.2016”

Options Webinar + Levels for Tomorrow 7.12.2016

Connect with Us! Use Our Futures Trading Levels and Economic Reports RSS Feed.

Like us on FacebookFollow us on TwitterView our profile on LinkedInFind us on Google+Cannon Trading Futures Trading Resistance & Support Levels and Economic ReportsFind us on Yelp

1. Market Commentary
2. Futures Support and Resistance Levels – S&P, Nasdaq, Dow Jones, Russell 2000, Dollar Index
3. Commodities Support and Resistance Levels – Gold, Euro, Crude Oil, T-Bonds
4. Commodities Support and Resistance Levels – Corn, Wheat, Beans, Silver
5. Futures Economic Reports for Tuesday July 12, 2016

Hello Traders,

Options 101: Adding Options as a Weapon in Your Trading Arsenal

Join us for a webinar on Jul 12, 2016 at 1:00 PM PDT.

Register now!

Options on futures can be used in many different ways and as a trader you need to be aware of all the tools you can use!

Join us for a 45 -minute webinar on July 12th at 3:00 P.M., Central Time.
During this presentation, John Thorpe, Senior Broker with Cannon Trading and an ex floor trader will share with you :

  • Difference between Futures and Futures Options
  • Option as an Insurance product
  • Two components that make up the value of an option.
    a. Time Value
    b. Intrinsic value
  • Buying Options
  • Selling Options
  • Examples of Option Strategy recommendations

And much more…

This Webinar is intended for Traders with no options experience to the beginning student of options on futures, this Webinar is intended to be the first of two Webinars ending with Advanced Option Strategies.

SEATS ARE LIMITED, SO DON’T MISS THIS SPECIAL FREE WEBINAR!

Risk: Trading Futures, Options on Futures, and retail off-exchange foreign currency transactions involves substantial risk of loss and is not suitable for all investors. You should carefully consider whether trading is suitable for you in light of your circumstances, knowledge, and financial resources. You may lose all or more of your initial investment. Opinions, market data, and recommendations are subject to change at any time

After registering, you will receive a confirmation email containing information about joining the webinar.

View System Requirements

Continue reading “Options Webinar + Levels for Tomorrow 7.12.2016”

Gold Chart for Review + Levels for Tomorrow 7.07.2016

Connect with Us! Use Our Futures Trading Levels and Economic Reports RSS Feed.

Like us on FacebookFollow us on TwitterView our profile on LinkedInFind us on Google+Cannon Trading Futures Trading Resistance & Support Levels and Economic ReportsFind us on Yelp

1. Market Commentary
2. Futures Support and Resistance Levels – S&P, Nasdaq, Dow Jones, Russell 2000, Dollar Index
3. Commodities Support and Resistance Levels – Gold, Euro, Crude Oil, T-Bonds
4. Commodities Support and Resistance Levels – Corn, Wheat, Beans, Silver
5. Futures Economic Reports for Thursday July 7, 2016

Hello Traders,

Options 101: Adding Options as a Weapon in Your Trading Arsenal

Join us for a webinar on Jul 12, 2016 at 1:00 PM PDT.

Register now!

Options on futures can be used in many different ways and as a trader you need to be aware of all the tools you can use!

Join us for a 45 -minute webinar on July 12th at 3:00 P.M., Central Time.
During this presentation, John Thorpe, Senior Broker with Cannon Trading and an ex floor trader will share with you :

* Difference between Futures and Futures Options
* Option as an Insurance product
* Two components that make up the value of an option.
a. Time Value
b. Intrinsic value
* Buying Options
*Selling Options
* Examples of Option Strategy recommendations

And much more…

This Webinar is intended for Traders with no options experience to the beginning student of options on futures, this Webinar is intended to be the first of two Webinars ending with Advanced Option Strategies.

SEATS ARE LIMITED, SO DON’T MISS THIS SPECIAL FREE WEBINAR!

Risk: Trading Futures, Options on Futures, and retail off-exchange foreign currency transactions involves substantial risk of loss and is not suitable for all investors. You should carefully consider whether trading is suitable for you in light of your circumstances, knowledge, and financial resources. You may lose all or more of your initial investment. Opinions, market data, and recommendations are subject to change at any time

After registering, you will receive a confirmation email containing information about joining the webinar.

View System Requirements

Continue reading “Gold Chart for Review + Levels for Tomorrow 7.07.2016”

Gold Chart for Review 7.06.2016

Connect with Us! Use Our Futures Trading Levels and Economic Reports RSS Feed.

Like us on FacebookFollow us on TwitterView our profile on LinkedInFind us on Google+Cannon Trading Futures Trading Resistance & Support Levels and Economic ReportsFind us on Yelp

1. Market Commentary
2. Futures Support and Resistance Levels – S&P, Nasdaq, Dow Jones, Russell 2000, Dollar Index
3. Commodities Support and Resistance Levels – Gold, Euro, Crude Oil, T-Bonds
4. Commodities Support and Resistance Levels – Corn, Wheat, Beans, Silver
5. Futures Economic Reports for Wednesday July 6, 2016

Hello Traders,

We got both ECB Draghi speaking tomorrow morning as well as FOMC minutes later in the day. Could turn out to be a volatile trading day.

There are a few factors you can control as a day trader:

How many contracts you trade per ticket?

How many markets you trade at any given time?

What is your ( hopefully ) self imposed risk per trade? per day?

These factors should be adjusted as your trading capital change, as volatility increases/ decreases and according to your performance.

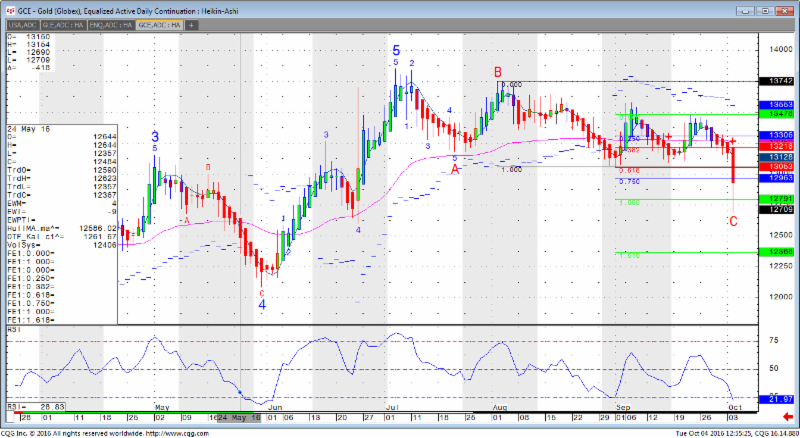
Gold chart for your review below:

Gold Chart

Continue reading “Gold Chart for Review 7.06.2016”

4th of July Futures Trading Schedule 7.01.2016

Connect with Us! Use Our Futures Trading Levels and Economic Reports RSS Feed.

Like us on FacebookFollow us on TwitterView our profile on LinkedInFind us on Google+Cannon Trading Futures Trading Resistance & Support Levels and Economic ReportsFind us on Yelp

1. Market Commentary
2. Futures Support and Resistance Levels – S&P, Nasdaq, Dow Jones, Russell 2000, Dollar Index
3. Commodities Support and Resistance Levels – Gold, Euro, Crude Oil, T-Bonds
4. Commodities Support and Resistance Levels – Corn, Wheat, Beans, Silver
5. Futures Economic Reports for Friday July 1, 2016

Hello Traders,

4th of July Trading Schedule:

Please have a Safe and Happy Holiday!!

From the CME Globex Control Center, here is the summary of KEY changes, per CME market segment –

Friday – ALL REGULAR closes

Sunday night – NORMAL OPEN times for all markets, EXCEPT grains and meats = remain closed.

Monday – ALL open markets go into HALT at 12:00 noon

– (except grains and meats = stay closed)

Monday night – NORMAL OPEN times – (except grains and meats = stay closed)

Tuesday morning – grains and meats pre-open 6:00 am, OPEN at 8:30 am

Independence Day Holiday Schedule 2016

Continue reading “4th of July Futures Trading Schedule 7.01.2016”

Globex & ICE ® Independence Day Holiday Trading Schedule 2016

Independence Day Holiday Schedule for CME / Globex and ICE Exchanges

*Note: Session orders entered on Sunday are for trade date Tuesday, July 5 and will continue working until Tuesday’s close unless otherwise noted.

Equity, Interest Rate, FX, Energy, Metals & DME Products

Friday, July 1

1600 CT / 1700 ET / 2100 UTC – Regular close

Sunday, July 3

1700 CT / 1800 ET / 2200 UTC – Regular open for trade date Tuesday, July 5

Monday, July 4

1200 CT / 1300 ET / 1700 UTC – Trading halt (pre-open)

1700 CT / 1800 ET / 2200 UTC – Products resume trading

Tuesday, July 5

1600 CT / 1700 ET / 2200 UTC – Regular close

Grain, Oilseed & MGEX Products

Friday, July 1

Regular close – Per each product schedule

Tuesday, July 5

0700 CT / 0800 ET / 1200 UTC – MGEX Apple Juice – Regular open Continue reading “Globex & ICE ® Independence Day Holiday Trading Schedule 2016”