What to Watch for After a Fed Rate Cut: Market Reactions, Opportunities, and Risks

Get Real Time updates and more by joining our Private Facebook Group! Subscribe to our YouTube Channel Listen to our Market Recap Podcasts on Apple Podcasts
C79

What to look out for after a FED rate cut

September 23, 2024 by GalTrades.com Powel said at the Jackson hole meeting, “The time has come for policy to adjust,” The direction of travel is clear, and the timing and pace of rate cuts will depend on incoming data, the evolving outlook and the balance of risks.” It didn’t matter if we got a .25 or .50 basis point rate cut, earnings growth will determine if the market can keep going up. The market made new all-time highs, but only one MAG7 stock made new all-time high, META. That means the rally is broadening, a positive point for the market. The S&P is currently trading at a forward P/E of 21 which suggests that a lot has been priced regarding the bull thesis. Valuations are high and that should be noted. How much higher can the market go up? remains to be seen. “don’t fight the Fed” or “don’t fight the trend” are statements to sustain near-term bullish momentum. Aside from the FED cutting rates, the economy still appears to be on firm footing. Next week the earnings and economic calendar is relatively light, outside of next Friday’s PCE report, but perhaps this can be conducive for recent bullish momentum. In the absence of news, the path of least resistance is higher. Yes, we are still in the midst of bearish seasonality, but the technicals look encouraging. Going forward bad news is good news because the FED will need to lower rates on bad news, unless the news is disastrous. As long as the SPX can remain above July’s prior all-time closing high 5,667, we should see continuation. An SPX close below 5,667 could introduce concerns of a false breakout to all-time highs, which would likely introduce some additional selling pressure A positive point: 76% of the S&P 500 stocks are above there 50 Day Moving Averages and 76% are above their 200 Day MA. Year to date the two top performing factors were momentum and growth which were up 29/27 % respectively. The two worst preforming groups were yield and value stocks. In the last 3 month that flipped. Dividend and value stocks get an uptick when rates come down. I see analysts calling for the small caps to go up with rate cuts. The action on Wednesday didn’t show that. It may be wise to react as opposed to jumping in now. It would make more sense for mid-caps to go up prior to small caps as there are more profitable companies in mid-cap sectors. Statistics show post-election the markets usually end higher. And in the past when the FED has cut rates in a soft landing, or no landing markets ended up higher for the next 6 to 12 months almost 100% of the time. Cyclical, mortgage, auto loan rates and small cap stand to benefit from rate cuts. Rate cuts can ignite small caps and value stocks. The IJR index contains a higher % of companies which are profitable as opposed to the IWM Russell 2000. Bull market indicators usually benefit capital market plays, stocks such as; CBOE, IBKR, BLK, GS. Rate cuts should help the homebuilders XHB ETF. If Fed rate cuts can bring short-end bond yields down to more normal rates, then banks wouldn’t have to overcompensate at the long end and longer-term loans like mortgages could come down. That would put more money in the pockets of everyday Americans and help fuel all sectors of the stock market — not to mention the benefit lower rates have on valuations. Commodities and oil prices are down, rates are coming down. That’s all good for companies and the consumer.   Energy companies as opposed to the price of oil. historically this sector has been one of the best sectors going into a rate cut. What we didn’t have in the past is a slowdown in China, that narrative should put a lid on appreciation. There may be some individual names that are exceptions. FINISH ARTICLE HERE
stars
  c526dc71 5be3 43b9 a4b3 7a907d25e102  

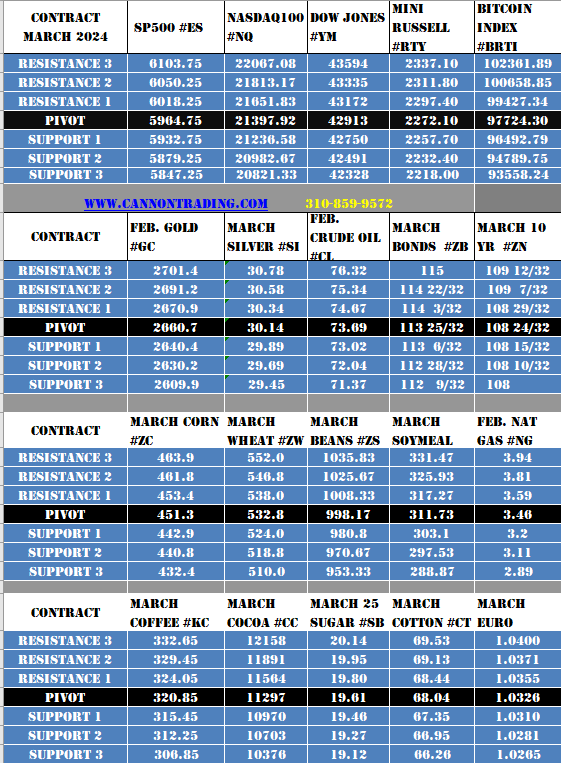
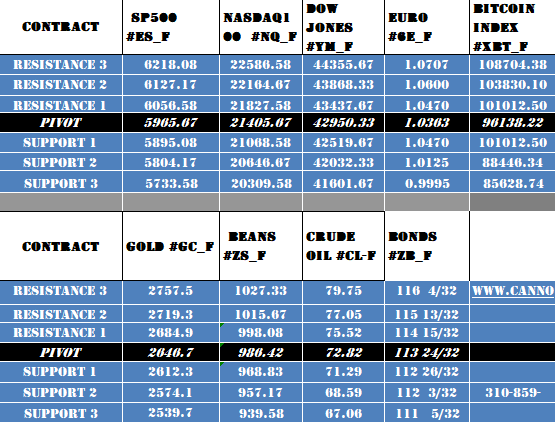
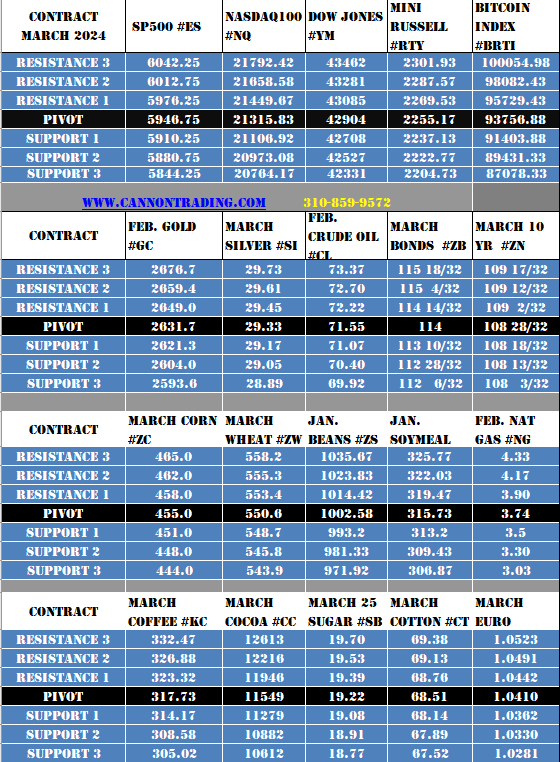
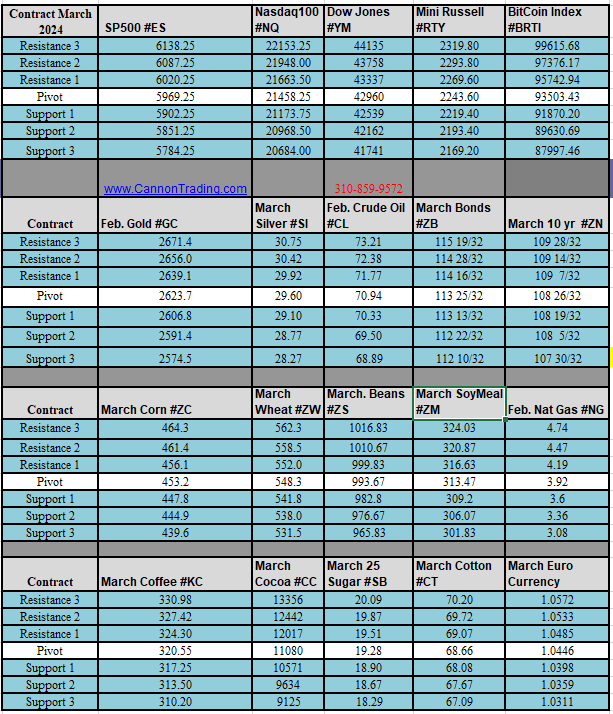
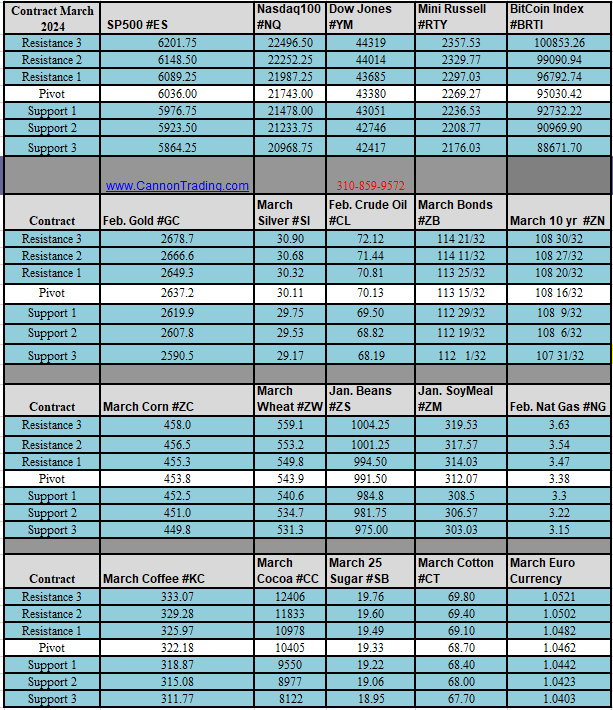
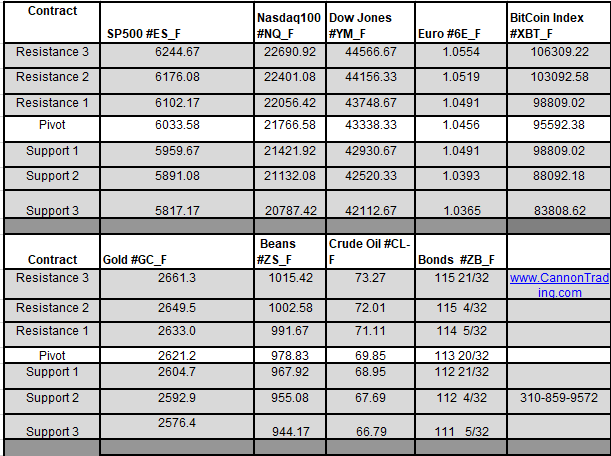
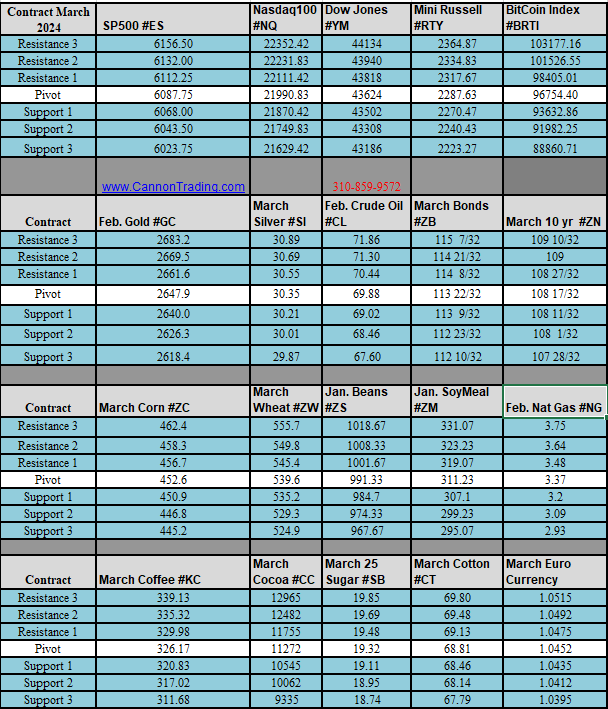
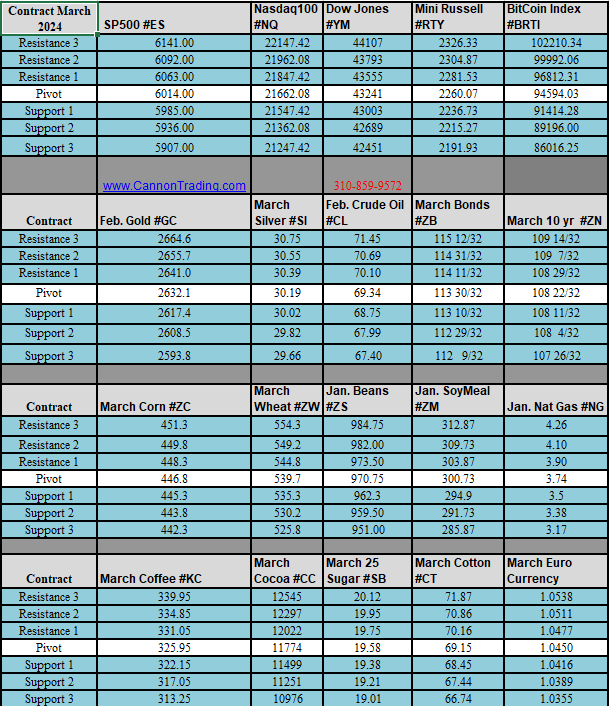
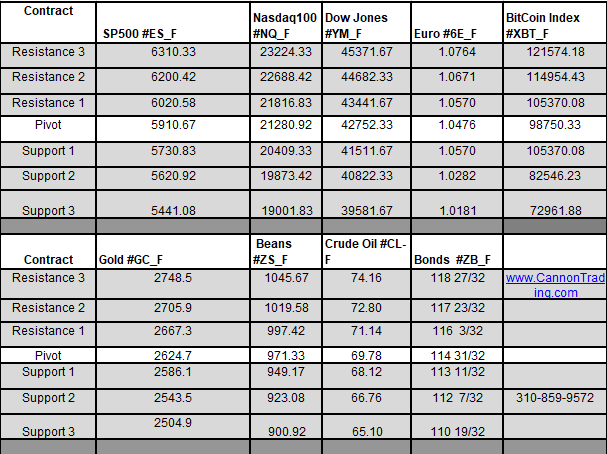
Daily Levels for September 23, 2024

4d2695a3 014e 4935 a3b8 4639078d935a
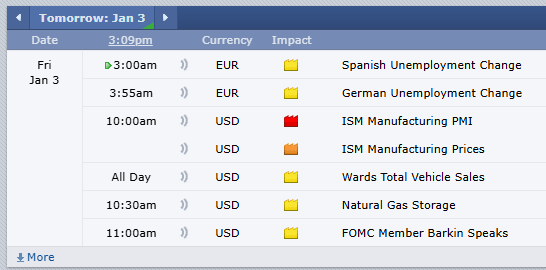
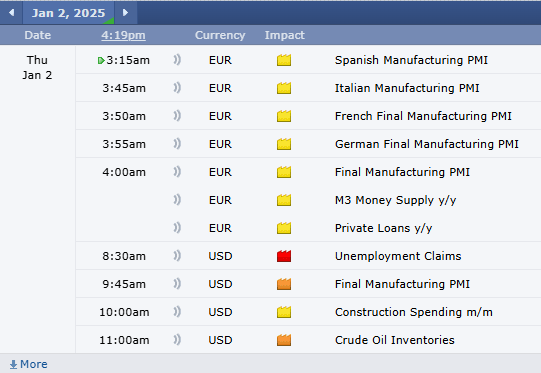
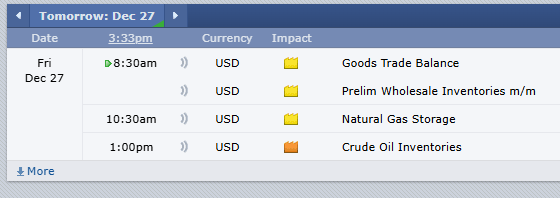
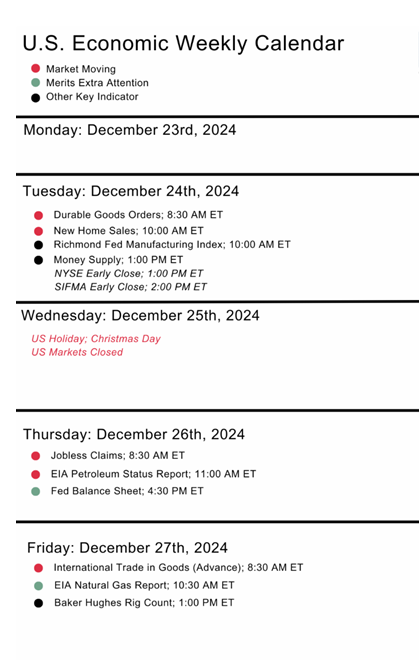
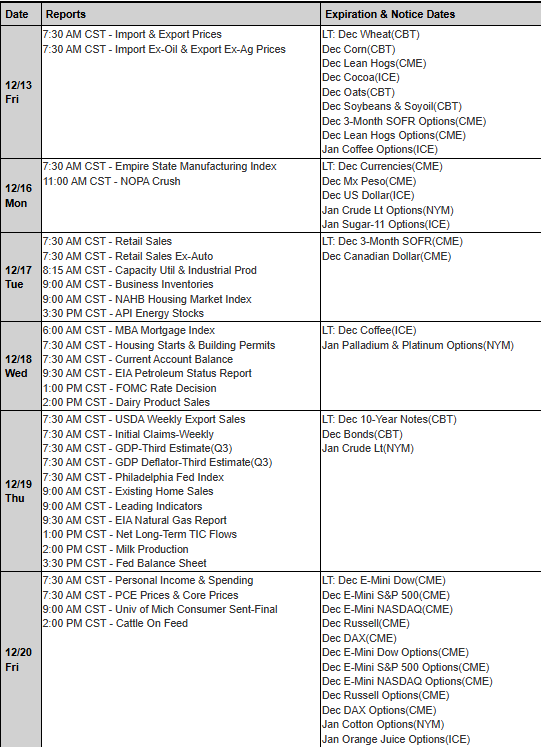
  Economic Reports provided by: ForexFactory.com All times are Eastern Time ( New York)
350aad2c 3117 4fe0 9ca5 a4cbd69d892c

Improve Your Trading Skills

Get access to proprietary indicators and trading methods, consult with an experienced broker at 1-800-454-9572. Explore trading methods. Register Here
3b644da2 2bee 4d39 8d98 5208a20bec39
* This is not a solicitation of any order to buy or sell, but a current market view provided by Cannon Trading Inc. Any statement of facts here in contained are derived from sources believed to be reliable, but are not guaranteed as to accuracy, nor they purport to be complete. No responsibility is assumed with respect to any such statement or with respect to any expression of opinion herein contained. Readers are urged to exercise their own judgement in trading.

Weekly Newsletter: Learn about Tick Size, Copper System, Sugar Chart + Trading Levels for Sept. 23rd

Get Real Time updates and more by joining our Private Facebook Group!
Subscribe to our YouTube Channel

C93

Cannon Futures Weekly Letter Issue # 1209

In this issue:

  • Important Notices – Heavy Fed Speaking, Active Data, Few Earnings
  • Futures 101 – Tick Size & Minimum Fluctuations
  • Hot Market of the Week – March Sugar
  • Broker’s Trading System of the Week – Copper Swing Trading System
  • Trading Levels for Next Week
  • Trading Reports for Next Week


Important Notices – Next Week Highlights:


The Week Ahead

Heavy Fed Speak Week, active data and a few earnings highlight the week ahead.


Light Earnings, by largest Market Cap

  • Wed, Micron Technologies After the close
  • Thursday, Accenture pre-open, Costco after the close


Fed Speak schedule

  • Mon. Goolsbee 9:15am CDT, Kashkari Noon CDT
  • Tues. Bowman 8:00am CDT
  • Wed. Kugler 3:00pm CDT
  • Thu. Collins 8:10amCDT, Powell 8:20am CDT, Williams 8:25 CDT, Treasury Sec. Yellen 10:15am CDT


Big Economic Data week:

  • Mon. S&P PMI Flash
  • Tues. Case-Shiller Home prices, CB Consumer Confidence, Redbook, Richmond Fed.
  • Wed. Building Permits, New Home Sales
  • Thur. Jobless Claims, Core PCE Final, GDP Final, Durable goods, Pending Home sales
  • Fri. Personal Income, Retail and Wholesale Inventories, Michigan consumer sentiment


How to Rollover on the E-Futures Platform video below

thumbnail?url=https%3A%2F%2Fi.vimeocdn


  • Futures 101: Tick Movements: Understanding How They Work

    Minimum Price Fluctuation

    All futures contracts have a minimum price fluctuation also known as a tick. Tick sizes are set by the exchange and vary by contract instrument.

    E-min S&P 500 tick

    For example, the tick size of an E-Mini S&P 500 Futures Contract is equal to one quarter of an index point. Since an index point is valued at $50 for the E-Mini S&P 500, a movement of one tick would be

    .25 x $50 = $12.50

    NYMEX WTI Crude Oil

    The tick size of the NYMEX WTI Crude Oil contract is equal to 1 cent and the WTI contract size is 1,000 barrels. Therefore, the value of a one tick move is $10.

    Summary

    Tick sizes are defined by the exchange and vary depending on the size of the financial instrument and requirements of the marketplace. Tick sizes are set to provide optimal liquidity and tight bid-ask spreads.

    The minimum price fluctuation for any CME Group contract can be found on the product specification pages.


stars

3b644da2 2bee 4d39 8d98 5208a20bec39


    • Hot Market of the Week – December Gold

    Hot market of the week is provided by QT Market Center, A Swiss army knife charting package that’s not just for Hedgers, Cooperatives and Farmers alike but also for Spread traders, Swing traders and shorter time frame application for intraday traders with a unique proprietary indicator that can be applied to your specific trading needs.

    FREE TRIAL AVAILABLE

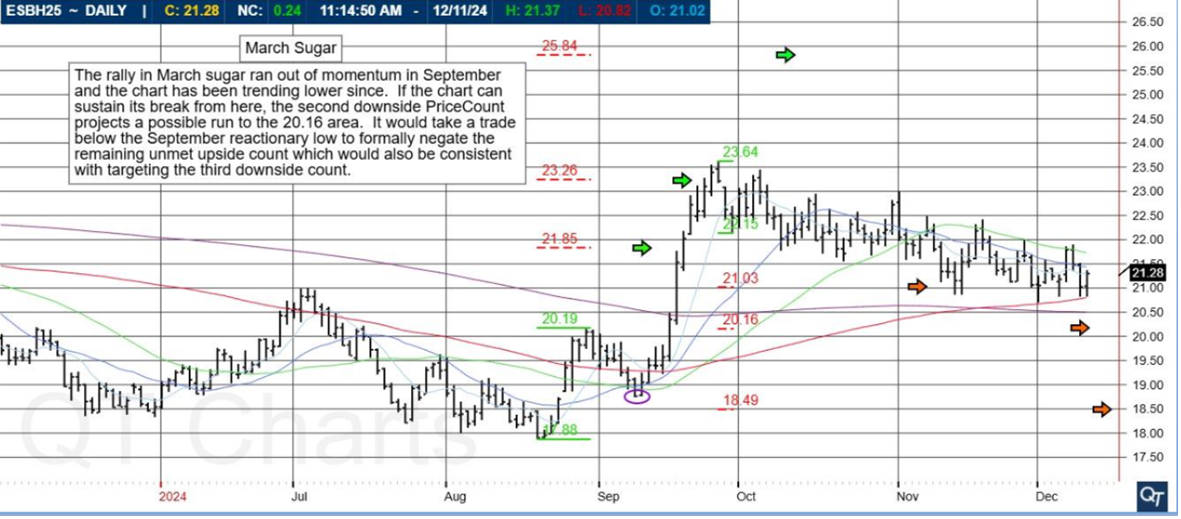
    March 2025 Sugar

    March sugar has shifted its formation back to the topisde and activated upside PriceCount objectives in the process. The chart accelerated to its first upside count to the 21.85 area. It would be normal to get a near term reaction form theis level in the form of a consolidation or corrective trdae. IF you can sustain further strength, the second count projects a possible run to the 23.26 area.


    PriceCounts – Not about where we’ve been, but where we might be going next!

1e5f6ba4 5ab1 4978 9add 01c8cc561e77
The PriceCount study is a tool that can help to project the distance of a move in price. The counts are not intended to be an ‘exact’ science but rather offer a target area for the four objectives which are based off the first leg of a move with each subsequent count having a smaller percentage of being achieved. It is normal for the chart to react by correcting or consolidating at an objective and then either resuming its move or reversing trend. Best utilized in conjunction with other technical tools, PriceCounts offer one more way to analyze charts and help to manage your positions and risk. Learn more at www.qtchartoftheday.com
Trading in futures, options, securities, derivatives or OTC products entails significant risks which must be understood prior to trading and may not be appropriate for all investors. Past performance of actual trades or strategies is not necessarily indicative of future results.

   Broker’s Trading System of the Week

With algorithmic trading systems becoming more prevalent in portfolio diversification, the following system has been selected as the broker’s choice for this month.

Balance Cont. v.22

PRODUCT

HG – Copper
SYSTEM TYPE

Day Trading


Recommended Cannon Trading Starting Capital

$25,000.00


COST

USD 150 / monthly

Get Started

Learn More

86422252 8f48 4ff8 83d2 83943ca53099

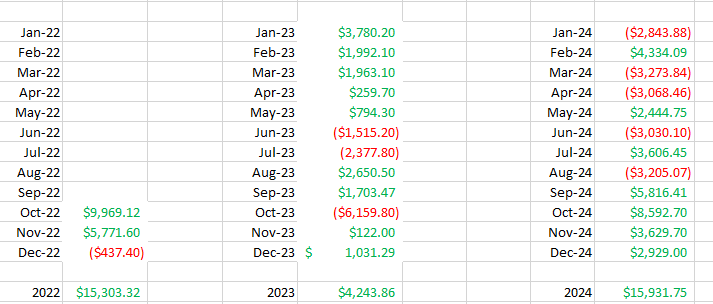
The performance shown above is hypothetical in that the chart represents returns in a model account. The model account rises or falls by the average single contract profit and loss achieved by clients trading actual money pursuant to the listed system’s trading signals on the appropriate dates (client fills), or if no actual client profit or loss available – by the hypothetical single contract profit and loss of trades generated by the system’s trading signals on that day in real time (real‐time) less slippage, or if no real time profit or loss available – by the hypothetical single contract profit and loss of trades generated by running the system logic backwards on back adjusted data. Please read full disclaimer HERE.
Would you like to receive daily support & resistance levels?
Yes
S
No
S

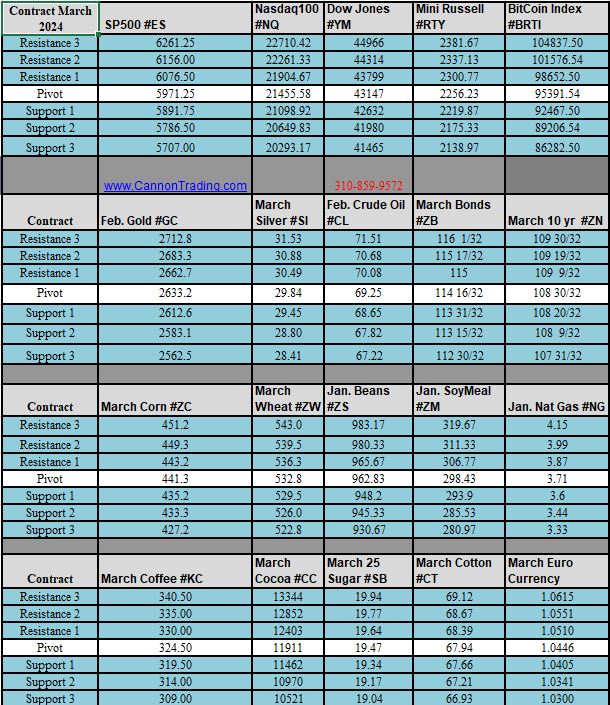
Daily Levels for September 23rd 2024

5f2ead23 5c67 4d34 94a9 f65f637a95b1


Trading Reports for Next Week

435212a9 6b73 4c73 a2f0 fcb1ef3233f7

bf9b3e0d 9c23 44e8 980c a8c01bfbe2cf

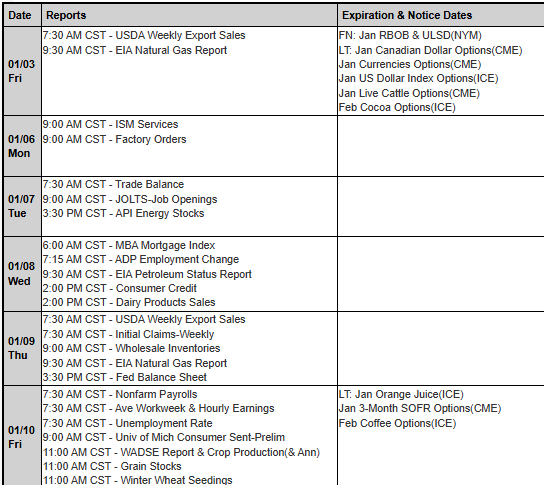
Trading Reports for Next Week

First Notice (FN), Last trading (LT) Days for the Week:
174942e6 4ea7 461f aa6d db529188220c

Improve Your Trading Skills

Get access to proprietary indicators and trading methods, consult with an experienced broker at 1-800-454-9572.

Explore trading methods. Register Here

* This is not a solicitation of any order to buy or sell, but a current market view provided by Cannon Trading Inc. Any statement of facts here in contained are derived from sources believed to be reliable, but are not guaranteed as to accuracy, nor they purport to be complete. No responsibility is assumed with respect to any such statement or with respect to any expression of opinion herein contained. Readers are urged to exercise their own judgement in trading.

Hedging with Futures and Speculating with Futures in Futures Trading

Futures trading is a powerful financial mechanism that plays a crucial role in global markets. It provides market participants with tools to manage risks and seize opportunities in volatile market conditions. The two primary strategies employed by market participants in futures trading are hedging and speculating. Understanding these strategies and their application in the context of futures trading is essential for anyone involved in or considering involvement in the financial markets.

Futures in Futures Trading

What is Futures Trading?

Before delving into the specifics of hedging and speculating, it’s important to understand what futures trading entails. A futures contract is a standardized legal agreement to buy or sell a specific commodity or financial instrument at a predetermined price at a specified time in the future. These contracts are traded on futures exchanges and cover a wide range of underlying assets, including commodities (like oil, gold, and wheat), financial instruments (such as interest rates and currencies), and stock indices.

Futures trading involves both the buyer and the seller agreeing to the terms of the contract. However, unlike traditional buying and selling of assets, futures trading often does not result in the physical delivery of the underlying asset. Instead, many traders close their positions before the contract’s expiration, settling the difference between the purchase and sale prices.

Hedging with Futures

Definition and Purpose of Hedging

Hedging with futures is a risk management strategy used by individuals and businesses to protect themselves against adverse price movements in the market. The primary goal of hedging is not to make a profit but to reduce or eliminate the risk of price fluctuations that could negatively impact a company’s financial performance or an investor’s portfolio.

How Hedging Works

Hedging with futures involves taking a position in the futures market that is opposite to one’s current position in the cash market. For example, a wheat farmer expecting to harvest 10,000 bushels of wheat in six months may be concerned about the possibility of falling wheat prices. To hedge this risk, the farmer can sell wheat futures contracts now. If the price of wheat declines, the loss in the cash market (selling the harvested wheat) is offset by gains in the futures market (selling futures contracts at a higher price than the eventual market price).

Types of Hedging Strategies
  1. Short Hedge: This strategy is used by producers or sellers of a commodity who want to protect against the risk of falling prices. They sell futures contracts to lock in a future selling price for their commodity. If prices drop, the losses from selling the actual commodity are offset by the gains in the futures market.
  2. Long Hedge: This is used by buyers who want to protect against rising prices. For instance, a company that needs to purchase raw materials in the future might buy futures contracts now to lock in the current price. If the market price rises, the company benefits from the futures contracts, offsetting the increased cost of purchasing the raw materials.
Advantages of Hedging with Futures
  • Price Protection: Hedging allows businesses to lock in prices, providing certainty and stability in their financial planning.
  • Cost Control: By fixing future costs, companies can better manage their budgets and financial forecasts.
  • Risk Management: Hedging reduces the risk of unfavorable price movements, protecting profit margins.
Disadvantages of Hedging with Futures
  • Opportunity Cost: If the market moves in favor of the hedger, they miss out on potential profits because their position in the futures market offsets gains.
  • Complexity: Hedging requires a good understanding of the market and the ability to accurately predict future price movements. Improper hedging can lead to increased losses.
  • Margin Requirements: Hedging with futures involves margin calls, which require maintaining a certain amount of capital in the trading account. This can tie up funds that could be used elsewhere.
Real-World Examples of Hedging with Futures
  • Agricultural Hedging: A corn farmer concerned about falling corn prices might sell corn futures contracts to hedge against this risk. If corn prices drop, the loss from selling the corn at a lower price is offset by the profit from the futures contracts.
  • Currency Hedging: A U.S. company that expects to receive payment in euros in six months might hedge against the risk of the euro depreciating against the dollar by selling euro futures contracts. If the euro’s value drops, the loss from the currency exchange is offset by the gain in the futures market.

Speculating with Futures

Definition and Purpose of Speculating

Speculating with futures involves buying or selling futures contracts with the goal of making a profit from changes in the price of the underlying asset. Unlike hedging, where the primary objective is risk management, speculating is about taking on risk in the hopes of earning a return. Speculators have no intention of taking delivery of the underlying asset; they are only interested in profiting from price movements.

How Speculating Works

Speculators analyze the market and make predictions about the direction of future price movements. Based on their analysis, they take positions in the futures market:

  • Going Long: A speculator buys futures contracts if they believe the price of the underlying asset will increase. If the price does rise, the speculator can sell the contract at a higher price and profit from the difference.
  • Going Short: Conversely, if a speculator believes the price will decline, they sell futures contracts. If the price falls, they can buy back the contract at a lower price and profit from the difference.
Types of Speculators
  1. Day Traders: These are speculators who hold positions for a very short period, often just minutes or hours. They aim to profit from small price movements and typically close all positions by the end of the trading day.
  2. Swing Traders: These speculators hold positions for several days or weeks, aiming to profit from short-term price trends.
  3. Position Traders: Position traders take longer-term positions, holding contracts for months, based on broader economic or market trends.
Advantages of Speculating with Futures
  • High Leverage: Futures trading offers high leverage, allowing speculators to control large positions with a relatively small amount of capital.
  • Liquidity: Futures markets are highly liquid, meaning that speculators can enter and exit positions easily without significantly impacting the market price.
  • Potential for High Returns: Due to leverage and market volatility, speculators can potentially earn significant returns in a short period.
Disadvantages of Speculating with Futures
  • High Risk: The same leverage that allows for high returns also amplifies losses. Speculators can lose more than their initial investment.
  • Market Volatility: Futures markets can be highly volatile, and prices can change rapidly. This volatility can lead to significant losses if the market moves against a speculator’s position.
  • Complexity and Expertise: Successful speculation requires a deep understanding of the market, technical analysis, and economic factors. It is not suitable for inexperienced traders.
Real-World Examples of Speculating with Futures
  • Commodity Speculation: A speculator might buy crude oil futures if they believe a geopolitical event will cause oil prices to rise. If their prediction is correct, they can sell the contracts at a higher price and make a profit.
  • Stock Index Futures: A speculator who expects the stock market to decline might sell S&P 500 futures contracts. If the market falls, they can buy back the contracts at a lower price and profit from the difference.

Hedging vs. Speculating

Objectives

The primary objective of hedging is risk management. Hedgers use futures contracts to protect themselves from unfavorable price movements in the cash market. In contrast, the main objective of speculating is to profit from price changes. Speculators are willing to take on risk in hopes of earning a return.

Market Participants

Hedgers are typically producers, manufacturers, exporters, or importers who have a direct interest in the underlying asset. For example, a farmer, oil company, or multinational corporation might hedge their exposure to price changes in commodities or currencies. Speculators, on the other hand, include individual traders, hedge funds, and proprietary trading firms that have no interest in the underlying asset but are looking to profit from price fluctuations.

Risk Tolerance

Hedgers are generally risk-averse. Their goal is to reduce risk, not take it on. They use futures contracts to lock in prices and ensure stability in their financial performance. Speculators, however, are risk-takers. They seek out risk because they believe they can profit from it. The potential for high returns comes with the acceptance of high risk.

Time Horizon

Hedging is typically done with a longer-term perspective, as the goal is to protect against price changes that could impact the business or investment over time. For example, a company might hedge its currency exposure for the next six months. Speculators, however, often operate with shorter time horizons, ranging from a few minutes to several months, depending on their trading strategy.

Outcome Expectations

For hedgers, the best outcome is that the hedge effectively reduces or eliminates the risk of adverse price movements. They are not seeking to profit from the hedge itself, but rather to maintain financial stability. Speculators, on the other hand, expect to make a profit from their trades. Their success is measured by the accuracy of their market predictions and their ability to execute trades at the right time.

Hedging with futures and speculating with futures are two fundamental strategies in futures trading, each serving distinct purposes. Hedging is a vital tool for managing risk and ensuring financial stability, particularly for businesses and investors who have direct exposure to the underlying asset. It allows them to protect against adverse price movements and secure predictable financial outcomes. On the other hand, speculating with futures is about taking on risk in pursuit of profit. Speculators play a crucial role in the market by providing liquidity and helping to discover prices, but their activities are driven by the potential for high returns, which also comes with the possibility of significant losses.

Both strategies require a deep understanding of the futures markets, as well as the underlying assets, and they involve careful analysis and decision-making. For those involved in futures trading, whether they are hedging or speculating, the key to success lies in their ability to accurately assess market conditions, manage risk, and execute trades effectively. Futures trading, with its potential for both risk management and profit generation, continues to be an essential component of the global financial system, offering opportunities for a wide range of market participants.

For more information, click here.
Ready to start trading futures? Call us at 1(800)454-9572 (US) or (310)859-9572 (International), or email info@cannontrading.com to speak with one of our experienced, Series-3 licensed futures brokers and begin your futures trading journey with E-Futures.com today.

Disclaimer: Trading Futures, Options on Futures, and retail off-exchange foreign currency transactions involve substantial risk of loss and are not suitable for all investors. Past performance is not indicative of future results. Carefully consider if trading is suitable for you in light of your circumstances, knowledge, and financial resources. You may lose all or more of your initial investment. Opinions, market data, and recommendations are subject to change at any time.

Important: Trading commodity futures and options involves a substantial risk of loss. The recommendations contained in this article are opinions only and do not guarantee any profits. This article is for educational purposes. Past performances are not necessarily indicative of future results.

This article has been generated with the help of AI Technology and modified for accuracy and compliance.

Follow us on all socials: @cannontrading

Trading Styles in Futures: Concepts for Futures Traders

Futures trading is a dynamic and complex field that offers numerous strategies to accommodate different trading styles and objectives. Futures traders must understand the various approaches and tools available to them to make informed decisions and optimize their trading performance. This article provides a detailed exploration of several key trading strategies and concepts in futures trading, including swing trading, momentum trading, calendar spread futures trading, butterfly spread, high-frequency futures trading, crack spread, statistical arbitrage, and the impact of low margin rates on futures trading.

Trading Styles in Futures

1. Swing Trading in Futures

Definition and Overview

Swing trading is a popular trading strategy in the futures market that involves holding positions for several days or even weeks to capitalize on short- to medium-term price movements. Unlike day trading, where positions are closed within the same trading day, swing traders aim to capture the “swings” in the market—short-term price fluctuations caused by market volatility.

How Swing Trading Works

Swing traders typically use technical analysis to identify potential entry and exit points. They look for patterns such as head and shoulders, flags, and triangles to predict price movements. Swing traders may also use indicators like moving averages, RSI (Relative Strength Index), and MACD (Moving Average Convergence Divergence) to confirm their predictions.

The key to successful swing trading lies in timing. Traders must be able to accurately predict when a trend will start and end, which requires a deep understanding of market dynamics and the ability to interpret chart patterns.

Advantages of Swing Trading
  • Flexibility: Swing trading allows traders to maintain a regular job or pursue other interests because it does not require constant monitoring of the markets.
  • Lower Transaction Costs: Since positions are held for longer periods compared to day trading, swing traders incur fewer transaction costs.
  • Potential for High Returns: By capturing significant price movements, swing traders can achieve substantial returns over time.
Disadvantages of Swing Trading
  • Overnight Risk: Holding positions overnight exposes swing traders to risks from unexpected market events, such as geopolitical developments or economic announcements, that can lead to significant price gaps.
  • Requires Patience: Swing trading requires patience, as traders must wait for the right market conditions to enter and exit trades.
Best Practices for Swing Trading
  • Use Stop-Loss Orders: To manage risk, swing traders should always use stop-loss orders to limit potential losses.
  • Stay Informed: Swing traders must stay informed about market news and events that could impact their positions.
  • Focus on Liquid Markets: Trading in highly liquid futures markets ensures that positions can be easily entered and exited without significant price slippage.

2. Momentum Trading in Futures

Definition and Overview

Momentum trading is a strategy based on the idea that assets that have been performing well will continue to do so in the near future, while assets that have been underperforming will continue to decline. Momentum traders aim to capitalize on the continuation of existing trends by entering trades in the direction of the momentum.

How Momentum Trading Works

Momentum traders use technical indicators like the Moving Average Convergence Divergence (MACD), Relative Strength Index (RSI), and the Momentum Indicator to identify trends and assess their strength. Once a trend is identified, momentum traders enter positions in the direction of the trend, holding the position until signs of a reversal or a slowdown in momentum appear.

Advantages of Momentum Trading
  • Potential for Quick Profits: Momentum trading can generate quick profits if the trader accurately identifies and capitalizes on strong trends.
  • Clear Entry and Exit Signals: Momentum indicators provide clear signals for entering and exiting trades, making the strategy easier to implement for traders who are skilled in technical analysis.
Disadvantages of Momentum Trading
  • High Risk of Reversals: Momentum trading carries the risk of sudden trend reversals, which can result in significant losses if the trader is not quick to react.
  • Requires Constant Monitoring: Momentum traders need to closely monitor the market to act swiftly when trends begin to reverse.
Best Practices for Momentum Trading
  • Trade in Active Markets: Momentum trading works best in highly active markets where trends are strong and persistent.
  • Use Multiple Indicators: Relying on a combination of momentum indicators can help traders confirm trends and reduce the risk of false signals.
  • Set Tight Stop-Losses: To manage risk, momentum traders should set tight stop-losses to protect against sudden reversals.

3. Calendar Spread Futures Trading

Definition and Overview

Calendar spread futures trading, also known as a time spread or horizontal spread, involves simultaneously buying and selling futures contracts on the same underlying asset but with different expiration dates. This strategy is used to profit from changes in the price difference (spread) between the two contracts.

How Calendar Spread Trading Works

In a calendar spread, the trader typically buys a futures contract with a longer expiration date and sells a futures contract with a shorter expiration date, or vice versa. The idea is to profit from the change in the spread between the two contracts as market conditions evolve. The spread can widen or narrow based on factors such as supply and demand, seasonality, or changes in market sentiment.

Advantages of Calendar Spread Trading
  • Reduced Risk: Calendar spreads generally have lower risk compared to outright futures positions because the trader is exposed to the price difference between the two contracts rather than the full price movement of the underlying asset.
  • Lower Margin Requirements: Because the risk is lower, margin requirements for calendar spreads are typically lower than for outright futures positions.
Disadvantages of Calendar Spread Trading
  • Complexity: Calendar spreads can be more complex to manage than simple long or short futures positions, as traders need to understand the factors that influence the spread.
  • Limited Profit Potential: The profit potential in calendar spread trading is generally lower than in outright futures trading because the price movement of the spread is typically smaller than the movement of the underlying asset.
Best Practices for Calendar Spread Trading
  • Monitor Market Conditions: Traders need to stay informed about market conditions that can affect the spread, such as changes in supply and demand or seasonal trends.
  • Use Technical Analysis: Technical analysis can help traders identify opportunities in calendar spreads by analyzing historical spread patterns.

4. Butterfly Spread in Futures Trading

Definition and Overview

A butterfly spread is a neutral options strategy that combines a bull spread and a bear spread. It involves buying and selling options with three different strike prices but with the same expiration date. In futures trading, a similar strategy can be applied using futures contracts.

How Butterfly Spread Trading Works

A typical butterfly spread in futures trading might involve buying one futures contract at a lower price, selling two contracts at a middle price, and buying one contract at a higher price. The goal is to profit from the price of the underlying asset remaining close to the middle strike price at expiration. The strategy profits if the underlying asset’s price is close to the middle strike price and losses are minimized if the price moves significantly in either direction.

Advantages of Butterfly Spread Trading
  • Limited Risk: The maximum loss is limited to the initial cost of setting up the spread.
  • Potential for High Reward: If the market price ends up near the middle strike price, the potential reward can be high relative to the risk.
Disadvantages of Butterfly Spread Trading
  • Limited Profit Potential: While the risk is limited, so is the profit potential, which is capped by the distance between the middle and outer strike prices.
  • Requires Precise Market Prediction: To profit from a butterfly spread, the trader must accurately predict that the market will remain within a narrow price range.
Best Practices for Butterfly Spread Trading
  • Use in Low Volatility Markets: Butterfly spreads work best in markets where volatility is low and prices are expected to remain stable.
  • Monitor Implied Volatility: Changes in implied volatility can affect the pricing of the options or futures contracts used in the butterfly spread, so traders should keep an eye on volatility levels.

5. High-Frequency Futures Trading

Definition and Overview

High-frequency trading (HFT) is a type of algorithmic trading characterized by the use of powerful computers to execute a large number of orders at extremely high speeds. In futures trading, HFT involves placing and executing orders within fractions of a second to take advantage of small price discrepancies in the market.

How High-Frequency Trading Works

HFT firms use sophisticated algorithms to analyze market data and execute trades at lightning speeds. These algorithms are designed to identify and exploit inefficiencies in the market, such as temporary price discrepancies between different exchanges or financial instruments. The profits per trade are usually very small, but the high volume of trades can result in significant overall profits.

Advantages of High-Frequency Trading
  • High Profit Potential: HFT can generate significant profits due to the sheer volume of trades executed.
  • Market Efficiency: HFT contributes to market efficiency by quickly correcting price discrepancies.
Disadvantages of High-Frequency Trading
  • Requires Advanced Technology: HFT requires significant investment in technology and infrastructure, including powerful computers and high-speed internet connections.
  • High Risk: The high speed and volume of trades mean that small errors in the algorithm can lead to substantial losses.
Best Practices for High-Frequency Trading
  • Develop Robust Algorithms: The success of HFT depends on the quality of the algorithms used, so it’s essential to invest in the development and testing of robust trading algorithms.
  • Monitor Latency: In HFT, even milliseconds can make a difference, so traders need to minimize latency in their trading systems.

6. Crack Spread in Futures Trading

Definition and Overview

The crack spread is a trading strategy used in the energy markets, particularly in oil and gas futures. It involves taking positions in the futures of crude oil and refined products like gasoline and heating oil to profit from the price difference (spread) between crude oil and its refined products.

How Crack Spread Trading Works

A typical crack spread trade involves buying or selling crude oil futures while simultaneously selling or buying futures contracts for refined products. The trader profits from changes in the spread between the price of crude oil and the prices of its refined products. For example, if the price of gasoline increases relative to crude oil, the spread widens, and a trader holding a long crack spread position would profit.

Advantages of Crack Spread Trading
  • Hedge Against Refining Margins: For companies involved in refining, the crack spread can serve as a hedge against fluctuations in refining margins.
  • Speculative Opportunities: Traders can speculate on the future direction of the spread based on factors such as seasonal demand, refinery outages, and changes in crude oil supply.
Disadvantages of Crack Spread Trading
  • Complexity: Understanding the relationship between crude oil and its refined products requires specialized knowledge of the energy markets.
  • Volatility: The crack spread can be highly volatile, leading to significant risks if not managed properly.
Best Practices for Crack Spread Trading
  • Stay Informed About the Energy Markets: Traders need to be aware of factors that can affect the supply and demand for crude oil and refined products, such as geopolitical events, weather patterns, and refinery capacity.
  • Use Risk Management Tools: Given the volatility of the crack spread, it’s essential to use risk management tools like stop-loss orders to protect against adverse price movements.

7. Statistical Arbitrage in Futures Trading

Definition and Overview

Statistical arbitrage (stat arb) is a trading strategy that uses mathematical models to identify and exploit price inefficiencies in the market. In futures trading, statistical arbitrage involves trading pairs or groups of futures contracts that have historically shown a statistical relationship, with the expectation that any deviations from this relationship will eventually revert to the mean.

How Statistical Arbitrage Works

Stat arb traders use historical price data and statistical models to identify pairs of futures contracts that are expected to move together. When the price of one contract deviates from its expected relationship with the other, the trader takes a long position in the undervalued contract and a short position in the overvalued contract. The positions are then held until the prices converge, at which point the trader closes the positions for a profit.

Advantages of Statistical Arbitrage
  • Market Neutrality: Because statistical arbitrage involves taking both long and short positions, it is generally market-neutral, meaning it is less affected by overall market direction.
  • Diversification: Statistical arbitrage strategies can be applied across multiple asset classes, providing opportunities for diversification.
Disadvantages of Statistical Arbitrage
  • Requires Advanced Analytical Skills: Implementing a statistical arbitrage strategy requires a deep understanding of statistical methods and access to large datasets.
  • Execution Risk: The success of statistical arbitrage depends on the accurate execution of trades, and small delays or errors can lead to losses.
Best Practices for Statistical Arbitrage
  • Use Robust Statistical Models: The key to successful stat arb trading is the accuracy of the statistical models used to identify trading opportunities.
  • Continuously Monitor Positions: Market conditions can change rapidly, so it’s important to continuously monitor positions and adjust the strategy as needed.

8. What Low Margin Rates on Futures Means for Your Trading

Definition and Overview

Margin is the amount of money required to open and maintain a futures position. It acts as a good faith deposit to ensure that the trader can cover potential losses. Low margin rates mean that traders need to put up less capital to control a larger position in the futures market.

Impact of Low Margin Rates on Futures Trading

Low margin rates can have a significant impact on futures trading by increasing leverage. With lower margins, traders can control larger positions with a smaller initial investment, which can amplify both potential profits and potential losses.

Advantages of Low Margin Rates
  • Increased Leverage: Lower margin requirements allow traders to leverage their capital more effectively, potentially leading to higher returns on investment.
  • Greater Market Access: Lower margins make futures trading accessible to a wider range of traders, including those with smaller account balances.
Disadvantages of Low Margin Rates
  • Higher Risk: While low margin rates increase potential profits, they also increase the risk of substantial losses. Traders need to be careful not to over-leverage their positions.
  • Margin Calls: If the market moves against a highly leveraged position, traders may face margin calls, requiring them to deposit additional funds or liquidate positions at a loss.
Best Practices for Trading with Low Margin Rates
  • Manage Leverage Carefully: Traders should be cautious about over-leveraging their positions and should always have a clear risk management plan in place.
  • Use Stop-Loss Orders: To protect against large losses, traders should use stop-loss orders to automatically close positions if the market moves against them.

Futures trading offers a wide array of strategies and approaches, each with its own set of advantages and challenges. Whether you are engaging in swing trading, momentum trading, calendar spread trading, or any of the other strategies discussed, it is crucial to have a deep understanding of the market dynamics and to implement effective risk management practices. Additionally, the impact of low margin rates cannot be overstated, as they can significantly influence the risk and return profile of your trading activities.

By mastering these strategies and understanding the underlying concepts, futures traders can better navigate the complexities of the market and increase their chances of success. Each strategy requires a unique set of skills and knowledge, and the choice of strategy should align with the trader’s individual goals, risk tolerance, and market outlook.

For more information, click here.

Ready to start trading futures? Call us at 1(800)454-9572 (US) or (310)859-9572 (International), or email info@cannontrading.com to speak with one of our experienced, Series-3 licensed futures brokers and begin your futures trading journey with E-Futures.com today.

Disclaimer: Trading Futures, Options on Futures, and retail off-exchange foreign currency transactions involve substantial risk of loss and are not suitable for all investors. Past performance is not indicative of future results. Carefully consider if trading is suitable for you in light of your circumstances, knowledge, and financial resources. You may lose all or more of your initial investment. Opinions, market data, and recommendations are subject to change at any time.

Important: Trading commodity futures and options involves a substantial risk of loss. The recommendations contained in this article are opinions only and do not guarantee any profits. This article is for educational purposes. Past performances are not necessarily indicative of future results.

This article has been generated with the help of AI Technology and modified for accuracy and compliance.

Follow us on all socials: @cannontrading

NQ Futures Contract Nasdaq Futures

The NQ futures contract, also known as the Nasdaq-100 futures contract, is a popular derivative instrument in the financial markets. It allows traders to speculate on the future value of the Nasdaq-100 Index, which comprises 100 of the largest non-financial companies listed on the Nasdaq Stock Market. This contract is pivotal for investors aiming to hedge their portfolios, gain exposure to the tech-heavy index, or leverage trading opportunities. This article delves into the components of the NQ futures contract, including its size, trading hours, participants, and various specifications, with a particular focus on the Mini and Micro Nasdaq futures contracts.

Nasdaq Futures

Components of the Nasdaq-100 Futures Contract

The Nasdaq-100 Index, which the NQ futures contract is based on, includes major technology and innovative companies such as Apple, Microsoft, Amazon, and Tesla. The futures contract provides a means to trade the performance of these companies collectively without directly buying the stocks.

Contract Size

The standard Nasdaq-100 futures contract has a significant size, designed for institutional and professional traders. It represents a substantial notional value, calculated as the index level multiplied by a specific multiplier. For the standard NQ futures contract, the multiplier is 20. Thus, if the Nasdaq-100 Index is at 15,000 points, the notional value of one contract would be:

Contract Trading Hours

The trading hours for the Nasdaq-100 futures contracts are extensive, allowing for nearly round-the-clock trading. This is crucial for managing risks and capitalizing on global market movements.

This extensive trading period covers Asian, European, and American market hours, providing ample opportunities for traders globally.

Who is Trading the Nasdaq-100 Futures?

The Nasdaq-100 futures contract attracts a diverse group of market participants:

  • Institutional Investors: Including hedge funds, pension funds, and mutual funds, these investors use the contract for hedging purposes and to gain exposure to the tech sector without directly buying individual stocks.
  • Professional Traders: Proprietary trading firms and market makers trade these contracts to profit from short-term price movements.
  • Retail Traders: With the introduction of the E-mini and Micro E-mini contracts, retail traders can participate in the market, speculating on price movements or hedging their portfolios.
  • Corporate Treasurers: Companies with significant exposure to the tech sector might use the contracts to hedge against adverse price movements in the Nasdaq-100 Index.

Why Trade the Nasdaq-100 Futures?

The popularity of the Nasdaq-100 futures contracts can be attributed to several factors:

  • Leverage: Futures contracts allow traders to control a large notional value with a relatively small amount of capital, amplifying potential returns (and risks).
  • Liquidity: The Nasdaq-100 futures are highly liquid, ensuring tight bid-ask spreads and ease of entering and exiting positions.
  • Diversification: By trading the index, investors gain exposure to a broad range of leading technology and innovative companies, reducing the risk associated with individual stocks.
  • Hedging: The contracts are an effective tool for hedging against market downturns, protecting the value of investment portfolios.
  • Speculation: Traders can speculate on the direction of the Nasdaq-100 Index, taking advantage of price movements to profit.

History of the Nasdaq-100 Futures Contract

The Nasdaq-100 futures contract was introduced to provide a means for investors to trade the performance of the Nasdaq-100 Index. The history of this contract is intertwined with the evolution of the Nasdaq Stock Market and the growing importance of technology companies in the global economy.

  • 1985: The Nasdaq-100 Index was launched, initially comprising 100 of the largest non-financial companies listed on the Nasdaq Stock Market.
  • 1996: The Chicago Mercantile Exchange (CME) introduced the Nasdaq-100 futures contract, allowing traders to speculate on the future value of the index.
  • 1999: The E-mini Nasdaq-100 futures contract was introduced, providing a smaller-sized contract suitable for individual investors and smaller trading firms.
  • 2019: The CME Group launched the Micro E-mini Nasdaq-100 futures contract, making it accessible to a wider audience, including retail traders.

Over the years, the Nasdaq-100 futures contracts have become a vital part of the financial markets, offering liquidity, leverage, and exposure to the tech-heavy Nasdaq-100 Index.

Contract Specifications in Detail

Margin Requirements

The margin requirements for trading Nasdaq-100 futures vary based on market conditions and the volatility of the underlying index. Initial margin is required to open a position, while maintenance margin must be maintained to keep the position open.

  • Standard NQ Contract: Typically, the initial margin is around $20,000, with maintenance margin slightly lower.

These margins are subject to change and can be higher during periods of increased market volatility.

Expiration and Settlement

Nasdaq-100 futures contracts have quarterly expiration dates: March, June, September, and December. The final settlement is based on the Special Opening Quotation (SOQ) of the Nasdaq-100 Index on the third Friday of the contract month.

Position Limits

To prevent market manipulation and ensure orderly trading, the CME Group imposes position limits on Nasdaq-100 futures contracts. These limits are periodically reviewed and adjusted based on market conditions.

Trading Strategies

Traders employ various strategies when trading Nasdaq-100 futures contracts:

  • Speculation: Taking directional positions based on market analysis and predictions about future price movements.
  • Hedging: Using futures contracts to offset potential losses in a portfolio of stocks or other assets.
  • Spread Trading: Simultaneously buying and selling related futures contracts to profit from changes in the price relationship between them.
  • Arbitrage: Exploiting price discrepancies between the Nasdaq-100 futures and other related instruments.

The NQ futures contract, encompassing the standard, E-mini, and Micro E-mini Nasdaq-100 futures, plays a crucial role in the financial markets. Its appeal lies in the ability to gain leveraged exposure to the tech-heavy Nasdaq-100 Index, the liquidity it provides, and its utility for hedging and speculative purposes. Understanding the components, specifications, trading hours, and strategies associated with these contracts is essential for anyone looking to participate in this dynamic segment of the futures market. Whether you’re an institutional investor, professional trader, or retail participant, the Nasdaq-100 futures contracts offer a versatile tool for managing risk and capitalizing on market opportunities.

For more information, click here.

Ready to start trading futures? Call us at 1(800)454-9572 (US) or (310)859-9572 (International), or email info@cannontrading.com to speak with one of our experienced, Series-3 licensed futures brokers and begin your futures trading journey with E-Futures.com today.

Disclaimer: Trading Futures, Options on Futures, and retail off-exchange foreign currency transactions involve substantial risk of loss and are not suitable for all investors. Past performance is not indicative of future results. Carefully consider if trading is suitable for you in light of your circumstances, knowledge, and financial resources. You may lose all or more of your initial investment. Opinions, market data, and recommendations are subject to change at any time.

Important: Trading commodity futures and options involves a substantial risk of loss. The recommendations contained in this article are opinions only and do not guarantee any profits. This article is for educational purposes. Past performances are not necessarily indicative of future results.

This article has been generated with the help of AI Technology and modified for accuracy and compliance.

Follow us on all socials: @cannontrading
Future S&P Trade S&P 500 Index Futures

Trading Standard and Poor’s 500 (S&P 500) index futures is highly appealing to various investors and traders. Known as ES futures, these contracts are among the most traded financial instruments globally. Here are the top ten reasons to consider trading S&P 500 futures:

Future S&P Trade

  • Diversification Trading S&P 500 index futures allows investors to gain exposure to a broad market, as the index includes 500 of the largest U.S. companies across various industries. This diversity mitigates the risk associated with individual stocks or sectors. A single S&P 500 futures contract effectively represents a varied portfolio, simplifying diversified investment through one transaction.
  • High Liquidity S&P 500 futures are renowned for their high liquidity. The high volume of transactions ensures swift execution of trades, reducing the cost of entering and exiting positions. This liquidity results in tighter bid-ask spreads and ensures that large orders can be filled without significantly impacting the price, making it ideal for investors of all sizes.
  • Leverage One of the most compelling aspects of trading S&P 500 futures is the leverage available. Futures contracts allow traders to control a substantial amount of equity with a relatively small capital outlay. This leverage can amplify profits if the market moves favorably but can also amplify losses, highlighting the importance of risk management.
  • Cost Efficiency Futures trading can be more cost-effective than buying the individual stocks that comprise the index. Commissions and transaction fees are generally lower in futures trading compared to equity markets. Additionally, as margined products, traders do not need to pay the full value of the exposure to benefit from its performance.
  • Hedging Investors with a portfolio of U.S. stocks can use S&P 500 index futures to hedge against potential downturns in the broader market. By short selling futures, they can protect their portfolios from market volatility or anticipated declines, making futures an excellent risk management tool, especially in uncertain market conditions.
  • Speculation Traders can speculate on the direction of the U.S. economy or the stock market by trading S&P 500 futures. Whether anticipating a rise or fall, these futures provide an efficient means to position accordingly and profit from movements in the index.
  • No Short-Selling Restrictions Unlike the stock market, where short selling has restrictions, S&P 500 futures traders can go long or short freely. This flexibility allows them to act on bearish market outlooks as easily as bullish ones, which is particularly valuable during market corrections or bear markets.
  • Nearly 24-Hour Trading The S&P 500 futures market operates nearly 24 hours a day during weekdays, allowing traders to react to news and economic events globally. This continuous trading window provides a significant advantage in managing positions and capitalizing on global economic events that may affect the U.S. market.
  • Transparency and Fairness The futures market is highly regulated, offering a level of transparency that ensures a fair trading environment. S&P 500 futures prices reflect a broad consensus influenced by widespread information, including economic indicators, market sentiment, and political events, making it one of the fairest investment vehicles.
  • Access to Advanced Trading Strategies Trading S&P 500 futures enables the use of sophisticated trading strategies such as spreads, straddles, and strangles, which can manage risk and enhance potential returns. These strategies can be particularly beneficial in a futures market where price movements can be significant.

S&P 500 Index Futures are financial contracts that obligate the buyer to purchase, and the seller to sell, a specified amount of the S&P 500 Index at a future date and at a predetermined price. The S&P 500 Index itself is a benchmark of U.S. equities, representing the performance of 500 of the largest publicly traded companies in the U.S., covering various sectors of the economy.

  • Underlying Asset: The S&P 500 Index, which is a broad representation of the U.S. stock market and includes large-cap companies across various sectors.
  • Contract Size: Typically, futures contracts are based on a notional amount of the index. For example, each point movement in the S&P 500 Index futures contract corresponds to a set monetary value, such as $50 per point for the standard S&P 500 futures.
  • E-Mini S&P 500: A smaller version of the standard S&P 500 futures contract, known as the E-Mini S&P 500, is popular among traders due to its lower margin requirements and reduced contract size, making it more accessible for individual traders and smaller institutions.

Why Traders and Institutions Trade S&P 500 Index Futures

  • Liquidity: S&P 500 futures are among the most actively traded futures contracts, providing high liquidity. This liquidity ensures that traders can enter and exit positions with ease, often at tight bid-ask spreads.
  • Arbitrage Opportunities: Institutional traders use S&P 500 futures to exploit price discrepancies between the futures market and the underlying spot market. This can involve strategies like cash-and-carry arbitrage, where traders simultaneously buy or sell the index in the spot market and take the opposite position in the futures market.
  • Market Sentiment: Futures on the S&P 500 Index can be used to gauge market sentiment and investor expectations about future market movements. The futures prices reflect collective market expectations and can offer insights into potential market trends.

S&P 500 Index Futures play a crucial role in the financial markets by providing a flexible, cost-effective, and efficient way to hedge, speculate, and gain exposure to the U.S. stock market. With their high liquidity and leverage, these futures contracts cater to both institutional investors and individual traders, facilitating a wide range of trading strategies and market insights.

Try the FREE E-Futures International Platform Trading S&P 500 futures offers numerous benefits, from diversification and liquidity to cost efficiency and flexibility. Whether you aim to hedge other investments, leverage positions, or speculate on market movements, S&P 500 futures are a valuable tool for achieving a broad range of financial goals. Conduct thorough research and consider your financial condition and strategy before engaging in futures trading. For more information, click here.

Ready to start trading futures? Call us at 1(800)454-9572 (US) or (310)859-9572 (International), or email info@cannontrading.com to speak with one of our experienced, Series-3 licensed futures brokers and begin your futures trading journey with E-Futures.com today.

Disclaimer: Trading Futures, Options on Futures, and retail off-exchange foreign currency transactions involve substantial risk of loss and are not suitable for all investors. Past performance is not indicative of future results. Carefully consider if trading is suitable for you in light of your circumstances, knowledge, and financial resources. You may lose all or more of your initial investment. Opinions, market data, and recommendations are subject to change at any time.

Important: Trading commodity futures and options involves a substantial risk of loss. The recommendations contained in this article are opinions only and do not guarantee any profits. This article is for educational purposes. Past performances are not necessarily indicative of future results.

This article has been generated with the help of AI Technology and modified for accuracy and compliance.

Follow us on all socials: @cannontrading
Weekly Newsletter: FOMC next Week, Bonds Outlook & Trading Levels for April 29th

Get Real Time updates and more by joining our Private Facebook Group!
Subscribe to our YouTube Channel

C47

Cannon Futures Weekly Letter Issue # 1191

In this issue:
  • Important Notices – FOMC & NFP Next Week
  • Futures 101 – Understanding Volume
  • Hot Market of the Week – June Bonds
  • Broker’s Trading System of the Week – ES intraday System
  • Trading Levels for Next Week
  • Trading Reports for Next Week


Important Notices – Next Week Highlights:

    • FOMC Rate Announcement Wed.
    • Heavy Earnings, AMZN and AMD Tues, AAPL Thur. all after the close
    • Heavy Data, Chicago PMI, Consumer Confidence, Construction Spending, ISM Manufacturing PMI, Jobless Claims.
    • NON FARM Payrolls to cap off the week on Fri. , preopening


Futures 101 : Understanding VOLUME

Volume is reported for all futures contracts. It is calculated by counting the number of contracts that have been bought and sold over a given time. You can track volume using different time intervals like daily or intraday.
When a futures contract is traded, whether bought or sold, it counts towards volume for that contract.
For example, a trader closes a short position in the E-mini S&P 500 (ES) futures contract by buying one contract in the ES, so volume will increase by 1.
Traders often use and interpret the rise or decline of volume in a futures contract to help make trading decisions.
Volume can give important information to traders such as:
  • Indicate the price levels at which traders are more or less interested in trading a futures contract
  • During the roll, indicate to traders when to switch to trading the front month futures contract as volume decreases in the expiring contract
  • Identify the times of day when a futures contract is most liquid
Price Levels
When volume changes as price of a futures contract moves towards certain levels, this can indicate to a trader that a change in direction may occur. Some traders may use this information to indicate whether to buy or sell at those key levels.
­Contract Roll
During the futures rollover, traders pay attention to the contract that is taking the higher levels of volume. Traders use this information to determine when to start trading the next month contract. As volume decreases in the expiring contract, trading will shift to the next available month contract.
For example, say the June ES (E-mini S&P 500) futures contract is about to expire and September will become the new front month. On the Thursday of rollover week, watch how the June contract starts to lose volume and the September contract begins to pick up volume. When the September contract has more volume than the June contract, it is time to switch to the September contract.
Active Periods
Traders typically prefer higher volume times to trade, as it means that more traders are actively interested in buying and selling. When volume is high, the bid-ask spread is typically smaller, orders are filled faster and less gaps may exist between ticks.
For example, markets can have lower volume between the hours of 12:00 p.m.-2:00 p.m. ET, before major economic releases; conversely, market often see higher volume around the open and close of the trading day.
Traders also can look at average daily volume over a longer time period, such as a few weeks or months, to see if the markets currently are in a lower or higher volume than is typical.
Summary
What volume can’t show however, is whether traders are buying or selling, or opening or closing a position.
For example, if the ES contract is trading at 2375 and suddenly pushes down to 2360 while volume increases, the volume that comes into the market could be from traders opening new long positions at key levels of support. That could indicate a bullish sentiment. Volume also can be generated by liquidation of exiting long positions or opening of new short positions, a possible bearish indication.
A spike in volume at 2360 doesn’t necessarily mean that buyers are coming into the market and that the price will bounce.
Volume data is readily available for each futures contract and for the market as a whole. Although traders may use volume in different ways to interpret how to trade, volume can be an important factor to help inform your trading decisions.


stars

3b644da2 2bee 4d39 8d98 5208a20bec39


  • Hot Market of the Week – June Bonds
Hot market of the week is provided by QT Market Center, A Swiss army knife charting package that’s not just for Hedgers, Cooperatives and Farmers alike but also for Spread traders, Swing traders and shorter time frame application for intraday traders with a unique proprietary indicator that can be applied to your specific trading needs.
June 30 Year T-Bonds
The June 30 Year T-Bond break found temporary stability at its second downside PriceCount objective recently. Now, the chart has resumed its slide into new lows which, if sustained, would project a run to the third count in the 109^20 area.
PriceCounts – Not about where we’ve been , but where we might be going next!
e705ddd3 93f1 4833 80e3 d1e808fbc117
The PriceCount study is a tool that can help to project the distance of a move in price. The counts are not intended to be an ‘exact’ science but rather offer a target area for the four objectives which are based off the first leg of a move with each subsequent count having a smaller percentage of being achieved. It is normal for the chart to react by correcting or consolidating at an objective and then either resuming its move or reversing trend. Best utilized in conjunction with other technical tools, PriceCounts offer one more way to analyze charts and help to manage your positions and risk. Learn more at www.qtchartoftheday.com
Trading in futures, options, securities, derivatives or OTC products entails significant risks which must be understood prior to trading and may not be appropriate for all investors. Past performance of actual trades or strategies is not necessarily indicative of future results.
  • Broker’s Trading System of the Week

With algorithmic trading systems becoming more prevalent in portfolio diversification, the following system has been selected as the broker’s choice for this month.
PRODUCT
SYSTEM TYPE
Intraday
COST
USD 110 / monthly
Recommended Cannon Trading Starting Capital
$10,000
a5fd1228 3ba8 42c5 a40d c3e46544bdd0
The performance shown above is hypothetical in that the chart represents returns in a model account. The model account rises or falls by the average single contract profit and loss achieved by clients trading actual money pursuant to the listed system’s trading signals on the appropriate dates (client fills), or if no actual client profit or loss available – by the hypothetical single contract profit and loss of trades generated by the system’s trading signals on that day in real time (real‐time) less slippage, or if no real time profit or loss available – by the hypothetical single contract profit and loss of trades generated by running the system logic backwards on back adjusted data. Please read full disclaimer HERE.
Would you like to receive daily support & resistance levels?
Yes
S
No
S


Daily Levels for April 29th 2024

eb118b97 a50d 48fb ab4a efafa6ff5968

Trading Reports for Next Week

d398c77d 24dc 450b 92fb ef3ef27b13d9
d259df9c bf07 4429 9fa8 d12b53c37804
First Notice (FN), Last trading (LT) Days for the Week:
6d1a7821 c606 4107 83ef 6fa197eb7433

Improve Your Trading Skills

Get access to proprietary indicators and trading methods, consult with an experienced broker at 1-800-454-9572.

Explore trading methods. Register Here

* This is not a solicitation of any order to buy or sell, but a current market view provided by Cannon Trading Inc. Any statement of facts here in contained are derived from sources believed to be reliable, but are not guaranteed as to accuracy, nor they purport to be complete. No responsibility is assumed with respect to any such statement or with respect to any expression of opinion herein contained. Readers are urged to exercise their own judgement in trading.

PCE Tomorrow!  + Levels for April 26th

Get Real Time updates and more by joining our Private Facebook Group!
Subscribe to our YouTube Channel


C46


The U.S. GDP experienced a modest increase of 1.6% in the first quarter, marking the slowest expansion in two years. This news prompted a downturn in U.S. stock markets. But should investors be concerned about this figure?

Ben Laidler, the Global Markets Strategist at eToro, appeared on Wealth! to shed light on the implications of the GDP data for investor portfolios.

Laidler commented, “The recent GDP figure isn’t ideal, yet it’s not as dire as it may seem. The core elements that matter to us—business investment and consumer spending—are holding strong. The observed softness is largely attributed to less critical factors, which are expected to rebound in the next quarter, specifically trade and inventory levels.

  • While the inflation metric is slightly unsettling, it’s best to wait for the upcoming release of the monthly Personal Consumption Expenditures (PCE) index. This will provide us with more clarity on the extent of our concerns regarding the current economic situation.”


stars

e35cb555 9ff3 4f00 9fe8 0655b28fbd90

Daily Levels for April 26th, 2024

c966fcd9 e95b 47a3 a4d4 aa6f33599e0a

b5b078e6 66c6 4fc3 8c02 baae8fe2ac51

Economic Reports
provided by: ForexFactory.com
All times are Eastern Time ( New York)
b0f74ff4 de2a 4aa0 85d8 24b8d3f73d7f

Improve Your Trading Skills

Get access to proprietary indicators and trading methods, consult with an experienced broker at 1-800-454-9572.

Explore trading methods. Register Here

3b644da2 2bee 4d39 8d98 5208a20bec39

* This is not a solicitation of any order to buy or sell, but a current market view provided by Cannon Trading Inc. Any statement of facts here in contained are derived from sources believed to be reliable, but are not guaranteed as to accuracy, nor they purport to be complete. No responsibility is assumed with respect to any such statement or with respect to any expression of opinion herein contained. Readers are urged to exercise their own judgement in trading.

GDP Tomorrow, Earnings Season in Full Play  + Levels for April 25th

Get Real Time updates and more by joining our Private Facebook Group!
Subscribe to our YouTube Channel


C30


A few tips for tomorrow:

  • If you are trading stock index futures, note price action has been VERY choppy during the day session as most earnings come out after the close…
  • Coffee and Coca volatility is as high as I have seen in recent months. Large intraday and overnight moves in both, as much as +/- 8% per day!
  • We have GDP and home sales tomorrow.
  • Big pullback in both silver and gold and the key question is: Was this profit taking/ deflation of geo political fear and GOOD entry to the long side? OR…is this the near term top for both markets??
  • Corn daily chart for your review below.

91d5fe9f befc 4c02 b5d6 4fe775ba7b0e


stars

e35cb555 9ff3 4f00 9fe8 0655b28fbd90

Daily Levels for April 25th, 2024

c966fcd9 e95b 47a3 a4d4 aa6f33599e0a

thumbnail?url=http%3A%2F%2Fi.ytimg.com%2Fvi%2FJnHAMUGdNoM%2Fhqdefault

Economic Reports
provided by: ForexFactory.com
All times are Eastern Time ( New York)
7d0dfe51 9084 4e90 9e70 216bff610617

Improve Your Trading Skills

Get access to proprietary indicators and trading methods, consult with an experienced broker at 1-800-454-9572.

Explore trading methods. Register Here

3b644da2 2bee 4d39 8d98 5208a20bec39

* This is not a solicitation of any order to buy or sell, but a current market view provided by Cannon Trading Inc. Any statement of facts here in contained are derived from sources believed to be reliable, but are not guaranteed as to accuracy, nor they purport to be complete. No responsibility is assumed with respect to any such statement or with respect to any expression of opinion herein contained. Readers are urged to exercise their own judgement in trading.

Bullet Points, Highlights, Announcements  + Levels for April 24th

Get Real Time updates and more by joining our Private Facebook Group!
Subscribe to our YouTube Channel


C37

Bullet Points, Highlights, Announcements   

by Mark O’Brien, Senior Broker

General:  


Futures traders with positions in deliverable futures contracts keep an eye on the calendar for important dates at the end of the month. First Notice Day (FND) and Last Trading Day (LTD) for many futures contracts are close at hand. Make sure you steer safely clear of receiving delivery notices for physical commodities (FND), or greatly reduced liquidity (LTD). If you’re unsure, contact your Cannon Trading Co. broker.


The economic calendar for the rest of the week is scarce with Thursday’s Q1 GDP report taking center stage.


Prospects for a fed rate cut announcement at the Fed’s 4/30-5/1 meeting, as well as its mid-June meeting have all but evaporated and many Fed watchers expect the central bank to keep its “higher for longer” mantra in place for most and possibly all of 2024.


Worries over a wider Middle East conflict have subsided and traders are discounting the risk of further escalations. Case in point, June gold lost ±67 per ounce (±2%) yesterday after posting its latest all-time record high close of $2,413.80/ounce on Friday. Iran downplayed Israel’s retaliatory drone strike against it, in what appeared to be a move aimed at averting regional escalation.


Energies: 


  • The ±$2.50/barrel selloff in May crude oil and the ±¢9.75/gallon May RBOB gasoline futures last week likely signaled the markets do not see an Iranian supply disruption in the near future, so the markets will be given to focusing on global energy demand going forward

47489e7c 5065 45b3 8e85 55c7ad3a0f3e


Softs:  


May Cocoa futures declined sharply yesterday and today, down nearly $1,300/ton (a $13,000 per contract move) marking its worst two-day slump since February. This after a 3-day / Wed.-Fri. rally of $1,635/ton to its all-time record high close of 11,878/ton on Friday. ICE U.S. has set the initial margin requirement to $11,260 per contract.

stars

e35cb555 9ff3 4f00 9fe8 0655b28fbd90

Daily Levels for April 24th, 2024

b8b30c15 9c5e 43f1 858e 25ebcd94928e

thumbnail?url=http%3A%2F%2Fi.ytimg.com%2Fvi%2FJnHAMUGdNoM%2Fhqdefault

Economic Reports
provided by: ForexFactory.com
All times are Eastern Time ( New York)
f4aacb3b d0e3 45f4 82bf 45cec9587768

Improve Your Trading Skills

Get access to proprietary indicators and trading methods, consult with an experienced broker at 1-800-454-9572.

Explore trading methods. Register Here

3b644da2 2bee 4d39 8d98 5208a20bec39

* This is not a solicitation of any order to buy or sell, but a current market view provided by Cannon Trading Inc. Any statement of facts here in contained are derived from sources believed to be reliable, but are not guaranteed as to accuracy, nor they purport to be complete. No responsibility is assumed with respect to any such statement or with respect to any expression of opinion herein contained. Readers are urged to exercise their own judgement in trading.