The Importance of the FOMC Minutes | Support and Resistance Levels

Jump to a section in this post:
1. Market Commentary
2. Support and Resistance Levels – S&P, Nasdaq, Dow Jones, Russell 2000
3. Support and Resistance Levels – Gold, Euro, Crude Oil, T-Bonds
4. Support and Resistance Levels – Corn, Wheat, Beans, Silver
5. Daily Mini S&P Chart
6. Economic Reports for Tuesday, November 22, 2011

divider black 190

1. Market Commentary

Last week ( Thursday to be exact) I shared the same chart below with the sell signal if we can break 1204.50 ( The market was trading around 1215 at that time). Well we broke below and pretty much got the first target in one trading day.

Tomorrow we will have FOMC minutes, an important report which the market tends to react to or as I call it, “Market respects it”.

If the market breaks above 1204.50 after the minutes, we may see a relief from selling, on the other hand if the market reacts bearishly to the report than 1147.50 and 1120 are next targets.

divider black 190 Continue reading “The Importance of the FOMC Minutes | Support and Resistance Levels”

High Market Volatility as Shown by S&P 500 Pit Session | Support and Resistance Levels

In this post:

1. Market Commentary
2. Support and Resistance Levels
3. Daily Mini S&P 500 Futures Chart
4. Economic Reports
5. Earnings Releases

divider black 190

1. Market Commentary

Days like today and yesterday encourage me to repeat what I wrote yesterday:

ALWAYS EXPECT THE UNEXPECTED! When volatility skyrockets like now, moves become extreme, the speed of the market really picks up and this is when one must adjust their trading size lower to accommodate for the wilder and wider moves.

Below is an hourly chart of SP500 pit session. Notice the gaps we have from overnight moves.

I think if we can break 1132, market may have a shot at closing the gap all the way up at: 1155 Continue reading “High Market Volatility as Shown by S&P 500 Pit Session | Support and Resistance Levels”

Trade With Caution, FOMC Day Tomorrow | Support and Resistance Levels

In this post:

1. Market Commentary
2. Support and Resistance Levels
3. Daily Mini S&P 500 Futures Chart
4. Economic Reports
5. Earnings Releases

divider black 190

1. Market Commentary


Front month for Equities (eminis), currencies, bonds and financials and many other markets is now December. You should not be trading almost any September contract of any market.

Note to our clients who are trading with TransactAT:

The latest version is now TransactAT 5.2.2 (download). The newer version can be installed over the older version. Please contact you broker if you need any help.

FOMC tomorrow and before that more than a few economic numbers.

FOMC days have different characteristics than other trading days. If you have traded for a while, check your trading notes from past FOMC days that may help you prepare for tomorrow.

If you are a newcomer, take a more conservative approach and make sure you understand that the news can really move the market- FAST.

My observations suggest choppy, low volume up until announcement, followed by some some sharp volatile moves right during and after the announcement. However, with tomorrow early morning reports, we may see more volatility during first couple of hours as well.

My SWING trading model is currently short the mini Russell from 693 ( target around 672, stop around 716) which may not suite everyone’s stomach ahead of the what maybe volatile overnight and tomorrows FOMC session, but chart for your review below.

If you would like to be included on my SWING trade ideas, send me an email. Continue reading “Trade With Caution, FOMC Day Tomorrow | Support and Resistance Levels”

New Version of TransactAT is Available | Support and Resistance Levels

In this post:

1. Market Commentary
2. Support and Resistance Levels
3. Daily Mini S&P 500 Futures Chart
4. Economic Reports
5. Earnings Releases

divider black 190

1. Market Commentary


Front month for Equities (eminis), currencies, bonds and financials and many other markets is now December. You should not be trading almost any September contract of any market.

Note to our clients who are trading with TransactAT:

The latest version is now TransactAT 5.2.2 (download). The newer version can be installed over the older version. Please contact you broker if you need any help.


We started the week right where we left the last one….overnight gaps due to news from Europe ( Greece this time), moves both ways with volatility actually dying out during the day session.

I have a “small sell signal” if we can break below 1186 on Dec. Mini Sp with targets coming at 1166 and 1148. Continue reading “New Version of TransactAT is Available | Support and Resistance Levels”

Futures Trading Levels, Mini Dow Jones Affected by Bearish Job Data

Cannon Trading / E-Futures.com

Market sold off on bearish jobs data earlier this morning. We saw a good bounce in the last half of the trading session.

Looking at the Mini Dow Jones daily chart below, I will need to see a break below 12528 in order to get more confidence that the trend is starting to reverse and that odds prefer the down side.

Daily Chart of the Mini Dow Jones from July 8th 2011

Daily Chart of the Mini Dow Jones from July 8th 2011

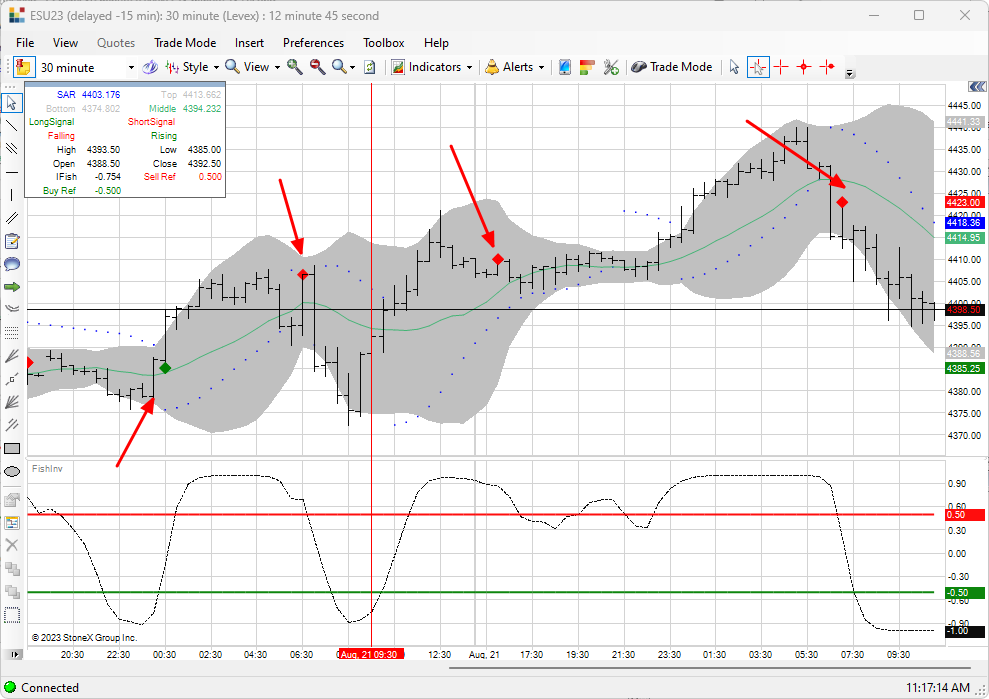
Would you like to have access to my DIAMOND ALGO as shown aboveand be able to apply for any market and any time frame? The screen shot above is of the Mini Dow from today.

If so, please send me an email with the following information:

  1. Are you currently trading futures?
  2. Charting software you use?
  3. If you use sierra or ATcharts, please let me know the user name so I can enable you.
  4. Markets you currently trading? Continue reading “Futures Trading Levels, Mini Dow Jones Affected by Bearish Job Data”

Futures Trading Levels, Mini S&P Screenshots with Diamond Algorithm

Cannon Trading / E-Futures.com

I think that if we can take out today’s high, we may see 1286 to 1295.

Daily chart for your review below.

Daily Mini S&P 500 Chart from June 20th 2011

Daily Mini S&P 500 Chart levels for Monday June 20th, 2011

Many of you have asked if these DIAMONDS indicators you see in the screen shot above available as a software or available for different markets during different times.

I can now tell you that it is available as a tool that you can use on your own, at your own convenience and time for different markets and different time frames.

Here is another screen shot from today’s end of the session, using volume charts for DAY TRADING.

Intraday Mini S&P 500 Chart from June 20th 2011

Intraday Mini S&P 500 Chart from Monday June 20th, 2011

I have developed this model which is a family of studies and the “DIAMOND” algorithm. I have spent over 2 years developing this model and now I have made them available through Sierra / AT charts for a free trial. If you are a Cannon Trading client, the cost after the two week trail is $119 per month which can be deducted from your account. If you are not a client the cost is $299 per month.

The Diamond ALGO package provides signals and also can be used as a “GPS” for trading methodology. It is accompanied by a 23 page manual which explains the set ups, risk management, model philosophy and much more. I hold a webinar once a week where I review and share my set ups. I have been told by subscribers that this model/”GPS” tool is one of the best they have seen and they have compared it to services and software packages that can cost much more.

The Diamond ALGO and indicators family, can be applied to any market at any time frame!

To get started simply send me an email and if you are a client please include the following:

  1. What trading platform you are using?
  2. Who is the broker you are working with here at Cannon?
  3. If you have sierra or ATcharts, what is your user name?

If you are NOT a client of Cannon, please share the following:

  1. What trading platform you are using?
  2. markets you trade?
  3. What charts you are using?
  4. If you have sierra or ATcharts, what is your user name?

Rule 4.41 – Hypothetical or simulated performance results have certain limitations. Unlike an actual performance record, simulated results do not represent actual trading. Also, since the trades have not been executed, the results may have under-or-over compensated for the impact, if any, of certain market factors, such as lack of liquidity. Simulated trading programs in general are also subject to the fact that they are designed with the benefit of hindsight. No representation is being made that any account will or is likely to achieve profit or losses similar to those shown.

Continue reading “Futures Trading Levels, Mini S&P Screenshots with Diamond Algorithm”

Futures Trading Levels, Trade Support and Decision Model: Diamond Algorithm

Cannon Trading / E-Futures.com

Many of you have been to my “daily webinars” or saw some screen shots with the DIAMONDS indicators etc..

Many of you have asked if these indicators/models are available as a software or available for different markets during different times.

I can now tell you that it is available as a tool that you can use on your own, at your own convenience and time for different markets and different time frames.

I like to share with you what I believe is a GREAT trade support and decision model. The model which can be used as a mechanical buy/sell trigger as well as an aid while day-trading and/ or SWING trading the markets is available for free trial.

I have developed this model which is a family of studies and the “DIAMOND” algorithm. I have spent over 2 years developing this model and now I have made them available through Sierra / AT charts for a free trial.

If you are a Cannon Trading client, the cost after the two week trail is $119 per month which can be deducted from your account. If you are not a client the cost is $299 per month.

The Diamond ALGO package provides signals and also can be used as a “GPS” for trading methodology. It is accompanied by a 23 page manual which explains the set ups, risk management, model philosophy and much more.

I hold a webinar once a week where I review and share my set ups. I have been told by subscribers that this model/”GPS” tool is one of the best they have seen and they have compared it to services and software packages that can cost much more.

Below are two signals from June 2011, the first chart is an intraday chart of the crude oil market, the second chart is a daily chart of Natural Gas.

Intraday Chart of Crude Oil from June 17th 2011

Crude Oil Trading chart levels for Friday June 17th, 2011

Daily Chart of Natural Gas June 17th 2011

Natural Gas trading chart levels for Friday June 17th, 2011

The Diamond ALGO and indicators family, can be applied to any market at any time frame!

To get started simply send me an email and if you are a client please include the following:

  1. What trading platform you are using?
  2. Who is the broker you are working with here at Cannon?
  3. If you have sierra or ATcharts, what is your user name?

If you are NOT a client of Cannon, please share the following:

  1. What trading platform you are using?
  2. markets you trade?
  3. What charts you are using?
  4. If you have sierra or ATcharts, what is your user name?

Rule 4.41 – Hypothetical or simulated performance results have certain limitations. Unlike an actual performance record, simulated results do not represent actual trading. Also, since the trades have not been executed, the results may have under-or-over compensated for the impact, if any, of certain market factors, such as lack of liquidity. Simulated trading programs in general are also subject to the fact that they are designed with the benefit of hindsight. No representation is being made that any account will or is likely to achieve profit or losses similar to those shown. Continue reading “Futures Trading Levels, Trade Support and Decision Model: Diamond Algorithm”

Futures Trading Levels, Sierra Charts and the Webinar

Cannon Trading / E-Futures.com

Quadruple witching tomorrow!

Also below you will see a screen shot from my intra-day sierra chart template. The template includes some proprietary studies, conditions and algorithm I have worked on over the past couple of years. If you would like to get a trial to the family of studies and you have sierra charts/ ATcharts, please email me your user name for the charts, your name, email, tel number and any information about your trading background and goals.

I will then authorize the studies and send you info on how to use and plug into sierra charts. These indicators are available for webinar subscribers at no extra charge and if you like to get the package as a Cannon Trading client, cost after free trial is $119 per month. If you are not a Cannon client, cost is $299 per month. Continue reading “Futures Trading Levels, Sierra Charts and the Webinar”