Futures Trading Levels, Types of Trading Days

Cannon Trading / E-Futures.com

The following is taken from a guide I have written that helps subscribers to my daily chart service. You can have a 2 week free trial to the daily live charts service along with buy/sell triggers and get the full guide along with chart examples, rules and much more by signing up at:

Cannon Trading Inc. Day Trading Webinar

General Notes:
At any given day, one must understand the trading environment that specific day has to offer and adjust their trading style accordingly. In our case it relates more to the size of stops and target based on volatility. Some days the market gives us many opportunities; some not as much; and some days it provides us with mostly risks…….take what the market gives you and not what you want it to give…..

I think if a trader understands early enough what type of trading day it is, he or she can choose which tools from the webinar are most suited for that days trading. If one can do that successfully (which is not easy), I think that is half the battle.

Not taking a trade is better than a bad trade.

My opinion is that there are 3 main types of trading days.

  1. Most common is two sided trading action with swings up and down – this type of trading day is most suitable for the main aspect of this model, which is taking trades based on the arrows.
  2. Strong trending day, mostly one directional – this type of trading day is the least common, many times this will happen on Mondays and maybe 3-5 times a month at most – this type of trading day is most suitable for using the color scheme I have on the charts. Green bars mean strong up trend, red bars mean strong down trend. If you determined that this is a trend day, then use pull backs to enter with the direction of trend and use the parabolic (little dashes) as you trailing stop.
  3. Slow and/ or choppy trading day – this type of trading day is best suited for taking small profits from the market by either using the main model or taking the diamonds as entry signal, and going for quick profits and tight stops.

Continue reading “Futures Trading Levels, Types of Trading Days”

Futures Trading Levels, Bearish Actions in Today’s Trading

Cannon Trading / E-Futures.com

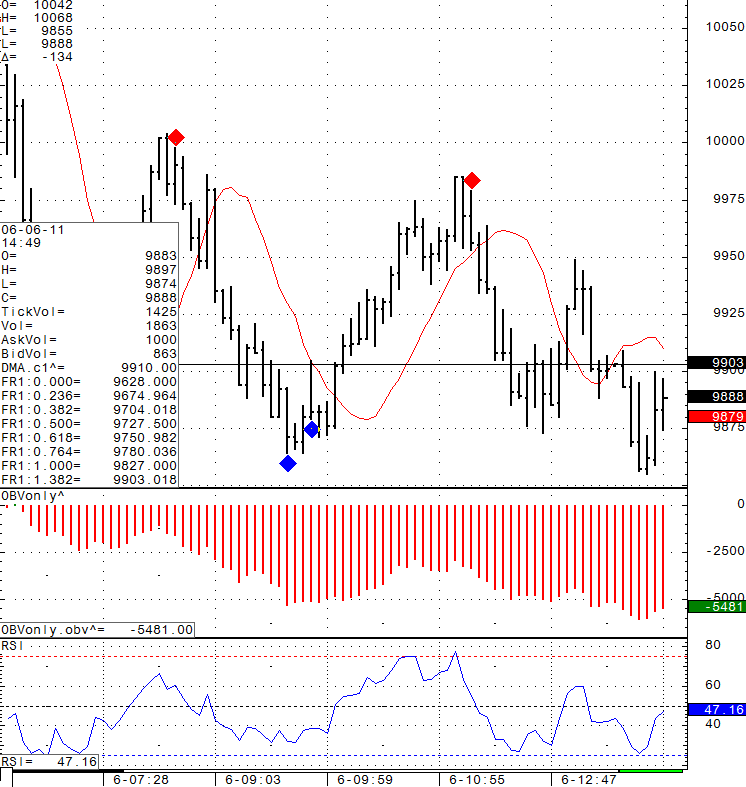
Hourly chart of mini SP 500 for review below. price action in the last hour of trading today was bearish so it will be interesting to watch the 1300 level ahead of tomorrows session. Continue reading “Futures Trading Levels, Bearish Actions in Today’s Trading”

Futures Trading Levels, Risk/Reward Factor in Volatile Markets

Cannon Trading / E-Futures.com

Markets in general are experiencing higher volatility due to multiple factors, ranging from situation in Japan, economic numbers, Mid East and crude oil situation and more…

Understanding the risk before you enter the trade, deciding if the risk/ reward is worth it, accepting it and then letting the trade/market do its things is even more important in times like this.

Wishing all of you a great weekend and successful trading next week.

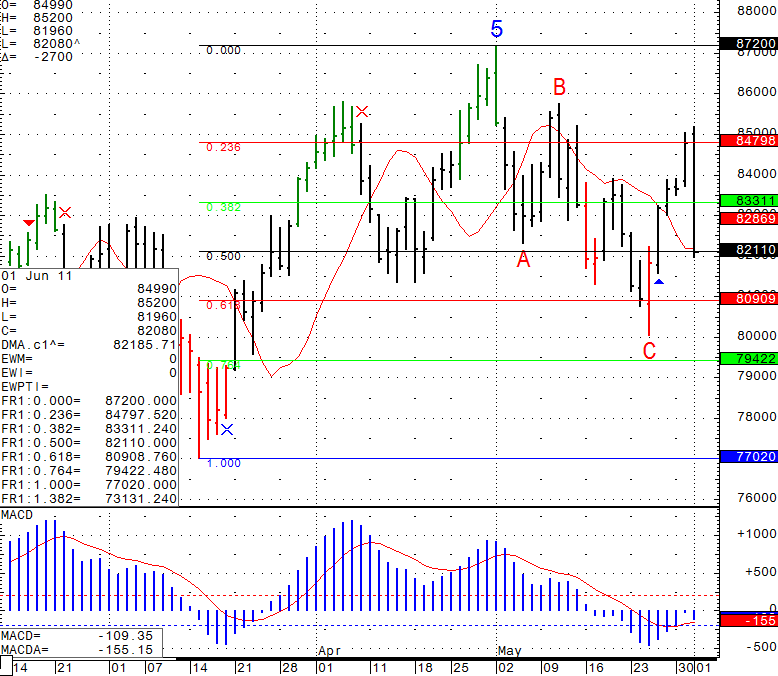
Daily chart of the volatile Crude Oil futures for your review below: Continue reading “Futures Trading Levels, Risk/Reward Factor in Volatile Markets”

Futures Trading Levels, The FIB Retractment Level is the Pivot of Corrections

Cannon Trading / E-Futures.com

Big push up today on stocks but less than average volume.

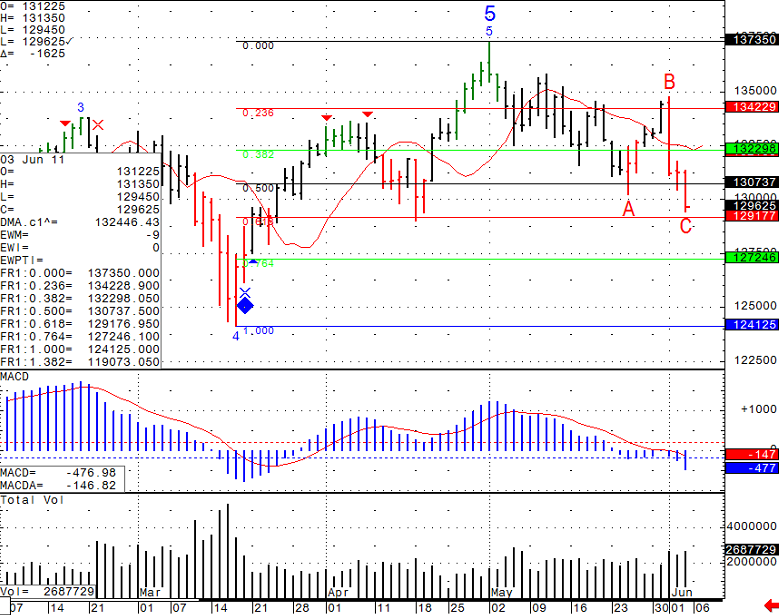
Daily chart below of the mini SP 500 shows that 1310.50 is the 76.4% FIB retractment level, which I have noticed many times to be the pivot of corrections. So price action around this level will be important to watch. A break below 1297 may suggest that this bounce is just a bounce….Futures will tell…..and in our business the future is some times measures in hours, minutes even seconds…. Continue reading “Futures Trading Levels, The FIB Retractment Level is the Pivot of Corrections”

Futures Trading Levels, Trading Psychology

Cannon Trading / E-Futures.com

Below is a daily chart of the mini SP 500 for your review.

Daily E-Mini S&P 500 futures trading chart screenshot from today March 22th 2011

Stock futures trading chart levels Tuesday March 22th 2011

Also few “Mental pointers” as refreshers. These pointers are taken from a 23 page guide I recently finished which serves as a guide to the daily chart service I offer:

Quick Pointers on the Vast Subject of Trading Psychology
Trading is SO MUCH MENTAL, once you have a concept you believe in, have confidence in it. After that there is a lot of psychological work….

Some examples:

  1. Ability to take losses and know not every trade will be a winner and not every day will be a winner
  2. Ability to stay patient and NOT feel that if you are NOT trading, you are NOT doing your job….
  3. The confidence to stay in winning trades and the discipline to get out of losing trades
  4. Allowing trades some time to work
  5. Not getting down on yourself for “could have should have etc”

Being a hard worker and keeping a journal after certain trading days can only be beneficial for yourself. Being a hard worker, putting in the time and effort to learn new approaches and set ups before deciding if it’s worthy or not.

To get this 23 page guide along with a free trial to my daily chart service where I share set ups for mini SP500, Crude oil and Euro currency please visit our website. Continue reading “Futures Trading Levels, Trading Psychology”

Futures Trading Levels, Geo-Political Events and Your Trading Mind Frame

Cannon Trading / E-Futures.com

Big overnight moves as political and other events around the world are moving the markets.

Regardless of Geo-Political events, always keep in mind the time frame YOU are trading, the set ups you like, your trading style and matching money management etc.

STAY DISCIPLINED at all times, don’t let the market put you to sleep and know when your personal environment is distracting you from trading and be disciplined enough NOT to trade when this happens.

Below is a daily chart of the mini SP 500 for your review. Continue reading “Futures Trading Levels, Geo-Political Events and Your Trading Mind Frame”

Futures Trading Levels, Mini SP500 Chart and No Economic Reports

Cannon Trading / E-Futures.com

Hourly chart of mini SP500 for your review below.

As we head into tomorrows session I will be watching to see how price action behaves around 1274.50 and/ 1261.50 depending where we will visit first maybe even during the overnight session.

I will be watching for strength/weakness, follow through and momentum in order to decide on which way to approach this market on Friday. Continue reading “Futures Trading Levels, Mini SP500 Chart and No Economic Reports”