SP 500 Futures Testing Major Support Zone – Levels & Reports for 8.8.2014

Hello Traders,

For 2014 I would like to wish all of you discipline and patience in your trading!

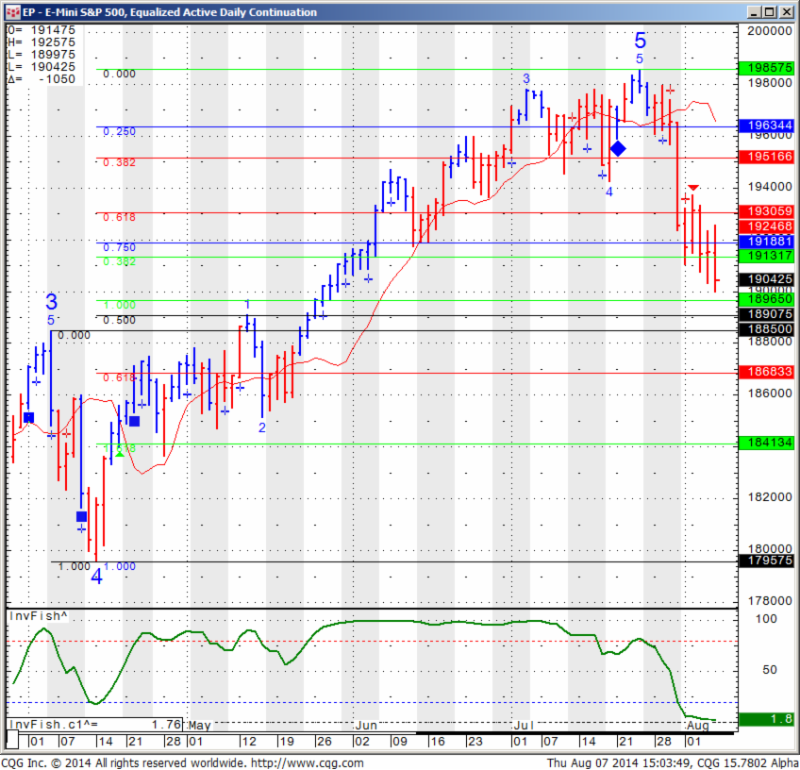
SP 500 made new lows and about to test a series of support levels as one can see in the daily chart below:

We have few levels of support between 1885 and 1896.50 in case we break again below the psychological 1900 mark.

I mentioned a couple of days ago support of 1795 by mistake and was asked by few of the readers. That was a typo the support I meant to write is 1895.

Looks like we will visit that level and zone very soon, maybe as early as night session. My best guess is for an initial bounce of that level. Just a guess. Either way I will look to see what kind of reaction we get if and when we get down there.

A strong bounce may signal some more upside, however a break below 1895-1885 level may actually make my 1795 typo into a reality… 822

Continue reading “SP 500 Futures Testing Major Support Zone – Levels & Reports for 8.8.2014”

Volatility Returns to Stock Index Futures – Levels & reports for August 5th

Hello Traders,

For 2014 I would like to wish all of you discipline and patience in your trading!

As I do from time to time, I like to share resources I feel are worthy of exploring, such is the one below by www.factset.com :

Overview:

  • US equities came under pressure this week as the S&P 500 suffered its biggest weekly pullback in over two years. Despite the magnitude of the move, there was not an overriding theme that captured the price action.
  • Widely cited headwinds included Fed angst, geopolitical tensions, disappointing earnings, the latest flare-up on the Eurozone periphery, the slowdown in the housing recovery, Argentina’s default, fatigue, technical and continued worries about stretched valuations and crowded trades.
  • However, there were notable pockets of reprieve surrounding some of these concerns, particularly when it came to monetary policy and earnings. In addition, geopolitics has not proved to be a sustainable directional driver, while the tipping point search has been in play for a while.
  • While largely on the backburner, there were some positive dynamics at work this week. The pickup in strategic M&A activity continued, while there more signs of stabilization in China, where the Shanghai Composite bucked the sell off in global equities with a nearly 3% rally.
  • There did not seem to be any great signals from the sector performance this week with the broad-based nature of the risk-off trade and company-specific takeaways from a very busy week of earnings. Energy and industrials put in the worst performance, while telecom held up the best.

Fed angst finds some reprieve:

  • Worries about the Fed being behind the curve and the potential for an earlier and more aggressive start to the policy normalization process continued to get a lot of attention as a source of market angst this week. There were two particular areas of focus. One was the 4% growth in Q2 GDP, which was a full point ahead of the consensus. The other was the 0.7% increase in the Q2 employment cost index (ECI), which was ahead of the 0.5% consensus and marked the fast growth in six years. The hotter ECI print was of particular interest because it followed on the heels of an FOMC statement that hedged an upgrade of the assessment of the labor market by noting that a range of indicators suggest a significant underutilization of labor resources. However, there was some reprieve late in the week as average hourly earnings were flat in July, leaving them up just 2.0% y/y. This compared to expectations for a 0.2% m/m and 2.2% y/y increase. In addition, while a sixth straight month of nonfarm payrolls growth above 200K kept the recovery traction theme in focus, the 209K was slightly below expectations and not robust enough to impact liftoff expectations. Finally, despite the hype surrounding Fed fears, yields in the front and belly of the curve were actually lower on the week.

Continue reading “Volatility Returns to Stock Index Futures – Levels & reports for August 5th”

Market News Recap and Economic Reports 7.29.2014

Hello Traders,

For 2014 I would like to wish all of you discipline and patience in your trading!

As I often do on Mondays, I like to share a recap of the previous week fundamentals as well as factors that will impact trading for this week from TradeTheNews.com:

TradeTheNews.com Weekly Market Update: Earnings, Wars and Data

– Global markets vacillated between earnings and geopolitical conflict this week. There was a steady drumbeat of negative news out of Israel and eastern Ukraine, with bloody headlines countering much of the decent news from quarterly earnings reports. Quarterly reports out of the US and Europe were pretty strong, with only a few earnings disasters weighing on broader indices, though the earnings stinkers were in marquee names such as McDonalds and Amazon. June US housing data was mixed, inflation continues to be very subdued and weekly jobless claims took an unexpectedly big dip, possibly due to seasonality. In Europe, the first reading of UK GDP for Q2 indicated that annualized economic growth was back above 3.0% for the first time since the beginning of the crisis, though this was offset by worse than expected retail sales data. In China, July flash PMI numbers were very good, helping the Shanghai and Hong Kong equity markets handily outperform US and European indices. For the week, the DJIA lost 0.8%, the Nasdaq slipped 0.4%, and the S&P500 was about unchanged.

– June data offered contrasting views of the US housing sector. The June existing home numbers pushed out to eight-month highs and the May figures were revised slightly higher. According to the NAR, inventories are at their highest level in over a year and price gains have slowed to much more welcoming levels in many parts of the country. Meanwhile June new homes sales tumbled to 406K from May’s eight-year high of 504K. Quarterly numbers from two home builders also saw some weaker trends: Pulte Homes saw closings and its backlog decline on a y/y basis (although new home orders were up 5% y/y), while M/I Homes saw a y/y contraction in new contracts signed. D.R. Horton, the largest home builder in the US, saw a 15% y/y gain in its backlog and a 25% gain in net orders.

– Inflation is still not showing up to the party, according to the June CPI data out this week. The increase in the headline CPI index was mild enough to keep the y/y growth rate unchanged at 2.1%, while the y/y growth rate of the core fell to 1.9%. Food prices decelerated faster than expected, turning in a flat performance in June after four months of growth. Energy prices were up less than expected.

– Fighting raged all week in eastern Ukraine, with pro-Russia forces shooting down more military aircraft and Russia supplying more heavy weapons. More EU sanctions on Russia appeared imminent, with action expected by the end of July. Sanctions could include a ban on investment in Russian banks, an arms ban (but not retroactive, allowing France to deliver contracted Mistral warships) and some form of energy sector sanctions. On Friday, EU President Van Rompuy was urging member states to restrict sale of technology to the Russian oil sector while excluding the gas sector from sanctions, which sent oil and gas futures in divergent directions. On Friday, the Russian central bank raised its key rate by half a point to 8%, citing heightened geopolitical risks to the ruble.

– A federal appeals court overturned a lower court ruling that allowed subsidy payments under the Obama care reforms. The ruling voids the regulations that allow subsidies for insurance that is purchased through federal exchanges. Most commentators agreed that with several similar cases outstanding and more rulings to come, this decision was not terminal for the ACA.

Continue reading “Market News Recap and Economic Reports 7.29.2014”

3 Points to Futures Trading Psychology & Economic Reports 7.25.2014

Hello Traders,

For 2014 I would like to wish all of you discipline and patience in your trading!

Many different ways to make and lose money trading futures, even more so when day trading.

Today’s action in stock index futures led me to write about:

Three main approaches out there in my opinion.

  1. The first is what I call the “trend is your friend”. A trader looks at few different time frames, looking to see if there is an established trend on longer time frame (example 60 minutes chart) and then trying to look for pull back on lower time frames and “join the trend”. Only works for certain markets and only works few times of the month as most days markets do not have an intraday trend.
  2. Second method is what we call break out. Traders will look for markets that have been in a lower volatility situation using indicators such as ADX for example. Then they will look at the chart to find what they feel are levels that if broken can fuel a stronger move in the same direction. These levels can be extracted visually looking at the chart or using highs/ lows of X periods. This method works better on some markets than others. I noticed that crude oil and gold futures tend to have better chances of a continued breakout move than the mini SP 500 for example.
  3. The third one many traders use and believe in is “mean reversion”. Stock index futures in my opinion will fall into this category many trading days and today’s session ( July 24th 2014) was a good example. Market tested yesterday’s highs, then tested lows and traded in between. Traders will sometimes use RSI or Williams %R to get a feel for when the market gets away from the mean and will use counter trend methods in this case. Use of stops when counter trend trading is even more important as you do NOT want to get caught on the few days a month when these markets do incur a break out situation…..

Continue reading “3 Points to Futures Trading Psychology & Economic Reports 7.25.2014”

Futures Levels and Economic Reports 7.24.2014

Connect with Us! Use Our Futures Trading Levels and Economic Reports RSS Feed.

Like us on FacebookFollow us on TwitterView our profile on LinkedInFind us on Google+Cannon Trading Futures Trading Resistance & Support Levels and Economic ReportsFind us on Yelp

1. Market Commentary
2. Futures Support and Resistance Levels – S&P, Nasdaq, Dow Jones, Russell 2000, Dollar Index
3. Commodities Support and Resistance Levels – Gold, Euro, Crude Oil, T-Bonds
4. Commodities Support and Resistance Levels – Corn, Wheat, Beans, Silver
5. Futures Economic Reports for Thursday July 24, 2014

Hello Traders,

For 2014 I would like to wish all of you discipline and patience in your trading!

Getting Clues from other markets?

When day trading a specific market do you only look at the chart for that specific market? Maybe you took it a step further and you are viewing multiple time frame charts for the same market which is a good step in my eyes.

Now lets take this even one step further by observing what markets have correlation, direct or inverse to the market you are trading, perhaps this can help you make decisions when trading.

I will give a few examples from my experience:

When I am in a position in the mini SP 500, I will often observe what the bonds are doing ( many times inverse correlation), I will take notice of what the Dow, Russell and NASDAQ are doing as well ( direct correlation).

If I am trading crude oil, I will many times pay attention to what unleaded gas and heating oil are doing (very close, although not direct correlation) as well as what WTI crude is doing.

One more example may be when I have a position trade in beans and I will try to get a feel for the overall direction of the grain markets (is there a trend? are they sideways?) by looking at corn, wheat in general and then look to see what bean oil and soy meal which are by products of beans are doing.

One question that can be asked is “what do you mean observe this or that market”? and a good example will be:

Lets say I am short the mini SP 500 and I am not sure if to take profit or not. I look at the mini Russell and see that mini Russell just made new lows, that will give me more confidence to stay in my short position as I feel there might be more room to the downside.

Continue reading “Futures Levels and Economic Reports 7.24.2014”

Cannon Trading Releases New Futures Trading Platform, Shogun Trade Executor 7.09.2014

Cannon Trading Releases New Futures Trading Platform, Shogun Trade Executor™

Cannon Trading launches Shogun Trade Executor™, a futures platform that provides a cutting edge experience for futures traders and combines 25 years of experience into a simple trading platform. Set apart by its access to unfiltered data and statistical analysis, Shogun Trade Executor™ is the perfect program for traders who want to improve their game.

Beverly Hills, California (PRWEB) July 08, 2014

http://www.prweb.com/releases/cannon-trading/shogun-trade-executor/prweb11998947.htm

Cannon Trading Co, Inc., an Independent Introducing Brokerage firm, is releasing its latest futures trading software, Shogun Trade Executer,™ a trading platform tailored to provide the most cutting edge user experience for futures traders.

The new software allows traders to benefit from the company’s 25 years of experience and compiles a user-interface that is both intuitive and highly functional. What separates Shogun Trade Executor™ from the other platforms lies in a few different levels of trading mechanics.

“Besides single click orders, Shogun Trade Executor™ offers tools to help the trader regulate himself and observe his statistics. With an implemented daily loss limit, a trader can now stay disciplined and set daily loss limits to protect profits and/ or limit losses for any given day, directly from the platform,” says Mike Levy, President, Cannon Trading.

“At the end of the day, users can study themselves as traders and observe their own individual trading statistics. Shogun Trade Executor™ provides free charting with over 100 technical indicators, trading algorithms, and unfiltered historical data,” he adds.

These are just some of the features that separate Shogun Trade Executor™ from other platforms. For more information and to actually try it out, traders can start with no cost Demo version.

As the industry has changed, Cannon has always been mindful of the evolving environment and has always kept customer interests in mind. The brokers at Cannon Trading look forward to finding out whether the futures trading landscape is something that will work for customers.

Cannon Trading has consistently tried to be a place where the traders and brokers work together as a team to assist clients in any way possible.

The result is a unique and progressive infrastructure that enables them to meet the varied needs of our clients with tailored services and execution.

Cannon Trading Company has won a Customer Service Finalist of 2003 Readers Choice Award, and the brokers have been quoted in SFO, Futures Magazine and Bloomberg. The Company is a proud member of the NFA andCFTC since 1988.

Visit the website and take advantage of many of the offers and educational tools.

Good Trading

Contact Details:
Name: Cannon Trading Co, Inc.
Email-id: info(at)cannontrading(dot)com
Address: 9301 Wilshire Blvd. Suite 515 Beverly Hills, CA 90210
Phone Number: (800)-454-9572
Website: https://www.cannontrading.com

TRADING COMMODITY FUTURES AND OPTIONS INVOLVE SUBSTANTIAL RISK OF LOSS. THESE ARE RISKY MARKETS AND ONLY RISK CAPITAL SHOULD BE USED. PAST PERFORMANCES ARE NOT NECESSARILY INDICATIVE OF FUTURE RESULTS.

Futures Trading Advice for Beginners Infographics

Do you often find yourself overwhelmed by the game of numbers that dictates the nerves of the markets? Are you often perplexed by the amusing gains and losses that investors count their wealth by? Here is an interesting way to understand commodities and trading, for all those who are inquisitive about the art of investment. In case you think commodities can be your ticket to extra earnings, the infographic presents some hard facts that you ought to rote before you fall in the temptation of trading. That said, once you have the basics by your side and the facts by your fingers, trading in commodities can be another asset class to consider.

The infographic that Cannon presents, is a graphic insight into how investing in commodities through futures should be done. It also establishes certain general tips one can follow when trading futures. The infographic uses basic examples from day to day life to explain difficult concepts of trading, a matter that generally requires expert intervention or hours of discussion so as to understand thoroughly. The basic features of futures trading have also be highlighted in the simplest possible manner, through this infographic made by Cannon Trading.


Futures Trading Infographics
This Infographic created by:: Cannon Trading

Continue reading “Futures Trading Advice for Beginners Infographics”

Futures Market Volatility News 4.29.2014

Connect with Us! Use Our Futures Trading Levels and Economic Reports RSS Feed.

Like us on FacebookFollow us on TwitterView our profile on LinkedInFind us on Google+Cannon Trading Futures Trading Resistance & Support Levels and Economic ReportsFind us on Yelp

1. Market Commentary
2. Futures Support and Resistance Levels – S&P, Nasdaq, Dow Jones, Russell 2000, Dollar Index
3. Commodities Support and Resistance Levels – Gold, Euro, Crude Oil, T-Bonds
4. Commodities Support and Resistance Levels – Corn, Wheat, Beans, Silver
5. Futures Economic Reports for Tuesday April 29, 2014

Hello Traders,

For 2014 I would like to wish all of you discipline and patience in your trading!

TradeTheNews.com Weekly Market Update: Russia Menaces Ukraine, Squelches Earnings Enthusiasm

Fri, 25 Apr 2014 16:08 PM EST- US equity markets bounced erratically between earnings enthusiasm and Ukraine-induced fear this week in a low-volume, post-Easter holiday environment. Strong quarterly results from major tech names and Dow components helped push indices higher, with Apple and Facebook the particular standouts. In addition, several huge merger deals in the pharmaceutical space also helped risk appetite. But the steady deterioration in the Ukraine situation dragged things lower and the continuing rotation out of momentum names whipped around the Nasdaq all week. For the week, the DJIA is down 0.3%, the S&P500 is off 0.1% and the Nasdaq fell 0.5%.

– The Ukraine crisis deepened this week as Kiev pressed its “anti-terrorist” operations in Eastern Ukraine and Russia conducted “military exercises” along the border. At one point, Russian armor was said to have moved in force to within one kilometer of the border, inspiring real fears that the invasion was imminent. Russia President Putin called the use force against pro-Russian forces in Ukraine “a crime” that will have consequences, while Russia’s UN ambassador went as far as invoking a nation’s right to self-defense under the UN charter as a justification for potential direct intervention in Ukraine. Officials in Kiev warned that any Russian incursions would be met directly with military force, while the Western powers convened on Friday to discuss arranging possible sanctions on the broader Russian economy.

– New home sales in the US tumbled to eight-month low in March, dropping 14.5% y/y. However the January and February totals were revised up 3% and 2%, respectively. Affordability is likely becoming a big factor for the market: the median new home price rose to a record high of $290K, up 13% y/y.

– Front month WTI crude lost over 3% this week, dropping from nearly $104 to just above $100 on profit taking. Concerns about further builds in US crude oil inventories overshadowed tensions between Russia and Ukraine. Last Wednesday, the EIA weekly report showed that US crude inventories were only 3.4 million barrels below the peak reached in May 2013. This week’s EIA report pushed US crude oil inventories above the 2013 high to 397.7 million barrels, levels not seen in 80 years.

– Excellent earnings from Apple, Facebook and Netflix could not save the Nasdaq from Amazon and the continuing rotation out of hot tech stocks this week. Both Facebook and Apple beat earnings and revenue targets, while Apple crushed expectations for iPhone shipments and boosted capital returns to shareholders. Facebook saw solid gains in user metrics and an 82% y/y gain in advertising revenue. Netflix sustained decent metrics and met expectations. Apple sustained 8% gains on the week, while gains in FB and NFLX evaporated rapidly. Amazon dropped 5% on the week after operating income shrank y/y and the firm’s second quarter revenue guidance fell short of consensus expectations. Microsoft offered solidly in-line, vanilla results.

– Results from the big US automakers were hampered, like everything else, by bad weather, although there were some self-inflicted wounds as well. General Motors beat earnings forecasts, despite a big decline in profits due to its recent recalls. Ford’s first quarter profit was down from the same period last year and missed expectations. Caterpillar posted a quarterly profit that topped analysts estimates and raised its full-year outlook on a stronger-than-expected rebound in sales in the construction industry.

Continue reading “Futures Market Volatility News 4.29.2014”

Futures Market Observations and Economic Reports 4.24.2014

Connect with Us! Use Our Futures Trading Levels and Economic Reports RSS Feed.

Like us on FacebookFollow us on TwitterView our profile on LinkedInFind us on Google+Cannon Trading Futures Trading Resistance & Support Levels and Economic ReportsFind us on Yelp

1. Market Commentary
2. Futures Support and Resistance Levels – S&P, Nasdaq, Dow Jones, Russell 2000, Dollar Index
3. Commodities Support and Resistance Levels – Gold, Euro, Crude Oil, T-Bonds
4. Commodities Support and Resistance Levels – Corn, Wheat, Beans, Silver
5. Futures Economic Reports for Thursday April 24, 2014

Hello Traders,

For 2014 I would like to wish all of you discipline and patience in your trading!

Getting Clues from other markets?

When day-trading a specific market do you only look at the chart for that specific market? maybe you took it a step further and you are viewing multiple time frame charts for the same market which is a good step in my eyes.

Now lets take this even one step further by observing what markets have correlation, direct or inverse to the market you are trading, perhaps this can help you make decisions when trading.

I will give a few examples from my experience:

When I am in a position in the mini SP 500, I will often observe what the bonds are doing ( many times inverse correlation), I will take notice of what the Dow, Russell and NASDAQ are doing as well ( direct correlation)

If I am trading crude oil, I will many times pay attention to what unleaded gas and heating oil are doing (very close, although not direct correlation) as well as what WTI crude is doing.

One more example may be when I have a position trade in beans and I will try to get a feel for the overall direction of the grain markets (is there a trend? are they sideways?) by looking at corn, wheat in general and then look to see what bean oil and soy meal which are by products of beans are doing.

One question that can be asked is “what do you mean observe this or that market”? and a good example will be:

Lets say I am short the mini SP 500 and I am not sure if to take profit or not. I look at the mini Russell and see that mini Russell just made new lows, that will give me more confidence to stay in my short position as I feel there might be more room to the downside.

Continue reading “Futures Market Observations and Economic Reports 4.24.2014”