New Margin Requirements US Dollar Index, Continuous Commodity Index, RJ CRB Index

Please be aware of the following margin requirement changes effective with the opening of business on Tuesday, September 27, 2011 and thereafter. The affected contracts are the US Dollar Index (DX), the Continuous Commodity Index (CI), and the RJ/ CRB Index (CR)

Outright Margin Requirement Changes

Contract New Margin Change
US Dollar Index (DX) 1,500 USD +50 USD
Continuous Commodity Index (CI) 16,000 USD +8,000 USD
RJ/CRB Index (CR) 700 USD +200 USD

New Inter-commodity Spread Credits September 2011

Effective with the opening of business on Tuesday, September 27, 2011 and thereafter are the following New Inter-commodity Spread Credits.

New Inter-commodity Spread Credits

Commodities Position Spread Credit
AUD/CAD(AS) : AUD/USD(KAU) : USD/CAD(SV) long-short-short (1:1:1) 75%
AUD/USD(KAU) : NZD/USD(ZX) : UAD/NZD(AR) long-short-short (4:1:1) 70%
AUD/USD(KAU) : NZD/USD(KZX) : AUD/NZD(AR) long-short-short (4:2:1) 70%
EUR/USD(KEO) : EUR/CAD(KEP) : USD/CAD(SV) short-long-short (1:2:1) 70%
EUR/USD(KEO) : EUR/GBP(KGB) : GBP/USD(MP) long-short-short (2:1:2) 75%
EUR/JPY(KEJ) : EUR/CHF(KRZ) : CHF/JPY(KZY) long-short-short (4:2:1) 90%
EUR/CHF(KRZ) : GBP/CHF(SS) : EUR/GBP(KGB) long-short-short (2:1:1) 80%
EUR/CHF(KRZ) : USD/CHF(MF) : EUR/USD(KEO) long-short-short (2:1:1) 65%
NZD/USD(KZX) : NZD/USD (ZX) long-short (2:1) 100%
EUR/USD(KEO) : US DOLLAR INDEX(DX) long-long(2:3) 75%

Inter-commodity Spread Credit Changes

Commodities Position New Spread Credit Change
EUR/USD(KEO) : EUR/CAD(KEP) : CAD/USD(KSV) long-short-short (2:1:1) 65% -5%
AUD/CAD(AS) : AUD/USD(KAU) : CAD/USD(KSV) long-short-long (1:3:1) 70% +5%
Russell 1000 Index Mini (RF) : Russell 1000 Index Growth Mini (RG) long-short (1:1) 90% +5%
Russell 1000 Index Growth Mini (RG) : Russell 1000 Index Value Mini (RV) long-short (1:1) 90% +5%
Russell 2000 Index Mini (TF) : Russell 1000 Index Mini (RF) long-short (1:1) 85% +10%
Russell 2000 Index mini (TF) : Russell 1000 Index Growth Mini (RG) long-short (1:1) 80% +10%
Russell 2000 Index Mini (TF) : Russell 1000 Index Value Mini (RV) long-short (1:1) 85% +15%

High Market Volatility as Shown by S&P 500 Pit Session | Support and Resistance Levels

In this post:

1. Market Commentary
2. Support and Resistance Levels
3. Daily Mini S&P 500 Futures Chart
4. Economic Reports
5. Earnings Releases

divider black 190

1. Market Commentary

Days like today and yesterday encourage me to repeat what I wrote yesterday:

ALWAYS EXPECT THE UNEXPECTED! When volatility skyrockets like now, moves become extreme, the speed of the market really picks up and this is when one must adjust their trading size lower to accommodate for the wilder and wider moves.

Below is an hourly chart of SP500 pit session. Notice the gaps we have from overnight moves.

I think if we can break 1132, market may have a shot at closing the gap all the way up at: 1155 Continue reading “High Market Volatility as Shown by S&P 500 Pit Session | Support and Resistance Levels”

FOMC Day Aftermath: Volatility in the Markets | Support and Resistance Levels

In this post:

1. Market Commentary
2. Support and Resistance Levels
3. Daily Mini S&P 500 Futures Chart
4. Economic Reports
5. Earnings Releases

divider black 190

1. Market Commentary

Note to our clients who are trading with TransactAT:

The latest version is now TransactAT 5.2.2 (download). The newer version can be installed over the older version. Please contact you broker if you need any help.

FOMC came like a hurricane as the market sold off sharply after the announcement with some heavy volume.

Last couple of days I shared my mini Russell 2000 chart along with the potential sell at 693 and target at 673. This trade idea is completed.

Below you will see my mini SP chart with potential levels both below and above as my guess is we will see volatility going both directions.

ALWAYS EXPECT THE UNEXPECTED! When volatility skyrockets like now, moves become extreme, the speed of the market really picks up and this is when one must adjust their trading size lower to accommodate for the wilder and wider moves. Continue reading “FOMC Day Aftermath: Volatility in the Markets | Support and Resistance Levels”

New Version of TransactAT is Available | Support and Resistance Levels

In this post:

1. Market Commentary
2. Support and Resistance Levels
3. Daily Mini S&P 500 Futures Chart
4. Economic Reports
5. Earnings Releases

divider black 190

1. Market Commentary


Front month for Equities (eminis), currencies, bonds and financials and many other markets is now December. You should not be trading almost any September contract of any market.

Note to our clients who are trading with TransactAT:

The latest version is now TransactAT 5.2.2 (download). The newer version can be installed over the older version. Please contact you broker if you need any help.


We started the week right where we left the last one….overnight gaps due to news from Europe ( Greece this time), moves both ways with volatility actually dying out during the day session.

I have a “small sell signal” if we can break below 1186 on Dec. Mini Sp with targets coming at 1166 and 1148. Continue reading “New Version of TransactAT is Available | Support and Resistance Levels”

Front Month for Futures Contracts is now December | Support and Resistance Levels

In this post:

1. Market Commentary
2. Support and Resistance Levels
3. Daily Mini S&P 500 Futures Chart
4. Economic Reports
5. Today’s Highlighted Earnings Releases

divider black 190

1. Market Commentary

Front month for Equities (eminis), currencies, bonds and financials and many other markets is now December. You should not be trading almost any September contract of any market.

Have a great weekend and if you like to have access to chart templates like the one below, along with my DIAMOND ALGO ( e-mini SP from today’s session), keep reading: Continue reading “Front Month for Futures Contracts is now December | Support and Resistance Levels”

New Front Month – Futures Trading Rollover Day for Minis and Currencies Tomorrow | Support and Resistance Levels

In this post:

1. Market Commentary
2. Support and Resistance Levels
3. Daily Mini S&P 500 Futures Chart
4. Economic Reports

divider black 190

1. Market Commentary

FRONT MONTH FOR EQUITIES IS DECEMBER. THE SEPTEMBER MINI SP ( AND OTHER MINIS WILL STOP TRADING TOMORROW MORNING!! ALSO CURRENCIES WILL ROLLOVER TO DECEMBER TOMORROW. PAY ATTENTION AS DELIVERIES AND MISTAKES CAN BE QUITE COSTLY.

SYMBOL FOR DECEMBER IS Z

As far as price direction, I am still not sure how to attack this market (outside of quick day-trades which I review live). We are against some resistance levels on the daily chart and I am curious to see the market reaction as the September contract is few hours from expiration.

When in doubt, it’s best to stay out, even more so in trading. I think that many successful traders will agree that the trades you DON’T take are probably more important than the ones you do. Continue reading “New Front Month – Futures Trading Rollover Day for Minis and Currencies Tomorrow | Support and Resistance Levels”

Gaps in the Underlying Asset for the Mini S&P 500 | Support and Resistance Levels

In this post:

1. Market Commentary
2. Support and Resistance Levels
3. December Mini S&P 500 Continuous Futures chart
4. Economic Reports

divider black 190

1. Market Commentary

FRONT MONTH FOR EQUITIES AND BONDS IS DECEMBER

SYMBOL FOR DECEMBER IS Z

When looking at the pit SP 500 ( or what some call the “big SP” as each point is $250 or one big SP = 5 emini sp….) what we see is plenty of GAPS.

These GAPS are a result of overnight moves ( the PIT SP follows the cash stock index of SP500, which is the underlying asset for the future contracts. It is one of the reasons that GAPS on the SP are watched by certain traders and there is a saying ” all GAPS get filled” and if I may add, the question is really when….

Below is an SP500, pit session, hourly chart for your review. I marked the few gaps we had recently with circles. The diamonds that appear are my condition/ ALGO that I have programmed and in this case, the red diamond alerts me for a potential sell for the night session/ early trading tomorrow. Continue reading “Gaps in the Underlying Asset for the Mini S&P 500 | Support and Resistance Levels”

New Week Begins With Continued Futures Market Volatility | Support and Resistance Levels

In this post:

1. Market Commentary
2. Support and Resistance Levels
3. December Mini S&P 500 Continuous Futures chart
4. Economic Reports
5. Highlighted Earnings Releases

divider black 190

1. Market Commentary

FRONT MONTH FOR EQUITIES AND BONDS IS DECEMBER

SYMBOL FOR DECEMBER IS Z

We started the new week, right where we left off. With volatile moves in both directions.

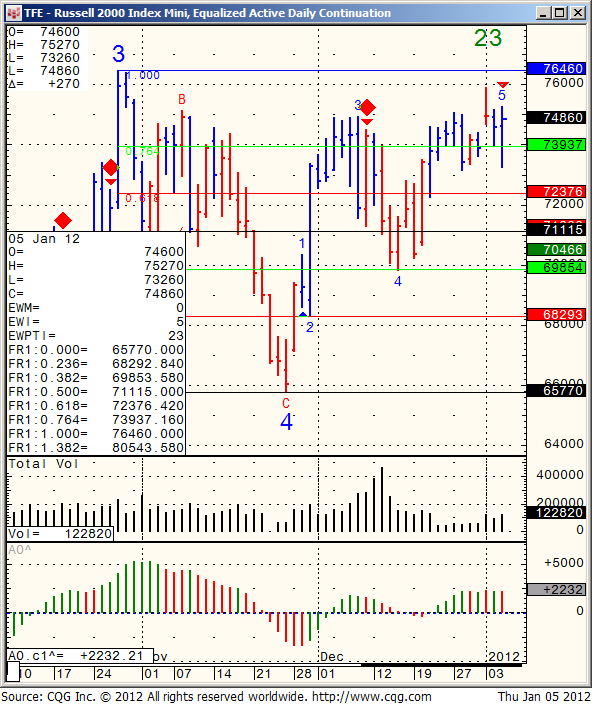
I am sharing my daily Dec. mini Russell 2000 chart with you below.. It seems that at times, the Russell 2000 index has been the leader in the moves of the general stock market. We are currently in a very wide range (volatility definitely expands the “bands”) 739 on top and 654 below.

We are currently closer to the bottom level, hence we may see some more upside before we see sellers step back in. In all honesty, I do NOT have a strong feel for the market right now and do NOT have a preferred way of trading it based on swing or overnight time frame. When I do have a better feel or direction, i will be happy to share with you.

You can also sign up for my real time intraday charts service. Continue reading “New Week Begins With Continued Futures Market Volatility | Support and Resistance Levels”

Will the Mini S&P 500 See a Meaningful Bounce? | Support and Resistance Levels

In this post:

1. Market Commentary
2. Support and Resistance Levels
3. December Mini S&P 500 Continuous Futures chart
4. Economic Reports
5. Highlighted Earnings Releases

divider black 190

1. Market Commentary

FRONT MONTH FOR EQUITIES AND BONDS IS DECEMBER

SYMBOL FOR DECEMBER IS Z

From a technical perspective, Dec. Mini Sp must hold above 1130.00 to have a chance of a meaningful bounce, a break below that level and we should test 1071.25 which is the equivalent for the Sept. lows of 1077.

Have a great weekend and be ready for a full, volatile trading week coming up.

Dec. mini SP continuous chart for your review below: Continue reading “Will the Mini S&P 500 See a Meaningful Bounce? | Support and Resistance Levels”