Stock Indices React to FOMC with Largest One Day Drop in 4 Months – Aug 1st Levels

Hello Traders,

For 2014 I would like to wish all of you discipline and patience in your trading!

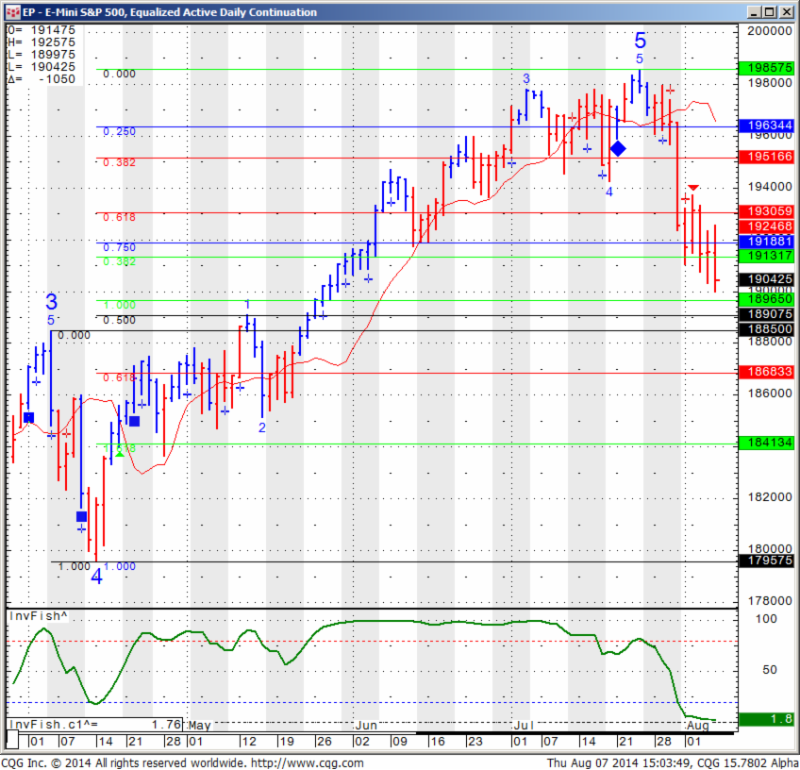
I have noticed many times in the past that the “real direction to FOMC announcements, will usually come the following day”. Today was a perfect example of it…..

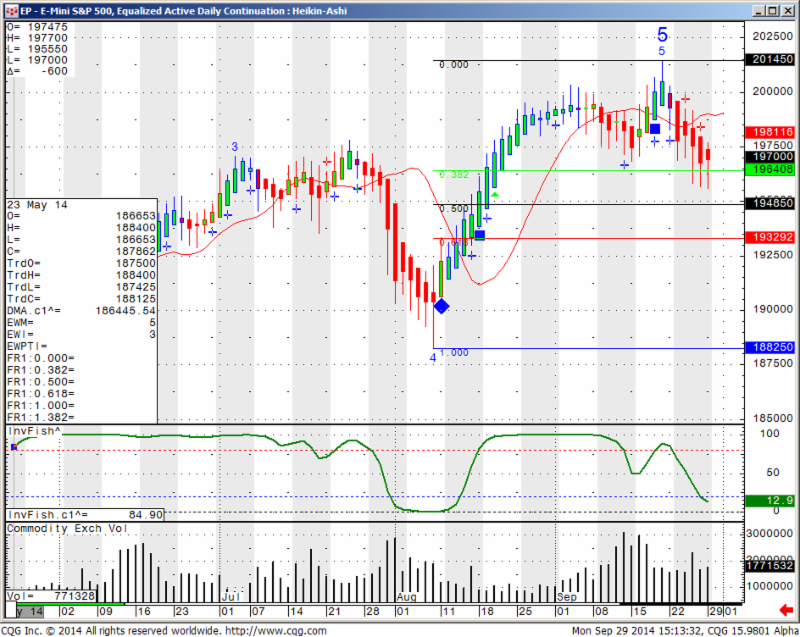
Last time we had a meaningful correction in the SP500 was April 4th. The correction lasted 10 days and measured 90 SP points from peak to valley 1885 to 1795 as you can see in the chart below ( sounds like I am talking about earthquakes….).If symmetry decides to give us a similar reaction we can see 1896 as the next target. In between we have a support zone at 1913 – 1918 first.


Daily chart of the Sept. mini SP 500 with the different levels for your review below:


EP - E-Mini S&P 500 Equalized Active Daily Continuation
EP – E-Mini S&P 500 Equalized Active Daily Continuation

Continue reading “Stock Indices React to FOMC with Largest One Day Drop in 4 Months – Aug 1st Levels”

Earnings Season Started & Economic Reports 07.10.2014

Connect with Us! Use Our Futures Trading Levels and Economic Reports RSS Feed.

Like us on FacebookFollow us on TwitterView our profile on LinkedInFind us on Google+Cannon Trading Futures Trading Resistance & Support Levels and Economic ReportsFind us on Yelp

1. Market Commentary
2. Futures Support and Resistance Levels – S&P, Nasdaq, Dow Jones, Russell 2000, Dollar Index
3. Commodities Support and Resistance Levels – Gold, Euro, Crude Oil, T-Bonds
4. Commodities Support and Resistance Levels – Corn, Wheat, Beans, Silver
5. Futures Economic Reports for Thursday July 10, 2014

Hello Traders,

For 2014 I would like to wish all of you discipline and patience in your trading!


Earnings season has started. Make sure you are aware of when major market movers are reporting.

The calendar can be found at: http://www.morningstar.com/earnings/earnings-calendar.aspx

Today I want to refresh our blog readers with what I call “there is life after mini SP for day-traders….” One of my favorite markets for day-trading is the 30 year bonds.

Too many of our clients trade the mini SP 500 and that’s it. I think that if one has the capital/ time/ knowledge, one should be looking to trade more than one market for purposes of diversification.

Each market has a different personality and behavior is dependent on the time of day when it’s most active.. If you are finding that the ES ( mini SP) is not giving you enough risk/opportunities then start monitoring a couple of other markets and perhaps explore them in the demo / simulated mode.


There are more than a few markets that I think are suitable for day-trading. Below you will find some observations, tips along with what is unique about these markets, their personality and the most active trading hours.


Interest Rates, 10 year and 30 year.


In most platforms, the symbols are ZB for 30 year bonds and ZN for 10 year notes. The current front month is September which is U. So ZBU4 for example.

Product Symbol ZB
Contract Size The unit of trading shall be U.S. Treasury Bonds having a face value at maturity of one hundred thousand dollars ($100,000) or multiples thereof
Price Quotation Points ($1,000) and 1/32 of a point. For example, 134-16 represents 134 16/32. Par is on the basis of 100 points.
Product Symbol ZN


Underlying Unit One U.S. Treasury note having a face value at maturity of $100,000.
Deliverable Grades U.S. Treasury notes with a remaining term to maturity of at least six and a half years, but not more than 10 years, from the first day of the delivery month. The invoice price equals the futures settlement price times a conversion factor, plus accrued interest. The conversion factor is the price of the delivered note ($1 par value) to yield 6 percent.
Price Quote Points ($1,000) and halves of 1/32 of a point. For example, 126-16 represents 126 16/32 and 126-165 represents 126 16.5/32. Par is on the basis of 100 points.
Tick Size
(minimum fluctuation)
One-half of one thirty-second (1/32) of one point ($15.625, rounded up to the nearest cent per contract), except for intermonth spreads, where the minimum price fluctuation shall be one-quarter of one thirty-second of one point ($7.8125 per contract).
Contract Months The first five consecutive contracts in the March, June, September, and December quarterly cycle.

These contracts are often affected by many of the economic reports that come out at 8:30 Am Eastern and there is very active volume between the hours of 8 am EST and 3 PM EST

Volume on both contracts is very good. Ten years will often have 1 million contracts traded per day

(might be the second most active US futures market after the mini SP 500) and the bonds will avg. around 300,000 contracts.

These markets can experience very volatile movements during and right after different reports but then will often trade smooth or in an intraday trend the rest of the day.


If you like the information we share? We would appreciate your positive reviews on our new yelp!! Continue reading “Earnings Season Started & Economic Reports 07.10.2014”

Futures Levels & Economic Reports 7.09.2014

Connect with Us! Use Our Futures Trading Levels and Economic Reports RSS Feed.

Like us on FacebookFollow us on TwitterView our profile on LinkedInFind us on Google+Cannon Trading Futures Trading Resistance & Support Levels and Economic ReportsFind us on Yelp

1. Market Commentary
2. Futures Support and Resistance Levels – S&P, Nasdaq, Dow Jones, Russell 2000, Dollar Index
3. Commodities Support and Resistance Levels – Gold, Euro, Crude Oil, T-Bonds
4. Commodities Support and Resistance Levels – Corn, Wheat, Beans, Silver
5. Futures Economic Reports for Wednesday July 9, 2014

Hello Traders,

For 2014 I would like to wish all of you discipline and patience in your trading!

I am not sure if it is the overbought conditions stock index futures are in, perhaps fear of the start of earning season or maybe it is the tense situation over in Israel/ Middle East – but the result today was one of the more meaningful down days of the last few months along with above avg. volume.


Not sure it is anything more than normal market action after indices made all time highs last week….I am a little more skeptic now days when it comes to the short side of the indices. That been said, if September SP500 can break below 1952 ( just a bit below today’s lows) I think we have higher chances of a continuation lower.

In between, know what time frame you are trading, know your rules, your objectives, accept the fact that you will have good and bad trading days and measure your progress after you define what it is.

Volatility in the S&P Futures Markets and Mini S&P Chart 4.25.2014

Connect with Us! Use Our Futures Trading Levels and Economic Reports RSS Feed.

Like us on FacebookFollow us on TwitterView our profile on LinkedInFind us on Google+Cannon Trading Futures Trading Resistance & Support Levels and Economic ReportsFind us on Yelp

1. Market Commentary
2. Futures Support and Resistance Levels – S&P, Nasdaq, Dow Jones, Russell 2000, Dollar Index
3. Commodities Support and Resistance Levels – Gold, Euro, Crude Oil, T-Bonds
4. Commodities Support and Resistance Levels – Corn, Wheat, Beans, Silver
5. Futures Economic Reports for Friday April 25, 2014

Hello Traders,

For 2014 I would like to wish all of you discipline and patience in your trading!

WOW! Volatility the first 90 minutes of cash open reminded me almost of the summer of 2008…..
Market gaped higher based on APPLE earnings yesterday but when cash opened took a nose dive based on news from Ukraine….

Times like that are dangerous for MOST traders. yes, some of the more experienced or perhaps well capitalized traders look for days like this but for many others the fast and powerful moves can be a little too much…..

My advice? Know who you are as trader, learn to trade with stops, learn to lower your exposure/ trading quantity when volatility picks up and most of all if at any time you feel VERY UNCOMFORTABLE…take a few minutes, step away from the machine, take some deep breaths and decide if and how to continue….

In between see below my mini SP 500 chart ( 8 ticks range chart) along with my proprietary indicators/ ALGO from today:

EP - E-mini S&P 500, Equalized Active Continuation, Primary Session: : Range Bar, 8 Tick Units
EP – E-mini S&P 500, Equalized Active Continuation, Primary Session: : Range Bar, 8 Tick Units

Would you like to have access to my DIAMOND and TOPAZ ALGOs as shown above and be able to apply for any market and any time frame on your own PC ?  You can now have a three weeks free trial where I enable the ALGO along with few studies for your own sierra/ ATcharts OR CQG Q Trader.

Continue reading “Volatility in the S&P Futures Markets and Mini S&P Chart 4.25.2014”

Futures Market Observations and Economic Reports 4.24.2014

Connect with Us! Use Our Futures Trading Levels and Economic Reports RSS Feed.

Like us on FacebookFollow us on TwitterView our profile on LinkedInFind us on Google+Cannon Trading Futures Trading Resistance & Support Levels and Economic ReportsFind us on Yelp

1. Market Commentary
2. Futures Support and Resistance Levels – S&P, Nasdaq, Dow Jones, Russell 2000, Dollar Index
3. Commodities Support and Resistance Levels – Gold, Euro, Crude Oil, T-Bonds
4. Commodities Support and Resistance Levels – Corn, Wheat, Beans, Silver
5. Futures Economic Reports for Thursday April 24, 2014

Hello Traders,

For 2014 I would like to wish all of you discipline and patience in your trading!

Getting Clues from other markets?

When day-trading a specific market do you only look at the chart for that specific market? maybe you took it a step further and you are viewing multiple time frame charts for the same market which is a good step in my eyes.

Now lets take this even one step further by observing what markets have correlation, direct or inverse to the market you are trading, perhaps this can help you make decisions when trading.

I will give a few examples from my experience:

When I am in a position in the mini SP 500, I will often observe what the bonds are doing ( many times inverse correlation), I will take notice of what the Dow, Russell and NASDAQ are doing as well ( direct correlation)

If I am trading crude oil, I will many times pay attention to what unleaded gas and heating oil are doing (very close, although not direct correlation) as well as what WTI crude is doing.

One more example may be when I have a position trade in beans and I will try to get a feel for the overall direction of the grain markets (is there a trend? are they sideways?) by looking at corn, wheat in general and then look to see what bean oil and soy meal which are by products of beans are doing.

One question that can be asked is “what do you mean observe this or that market”? and a good example will be:

Lets say I am short the mini SP 500 and I am not sure if to take profit or not. I look at the mini Russell and see that mini Russell just made new lows, that will give me more confidence to stay in my short position as I feel there might be more room to the downside.

Continue reading “Futures Market Observations and Economic Reports 4.24.2014”

Futures Mini Indices Volume and Mini S&P Chart 4.22.2014

Connect with Us! Use Our Futures Trading Levels and Economic Reports RSS Feed.

Like us on FacebookFollow us on TwitterView our profile on LinkedInFind us on Google+Cannon Trading Futures Trading Resistance & Support Levels and Economic ReportsFind us on Yelp

1. Market Commentary
2. Futures Support and Resistance Levels – S&P, Nasdaq, Dow Jones, Russell 2000, Dollar Index
3. Commodities Support and Resistance Levels – Gold, Euro, Crude Oil, T-Bonds
4. Commodities Support and Resistance Levels – Corn, Wheat, Beans, Silver
5. Futures Economic Reports for Tuesday April 22, 2014

Hello Traders,

For 2014 I would like to wish all of you discipline and patience in your trading!

Extremely light volume in the markets today as Europe was still on a holiday. Volume in the mini SP contract was about 35% of the average normal daily volume as of lately. I suspect that both market participants and volatility should return tomorrow from the Easter holiday.

Daily chart of the mini SP for your review below:

805

Continue reading “Futures Mini Indices Volume and Mini S&P Chart 4.22.2014”

E-Mini NASDAQ 100 Futures Technical Analysis for July 16th 2013

Sept. Mini NASDAQ futures ( symbol on most platforms is NQU3) are trading at 3070.00 at the time I am writing this analysis – July 16th 2013.

As a commodity futures broker,  I am going to focus on the technical aspect of this market and provide my technical opinion, I think it is important to be aware of the fundamental aspects and the events coming up which can move the market either way. To start with,  Traders are probably already looking forward to today’s testimony before Congress by Fed Chairman Ben Bernanke. The big question he will be asked is how does the FED plans on tapering down the massive injection of cash or what we know as QE. I think the reason the markets are down today is in anticipation of this testimony. Economic numbers will continue to pour in as well as a G20 meeting and earning season is in place.

Continue reading “E-Mini NASDAQ 100 Futures Technical Analysis for July 16th 2013”

December to March Rollover for Stock Index Futures


Rollover Notice for Stock Index Futures

Important notice: For those of you trading any stock index futures contracts, i.e., the E-mini S&P, E-mini NASDAQ, E-mini Dow Jones, the “Big” pit-traded S&P 500, etc., it is extremely important to remember that tomorrow, Thursday, December 13th, is rollover day.

Starting December13th, the March 2013 futures contracts will be the front month contracts. It is recommended that all new positions be placed in the March 2013 contract as of December 13th. Volume in the December 12 contracts will begin to drop off until its expiration on Friday December 21st.

The month code for March is H3.

Traders with electronic trading software should make sure that defaults reflect the proper contract as of Thursday morning.


Please close any open December Currency positions by the close on Friday the 14th.Should you have any further question please contact your broker.

Trading Levels and Reports for November 30, 2012


Jump to a section in this post:

1. Market Commentary
2. Support and Resistance Levels – S&P, Nasdaq, Dow Jones, Russell 2000, Dollar Index
3. Support and Resistance Levels – Gold, Euro, Crude Oil, T-Bonds
4. Support and Resistance Levels – Corn, Wheat, Beans, Silver
5. Economic Reports for Friday November 30, 2012


Hello Traders,

If you are trading metals (gold, silver), financials (ten years, bonds etc.) or grains (wheat, corn, beans etc.), please keep in mind that the December contract is going into DELIVERY and you must be out of December and start trading the March contract (for most markets)

Please contact me with any questions.


This DOES NOT apply to stock indices ( mini SP 500, mini Russell etc.) or currencies which still have a couple of weeks and I will send a separate update.