Weekly Newsletter: Bean Oil Outlook, Crude Oil System+ Trading Levels for Oct. 28th

Get Real Time updates and more by joining our Private Facebook Group!
Subscribe to our YouTube Channel

C86

Cannon Futures Weekly Letter Issue # 1214

In this issue:

  • Important Notices – Earnings & NFP, Consumer Confidence
  • Futures 102 – Recognizing Chart Patterns
  • Hot Market of the Week – December Bean Oil
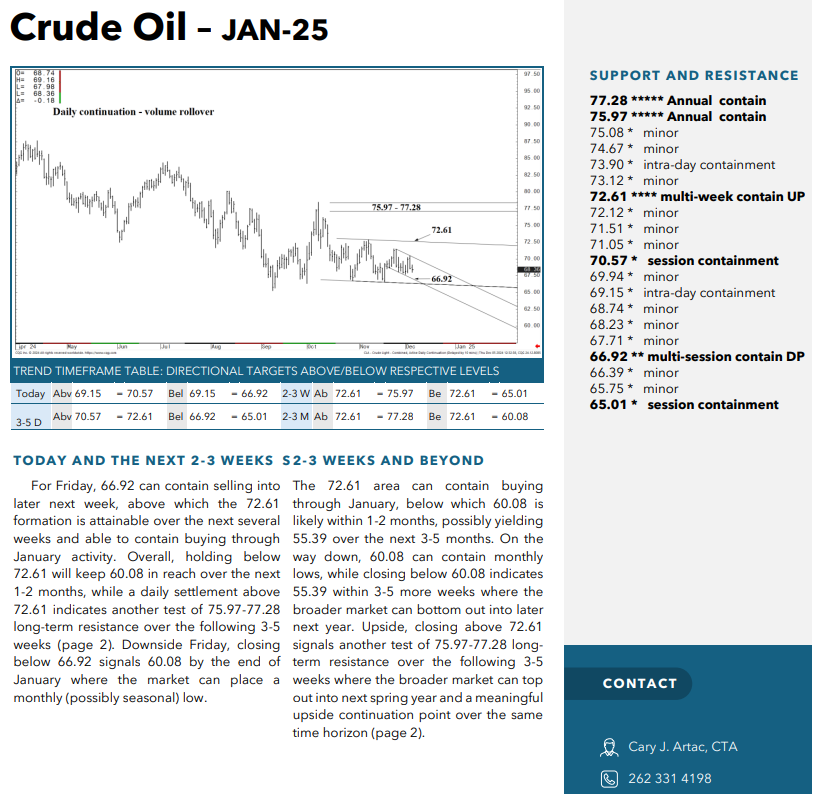
  • Broker’s Trading System of the Week – Crude Oil Swing Trading System
  • Trading Levels for Next Week
  • Trading Reports for Next Week


Important Notices – Next Week Highlights:


The Week Ahead

By Mark O’Brien, Senior Broker


We’re a week away from the Labor Dept.’s release of its monthly Non-farm payrolls report. It’s widely considered to be one of the most important and influential measures of the U.S. economy. The report is released at 7:30 A.M., Central Time on the first Friday of the month.

U.S. Election Day (Nov. 5th) countdown: 11 days


Next week’s earnings include some of the largest U.S. companies by market cap.:


Apple, Microsoft, Alphabet (Google), Amazon, Meta (old Facebook), Berkshire Hathaway, Visa, Exxon Mobile, Chevron, Merck, McDonalds, Caterpillar, Uber


Apple and Microsoft each boast a market cap. of over $3 trillion. That’s 3,000,000,000,000. Google and Amazon come in at about $2 trillion.


Tuesday, Oct. 29th:


9:00: Consumer Confidence


Wednesday, Oct 30th:


7:30: Gross Domestic Product (3rd qtr.)

ADP Employment


Thursday, Oct. 31st:


7:30: Personal Income / Spending

7:30: Personal Consumption & Expenditures – Index & year-over-year

8:45: Chicago Purchasing Managers Index


Friday, Nov. 1st:


Non-Farm Payrolls / U.S. Unemployment Report


Futures 101: Ask a Broker!!

Ask a Broker: Why Trade Bitcoin Futures?

thumbnail?url=https%3A%2F%2Fi.ytimg.com%2Fvi%2FtQSPiEDjKkc%2Fhqdefault


Before Your next Trade, learn to recognize charts and patterns!

Learning the different types of charts and patterns will be another arsenal in your Trading Tools!

  • What is an Ascending Triangle Futures Chart Pattern?

What is an Ascending Triangle Futures Chart Pattern?

An ascending triangle is a bullish futures pattern that can indicate a breakout in the upwards direction.

How do I Recognize an Ascending Triangle Futures Chart Pattern?

An ascending triangle is formed when resistance remains flat and support rises.

What Does a Ascending Triangle Chart Pattern Mean?

The price will rise and fall within the triangle until support and resistance converge. At that point, the apex, breakout occurs, usually upwards.

  • What is a Broadening Top Futures Chart Pattern?
  • Head & Shoulders?
  • Bull Flags?
  • Bear Flags?
  • Rectangle Bottoms?
  • Rectangle Tops?
  • See ACTUAL Charts Patterns images AND many more patterns you should know as a trader!

LEARN THE REST


stars

3b644da2 2bee 4d39 8d98 5208a20bec39


    • Hot Market of the Week – December Hogs

    Hot market of the week is provided by QT Market Center, A Swiss army knife charting package that’s not just for Hedgers, Cooperatives and Farmers alike but also for Spread traders, Swing traders and shorter time frame application for intraday traders with a unique proprietary indicator that can be applied to your specific trading needs.

    FREE TRIAL AVAILABLE

    December Bean Oil

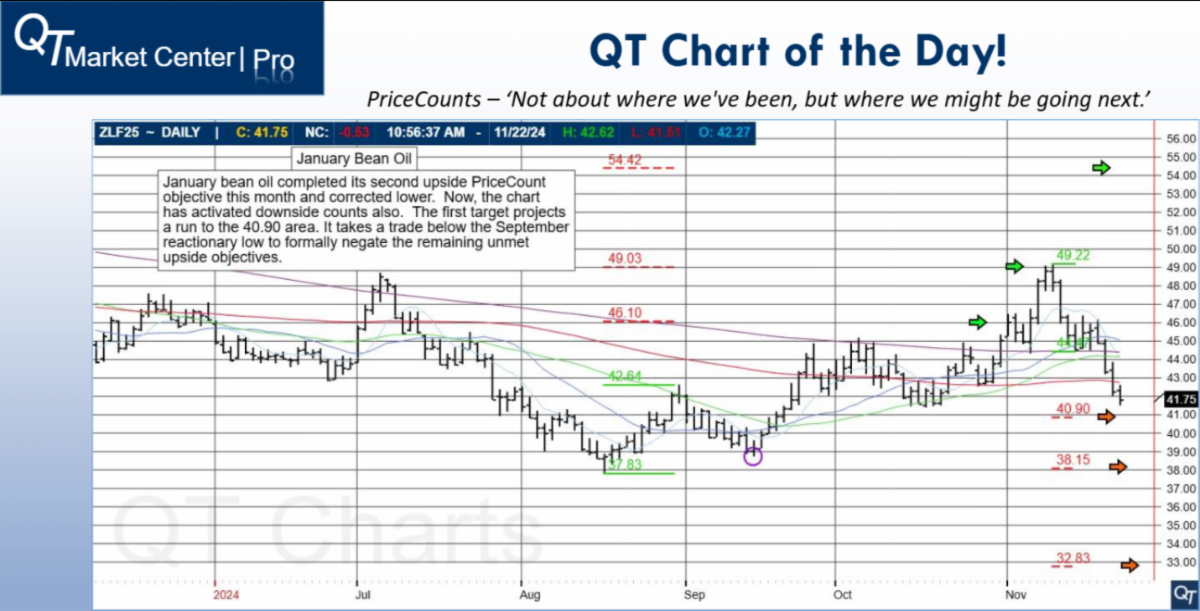
    December bean oil is attempting to break out as it challenges the October highs. New sustained highs would open up the chart to take aim at its upside PriceCount objectives where the first count would project a run to the 46.29 area.


    PriceCounts – Not about where we’ve been , but where we might be going next!
    990a6ed8 2749 4858 898b 84a2b2e631a6

The PriceCount study is a tool that can help to project the distance of a move in price. The counts are not intended to be an ‘exact’ science but rather offer a target area for the four objectives which are based off the first leg of a move with each subsequent count having a smaller percentage of being achieved. It is normal for the chart to react by correcting or consolidating at an objective and then either resuming its move or reversing trend. Best utilized in conjunction with other technical tools, PriceCounts offer one more way to analyze charts and help to manage your positions and risk. Learn more at www.qtchartoftheday.com
Trading in futures, options, securities, derivatives or OTC products entails significant risks which must be understood prior to trading and may not be appropriate for all investors. Past performance of actual trades or strategies is not necessarily indicative of future results.

   Broker’s Trading System of the Week

With algorithmic trading systems becoming more prevalent in portfolio diversification, the following system has been selected as the broker’s choice for this month.

Position Trading Cont v.22 _ CRUDE

PRODUCT

CL – Crude Oil


SYSTEM TYPE

Swing Trading


Recommended Cannon Trading Starting Capital

$25,000


COST

USD 165 / monthly


Get Started

Learn More

4ed8344a e876 415f 927a 7e1c58431eb7

The performance shown above is hypothetical in that the chart represents returns in a model account. The model account rises or falls by the average single contract profit and loss achieved by clients trading actual money pursuant to the listed system’s trading signals on the appropriate dates (client fills), or if no actual client profit or loss available – by the hypothetical single contract profit and loss of trades generated by the system’s trading signals on that day in real time (real‐time) less slippage, or if no real time profit or loss available – by the hypothetical single contract profit and loss of trades generated by running the system logic backwards on back adjusted data. Please read full disclaimer HERE.
Would you like to receive daily support & resistance levels?
Yes
S
No
S

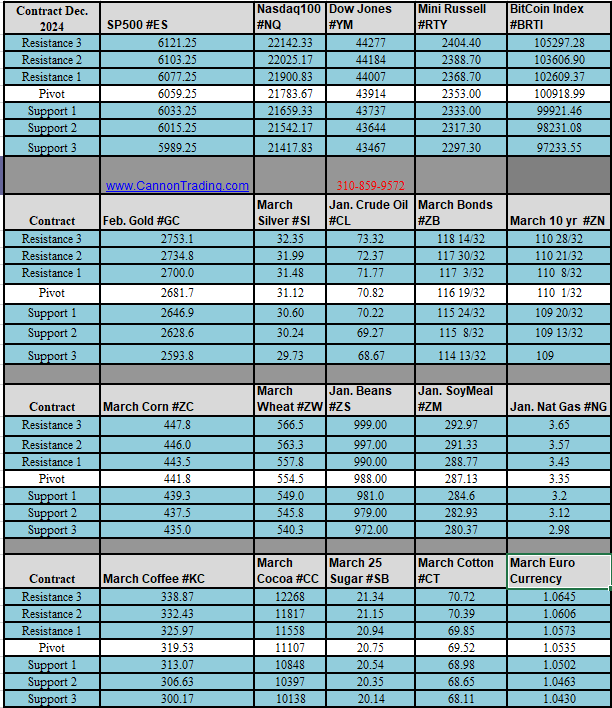
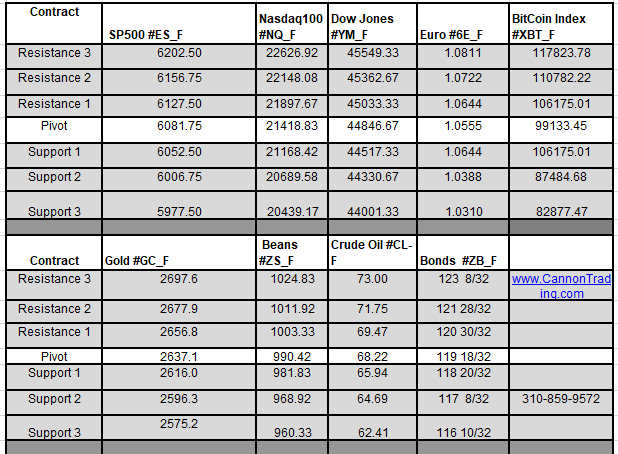
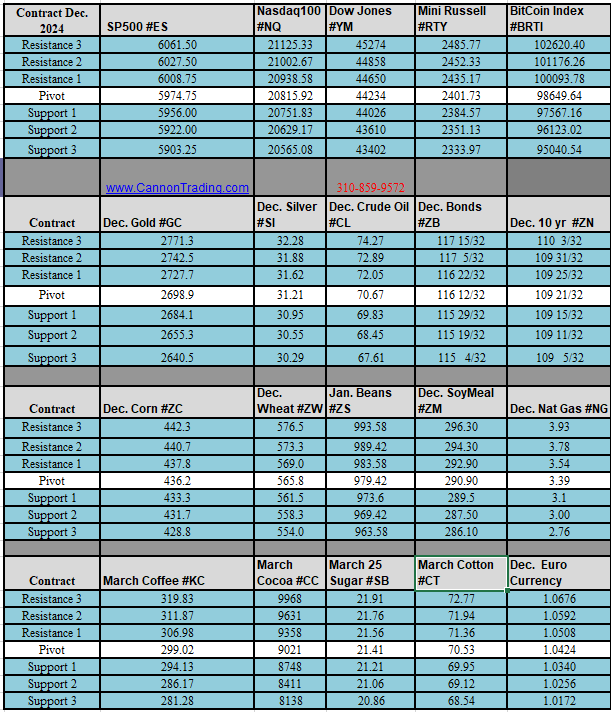
Daily Levels for October 28th, 2024

5c4c45df 5996 416a acd5 57181a871cdd

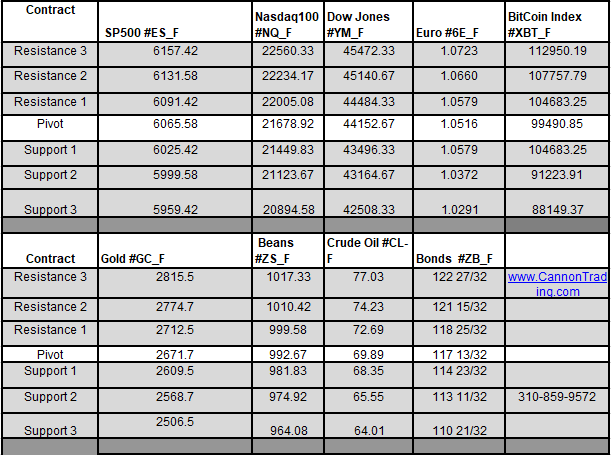
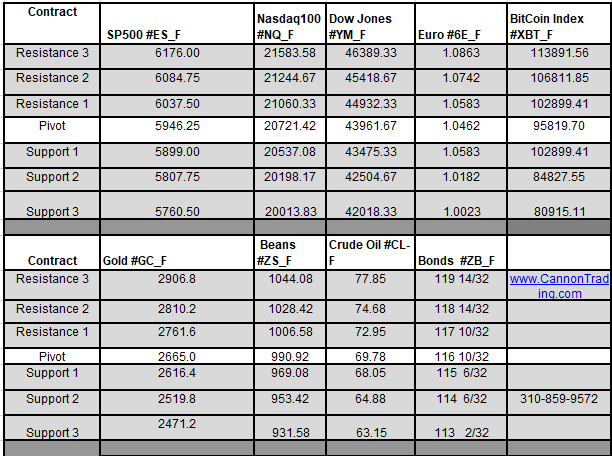
Weekly Levels for the week of October 28th, 2024

3494a9d9 17cc 46ee 98b1 64648344cea7


bf9b3e0d 9c23 44e8 980c a8c01bfbe2cf

Trading Reports for Next Week

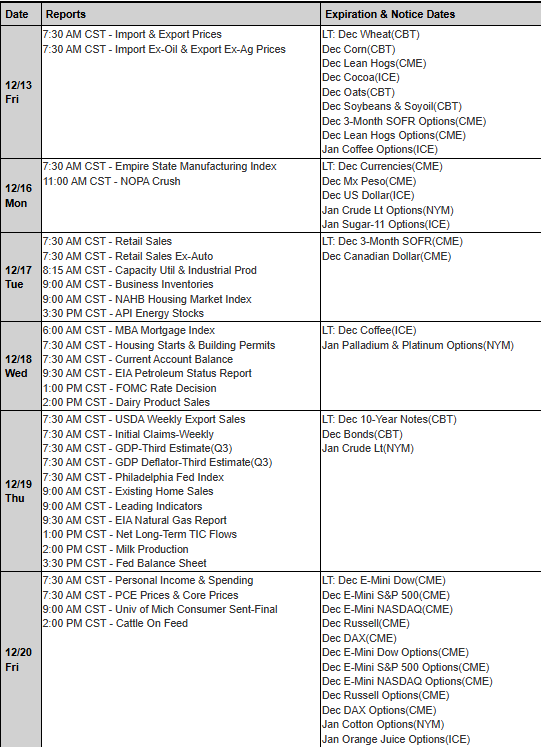
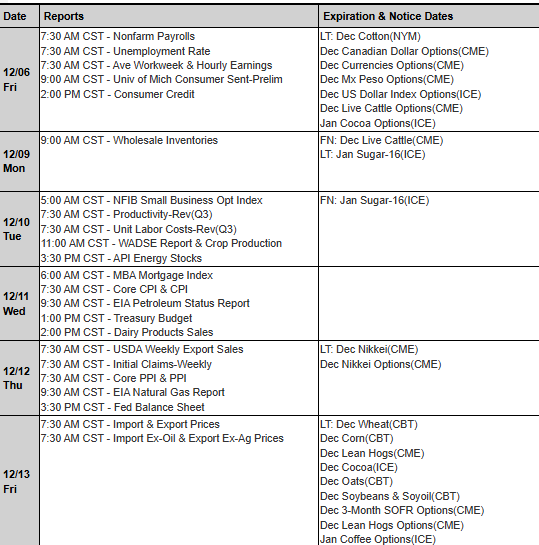
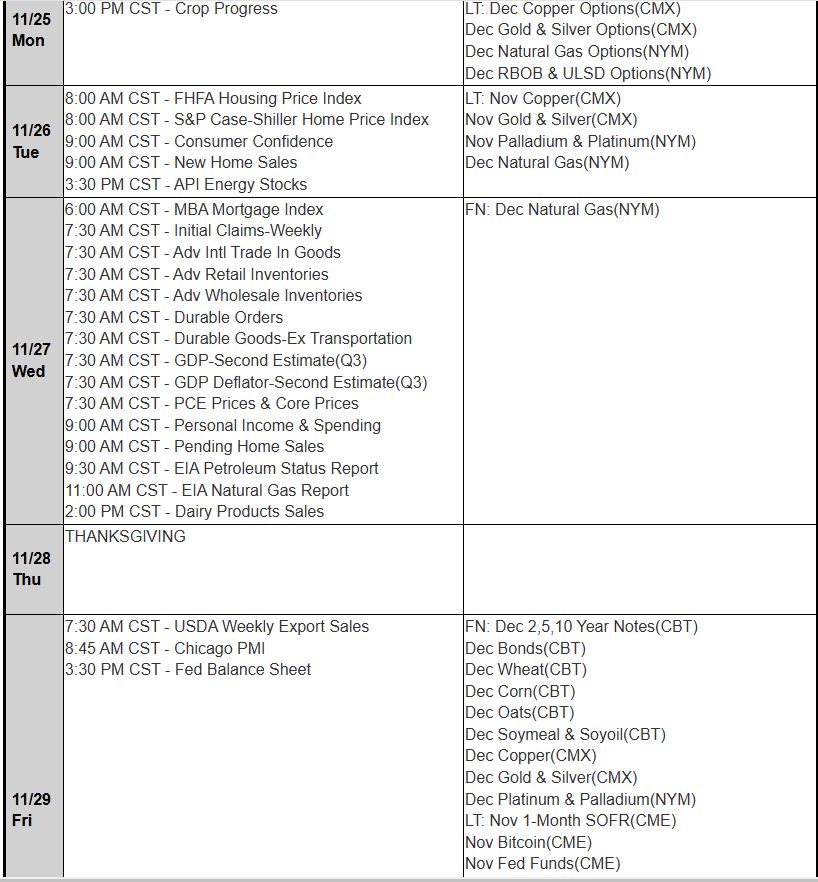
First Notice (FN), Last trading (LT) Days for the Week:
db4c281c 3c99 4515 8a25 1894ec24da04

Improve Your Trading Skills

Get access to proprietary indicators and trading methods, consult with an experienced broker at 1-800-454-9572.

Explore trading methods. Register Here

* This is not a solicitation of any order to buy or sell, but a current market view provided by Cannon Trading Inc. Any statement of facts here in contained are derived from sources believed to be reliable, but are not guaranteed as to accuracy, nor they purport to be complete. No responsibility is assumed with respect to any such statement or with respect to any expression of opinion herein contained. Readers are urged to exercise their own judgement in trading.

Weekly Newsletter: Hogs Outlook, Mini Russell System+ Trading Levels for Oct. 21st

Get Real Time updates and more by joining our Private Facebook Group!
Subscribe to our YouTube Channel

Hogs

Cannon Futures Weekly Letter Issue # 1213

In this issue:

  • Important Notices – Earnings & Fed Speakers
  • Futures 101 – Ask a Broker: Day trading Futures? Margins?
  • Hot Market of the Week – December Hogs
  • Broker’s Trading System of the Week – Mini Russell Day Trading System
  • Trading Levels for Next Week
  • Trading Reports for Next Week


Important Notices – Next Week Highlights:


The Week Ahead

By John Thorpe, Senior Broker


A fair amount of Speakers, Data and Earnings .

Just 2 ½ weeks to the U.S. Presidential Election. Nov 5th.


Economic Data:

Mon. CB Leading Indicators

Tue. Redbook, Richmond Fed

Wed. Mortgage Index

Thu. Chicago Fed Activity Index, Weekly Initial Jobless Claims, New Home Sales

Fri. Durable Goods, Michigan Consumer Sentiment.


Fed and ECB Speakers:

Mon. Logan, Kashkari, Schmid

Tue. 9A.M. Central ECB President Lagarde,  Harker

Wed. Bowman, LaGarde 9 A.M. Central, Barkin

Thu. Hammack

Fri. quiet


Earnings: 608 3rd QTR. Reports this week

Prominent Companies reporting

Wed. Tesla, IBM, Coca-Cola

  • Thu. UPS


Futures 101: Ask a Broker!!

What is Futures Margin?

thumbnail?url=https%3A%2F%2Fi.ytimg.com%2Fvi%2F2VQwRHHIQ8Y%2Fhqdefault

What is Day Trading Futures?


“Trading Around Key Economic Reports” FREE SHORT Course you will learn:

  • What is GDP?
  • About the Retail Sales Report
  • What is NFP ( non farm payroll) Report?
  • Understanding US housing Data
  • FOMC
  • Understanding Oil Data Report
  • Importance of Consumer Confidence Survey

ACCESS THE COURSE


stars

3b644da2 2bee 4d39 8d98 5208a20bec39


    • Hot Market of the Week – December Hogs

    Hot market of the week is provided by QT Market Center, A Swiss army knife charting package that’s not just for Hedgers, Cooperatives and Farmers alike but also for Spread traders, Swing traders and shorter time frame application for intraday traders with a unique proprietary indicator that can be applied to your specific trading needs.

    FREE TRIAL AVAILABLE

    December Hogs

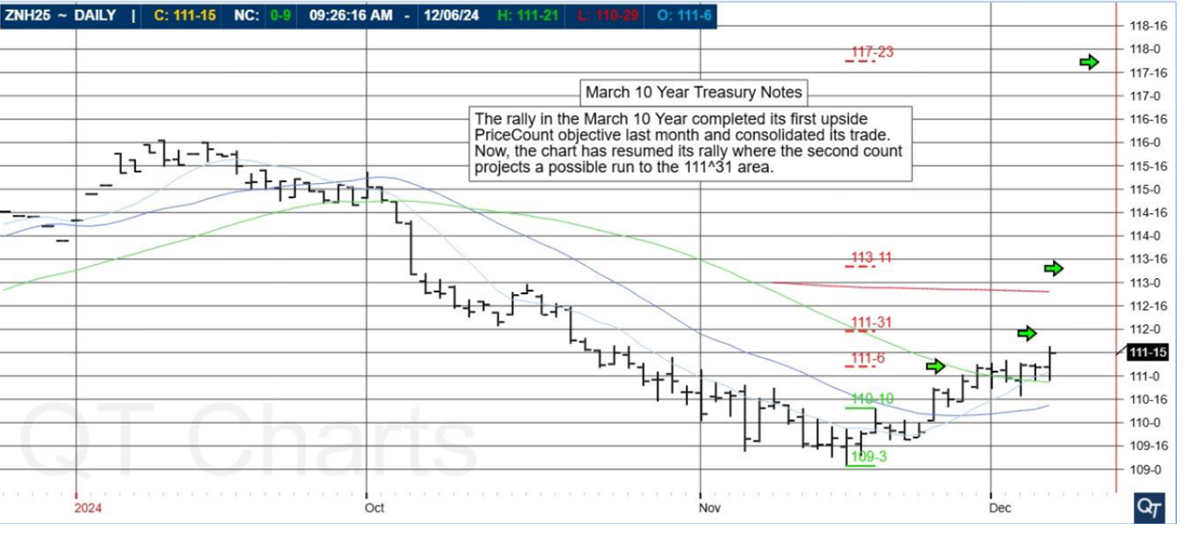
    December hogs satisfied their first upside PriceCount objective early this month and have consolidated their trade. At this point, the second count would project a possible run to the 82.15 area IF you can resume the rally and break out above resistance at the April high.


    PriceCounts – Not about where we’ve been , but where we might be going next!
    e01a8e3a 0793 4347 9e7c d95ceb169dee

The PriceCount study is a tool that can help to project the distance of a move in price. The counts are not intended to be an ‘exact’ science but rather offer a target area for the four objectives which are based off the first leg of a move with each subsequent count having a smaller percentage of being achieved. It is normal for the chart to react by correcting or consolidating at an objective and then either resuming its move or reversing trend. Best utilized in conjunction with other technical tools, PriceCounts offer one more way to analyze charts and help to manage your positions and risk. Learn more at www.qtchartoftheday.com
Trading in futures, options, securities, derivatives or OTC products entails significant risks which must be understood prior to trading and may not be appropriate for all investors. Past performance of actual trades or strategies is not necessarily indicative of future results.

   Broker’s Trading System of the Week

With algorithmic trading systems becoming more prevalent in portfolio diversification, the following system has been selected as the broker’s choice for this month.

MVA 998 RTY 208

PRODUCT

RTY – Mini Russell 2000


SYSTEM TYPE

Day Trading


Recommended Cannon Trading Starting Capital

$10,000


COST

USD 80 / monthly


Get Started

Learn More

9192efe7 f93a 408e 80ff 3e99390e4cb8

The performance shown above is hypothetical in that the chart represents returns in a model account. The model account rises or falls by the average single contract profit and loss achieved by clients trading actual money pursuant to the listed system’s trading signals on the appropriate dates (client fills), or if no actual client profit or loss available – by the hypothetical single contract profit and loss of trades generated by the system’s trading signals on that day in real time (real‐time) less slippage, or if no real time profit or loss available – by the hypothetical single contract profit and loss of trades generated by running the system logic backwards on back adjusted data. Please read full disclaimer HERE.
Would you like to receive daily support & resistance levels?
Yes
S
No
S

Daily Levels for October 21st, 2024

6b7189b7 de1c 4948 84c1 3cfece6c1954

Weekly Levels for the week of October 21st, 2024

4cbc5539 f55f 49b2 8740 bbceade4e60e


bf9b3e0d 9c23 44e8 980c a8c01bfbe2cf

Trading Reports for Next Week

First Notice (FN), Last trading (LT) Days for the Week:
3f492ad8 7aae 4b88 8a16 73e5bfa0972a

Improve Your Trading Skills

Get access to proprietary indicators and trading methods, consult with an experienced broker at 1-800-454-9572.

Explore trading methods. Register Here

* This is not a solicitation of any order to buy or sell, but a current market view provided by Cannon Trading Inc. Any statement of facts here in contained are derived from sources believed to be reliable, but are not guaranteed as to accuracy, nor they purport to be complete. No responsibility is assumed with respect to any such statement or with respect to any expression of opinion herein contained. Readers are urged to exercise their own judgement in trading.

Weekly Newsletter: Free Trial to Advanced Daily Market Insight + Trading Levels for Oct. 14th

Get Real Time updates and more by joining our Private Facebook Group!
Subscribe to our YouTube Channel

Crude Oil2

Cannon Futures Weekly Letter Issue # 1212

In this issue:

  •  Important Notices – Quiet Reports Week & Iran/Israel in background
  • Futures 101 – Advanced Market Insight – Free trial
  • Hot Market of the Week – December Heating Oil
  • Broker’s Trading System of the Week – Unleaded Swing Trading System
  • Trading Levels for Next Week
  • Trading Reports for Next Week


Important Notices – Next Week Highlights:


The Week Ahead

By John Thorpe, Senior Broker


A relatively Quiet Data week next week, Geopolitics may be the only driver of volatility. One Caveat: the Fed Speakers dialogue may be given much more weight by investors as there will be a lot less noise in the form of Economic Data and earnings from prominent “Magnificent Seven” stocks to drive market volatility.


Prominent Earnings this Week:

  • Tues, pre-open United Healthcare, B Of A, Goldman Sachs, Citi Group, Johns and Johnson
  • Wed. Abbott Labs,
  • Thu. NetFlix Post-Close


FED SPEECHES:

  • Mon. Kashkari, Waller, 2nd Kashkari.
  • Tue. Kugler, Bostic
  • Wed. QUIET
  • Thu. QUIET
  • Fri. Bostic, Waller, Kashkari, Bostic


Big Economic Data week:

  • Mon. BANKS CLOSED-Columbus Day National Holiday
  • Tues. Quiet
  • Wed. Quiet
  • Thur. Bus. Inventories, Jobless Claims.
  • Fri. Housing Starts, Building Permits


546fa316 68cc 4c71 a531 5773fea57f29

Would you like to have access to research like shown above and MORE?

Here is what you will receive DAILY:

  • Specific price points for shorter term, medium term and longer term
  • Detailed chart analysis
  • Audio brief summary as well as more detailed PDF summary
  • View insight into Gold, Mini SP, Crude Oil, Corn, feeder Cattle, Live Cattle, Wheat, Hogs and more!

To sign up and get two weeks FULL access, start by requesting the free trial below.

START YOUR FREE TRIAL


stars

3b644da2 2bee 4d39 8d98 5208a20bec39


    • Hot Market of the Week – Heating Oil

    Hot market of the week is provided by QT Market Center, A Swiss army knife charting package that’s not just for Hedgers, Cooperatives and Farmers alike but also for Spread traders, Swing traders and shorter time frame application for intraday traders with a unique proprietary indicator that can be applied to your specific trading needs.

    FREE TRIAL AVAILABLE

    December Heating Oil

    December heating oil Rallied to its second upside PriceCount objective before correcting. At this point if the chart can resume its rally with new sustained highs, the 3rd count would project a possible run into the 2.59 area


    PriceCounts – Not about where we’ve been , but where we might be going next!
    2960fbfb a36b 4ef6 b97f 46dc9fa94e2d

The PriceCount study is a tool that can help to project the distance of a move in price. The counts are not intended to be an ‘exact’ science but rather offer a target area for the four objectives which are based off the first leg of a move with each subsequent count having a smaller percentage of being achieved. It is normal for the chart to react by correcting or consolidating at an objective and then either resuming its move or reversing trend. Best utilized in conjunction with other technical tools, PriceCounts offer one more way to analyze charts and help to manage your positions and risk. Learn more at www.qtchartoftheday.com
Trading in futures, options, securities, derivatives or OTC products entails significant risks which must be understood prior to trading and may not be appropriate for all investors. Past performance of actual trades or strategies is not necessarily indicative of future results.

   Broker’s Trading System of the Week

With algorithmic trading systems becoming more prevalent in portfolio diversification, the following system has been selected as the broker’s choice for this month.

Swing61B Cont v.3 _ RBOB Gasoline

PRODUCT

RB – RBOB ( unleaded gasoline)


SYSTEM TYPE

Swing Trading


Recommended Cannon Trading Starting Capital

$25,000


COST

USD 160 / monthly


Get Started

Learn More

5f9b5881 1752 49dc 95f0 3ab2d92e166d

The performance shown above is hypothetical in that the chart represents returns in a model account. The model account rises or falls by the average single contract profit and loss achieved by clients trading actual money pursuant to the listed system’s trading signals on the appropriate dates (client fills), or if no actual client profit or loss available – by the hypothetical single contract profit and loss of trades generated by the system’s trading signals on that day in real time (real‐time) less slippage, or if no real time profit or loss available – by the hypothetical single contract profit and loss of trades generated by running the system logic backwards on back adjusted data. Please read full disclaimer HERE.
Would you like to receive daily support & resistance levels?
Yes
S
No
S

Daily Levels for October 14th, 2024

4665eb8e 27be 4d9d a498 e0ea47acdd3b

Weekly Levels for the week of October 14th, 2024

37fa4fc7 9ae8 470e 8c34 4cf8ff625565


bf9b3e0d 9c23 44e8 980c a8c01bfbe2cf

Trading Reports for Next Week

First Notice (FN), Last trading (LT) Days for the Week:
974e5421 d431 409b b871 f3083977d92a

Improve Your Trading Skills

Get access to proprietary indicators and trading methods, consult with an experienced broker at 1-800-454-9572.

Explore trading methods. Register Here

* This is not a solicitation of any order to buy or sell, but a current market view provided by Cannon Trading Inc. Any statement of facts here in contained are derived from sources believed to be reliable, but are not guaranteed as to accuracy, nor they purport to be complete. No responsibility is assumed with respect to any such statement or with respect to any expression of opinion herein contained. Readers are urged to exercise their own judgement in trading.

Weekly Newsletter: Learn about Tick Size, Copper System, Sugar Chart + Trading Levels for Sept. 23rd

Get Real Time updates and more by joining our Private Facebook Group!
Subscribe to our YouTube Channel

C93

Cannon Futures Weekly Letter Issue # 1209

In this issue:

  • Important Notices – Heavy Fed Speaking, Active Data, Few Earnings
  • Futures 101 – Tick Size & Minimum Fluctuations
  • Hot Market of the Week – March Sugar
  • Broker’s Trading System of the Week – Copper Swing Trading System
  • Trading Levels for Next Week
  • Trading Reports for Next Week


Important Notices – Next Week Highlights:


The Week Ahead

Heavy Fed Speak Week, active data and a few earnings highlight the week ahead.


Light Earnings, by largest Market Cap

  • Wed, Micron Technologies After the close
  • Thursday, Accenture pre-open, Costco after the close


Fed Speak schedule

  • Mon. Goolsbee 9:15am CDT, Kashkari Noon CDT
  • Tues. Bowman 8:00am CDT
  • Wed. Kugler 3:00pm CDT
  • Thu. Collins 8:10amCDT, Powell 8:20am CDT, Williams 8:25 CDT, Treasury Sec. Yellen 10:15am CDT


Big Economic Data week:

  • Mon. S&P PMI Flash
  • Tues. Case-Shiller Home prices, CB Consumer Confidence, Redbook, Richmond Fed.
  • Wed. Building Permits, New Home Sales
  • Thur. Jobless Claims, Core PCE Final, GDP Final, Durable goods, Pending Home sales
  • Fri. Personal Income, Retail and Wholesale Inventories, Michigan consumer sentiment


How to Rollover on the E-Futures Platform video below

thumbnail?url=https%3A%2F%2Fi.vimeocdn


  • Futures 101: Tick Movements: Understanding How They Work

    Minimum Price Fluctuation

    All futures contracts have a minimum price fluctuation also known as a tick. Tick sizes are set by the exchange and vary by contract instrument.

    E-min S&P 500 tick

    For example, the tick size of an E-Mini S&P 500 Futures Contract is equal to one quarter of an index point. Since an index point is valued at $50 for the E-Mini S&P 500, a movement of one tick would be

    .25 x $50 = $12.50

    NYMEX WTI Crude Oil

    The tick size of the NYMEX WTI Crude Oil contract is equal to 1 cent and the WTI contract size is 1,000 barrels. Therefore, the value of a one tick move is $10.

    Summary

    Tick sizes are defined by the exchange and vary depending on the size of the financial instrument and requirements of the marketplace. Tick sizes are set to provide optimal liquidity and tight bid-ask spreads.

    The minimum price fluctuation for any CME Group contract can be found on the product specification pages.


stars

3b644da2 2bee 4d39 8d98 5208a20bec39


    • Hot Market of the Week – December Gold

    Hot market of the week is provided by QT Market Center, A Swiss army knife charting package that’s not just for Hedgers, Cooperatives and Farmers alike but also for Spread traders, Swing traders and shorter time frame application for intraday traders with a unique proprietary indicator that can be applied to your specific trading needs.

    FREE TRIAL AVAILABLE

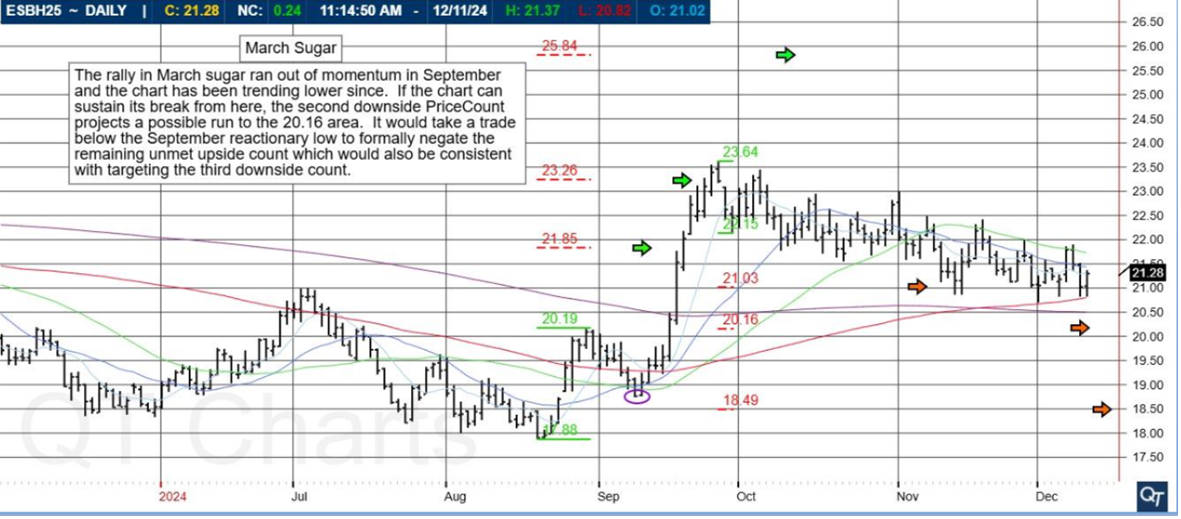
    March 2025 Sugar

    March sugar has shifted its formation back to the topisde and activated upside PriceCount objectives in the process. The chart accelerated to its first upside count to the 21.85 area. It would be normal to get a near term reaction form theis level in the form of a consolidation or corrective trdae. IF you can sustain further strength, the second count projects a possible run to the 23.26 area.


    PriceCounts – Not about where we’ve been, but where we might be going next!

1e5f6ba4 5ab1 4978 9add 01c8cc561e77
The PriceCount study is a tool that can help to project the distance of a move in price. The counts are not intended to be an ‘exact’ science but rather offer a target area for the four objectives which are based off the first leg of a move with each subsequent count having a smaller percentage of being achieved. It is normal for the chart to react by correcting or consolidating at an objective and then either resuming its move or reversing trend. Best utilized in conjunction with other technical tools, PriceCounts offer one more way to analyze charts and help to manage your positions and risk. Learn more at www.qtchartoftheday.com
Trading in futures, options, securities, derivatives or OTC products entails significant risks which must be understood prior to trading and may not be appropriate for all investors. Past performance of actual trades or strategies is not necessarily indicative of future results.

   Broker’s Trading System of the Week

With algorithmic trading systems becoming more prevalent in portfolio diversification, the following system has been selected as the broker’s choice for this month.

Balance Cont. v.22

PRODUCT

HG – Copper
SYSTEM TYPE

Day Trading


Recommended Cannon Trading Starting Capital

$25,000.00


COST

USD 150 / monthly

Get Started

Learn More

86422252 8f48 4ff8 83d2 83943ca53099

The performance shown above is hypothetical in that the chart represents returns in a model account. The model account rises or falls by the average single contract profit and loss achieved by clients trading actual money pursuant to the listed system’s trading signals on the appropriate dates (client fills), or if no actual client profit or loss available – by the hypothetical single contract profit and loss of trades generated by the system’s trading signals on that day in real time (real‐time) less slippage, or if no real time profit or loss available – by the hypothetical single contract profit and loss of trades generated by running the system logic backwards on back adjusted data. Please read full disclaimer HERE.
Would you like to receive daily support & resistance levels?
Yes
S
No
S

Daily Levels for September 23rd 2024

5f2ead23 5c67 4d34 94a9 f65f637a95b1


Trading Reports for Next Week

435212a9 6b73 4c73 a2f0 fcb1ef3233f7

bf9b3e0d 9c23 44e8 980c a8c01bfbe2cf

Trading Reports for Next Week

First Notice (FN), Last trading (LT) Days for the Week:
174942e6 4ea7 461f aa6d db529188220c

Improve Your Trading Skills

Get access to proprietary indicators and trading methods, consult with an experienced broker at 1-800-454-9572.

Explore trading methods. Register Here

* This is not a solicitation of any order to buy or sell, but a current market view provided by Cannon Trading Inc. Any statement of facts here in contained are derived from sources believed to be reliable, but are not guaranteed as to accuracy, nor they purport to be complete. No responsibility is assumed with respect to any such statement or with respect to any expression of opinion herein contained. Readers are urged to exercise their own judgement in trading.

Weekly Newsletter: FOMC next Week, Bonds Outlook & Trading Levels for April 29th

Get Real Time updates and more by joining our Private Facebook Group!
Subscribe to our YouTube Channel

C47

Cannon Futures Weekly Letter Issue # 1191

In this issue:
  • Important Notices – FOMC & NFP Next Week
  • Futures 101 – Understanding Volume
  • Hot Market of the Week – June Bonds
  • Broker’s Trading System of the Week – ES intraday System
  • Trading Levels for Next Week
  • Trading Reports for Next Week


Important Notices – Next Week Highlights:

    • FOMC Rate Announcement Wed.
    • Heavy Earnings, AMZN and AMD Tues, AAPL Thur. all after the close
    • Heavy Data, Chicago PMI, Consumer Confidence, Construction Spending, ISM Manufacturing PMI, Jobless Claims.
    • NON FARM Payrolls to cap off the week on Fri. , preopening


Futures 101 : Understanding VOLUME

Volume is reported for all futures contracts. It is calculated by counting the number of contracts that have been bought and sold over a given time. You can track volume using different time intervals like daily or intraday.
When a futures contract is traded, whether bought or sold, it counts towards volume for that contract.
For example, a trader closes a short position in the E-mini S&P 500 (ES) futures contract by buying one contract in the ES, so volume will increase by 1.
Traders often use and interpret the rise or decline of volume in a futures contract to help make trading decisions.
Volume can give important information to traders such as:
  • Indicate the price levels at which traders are more or less interested in trading a futures contract
  • During the roll, indicate to traders when to switch to trading the front month futures contract as volume decreases in the expiring contract
  • Identify the times of day when a futures contract is most liquid
Price Levels
When volume changes as price of a futures contract moves towards certain levels, this can indicate to a trader that a change in direction may occur. Some traders may use this information to indicate whether to buy or sell at those key levels.
­Contract Roll
During the futures rollover, traders pay attention to the contract that is taking the higher levels of volume. Traders use this information to determine when to start trading the next month contract. As volume decreases in the expiring contract, trading will shift to the next available month contract.
For example, say the June ES (E-mini S&P 500) futures contract is about to expire and September will become the new front month. On the Thursday of rollover week, watch how the June contract starts to lose volume and the September contract begins to pick up volume. When the September contract has more volume than the June contract, it is time to switch to the September contract.
Active Periods
Traders typically prefer higher volume times to trade, as it means that more traders are actively interested in buying and selling. When volume is high, the bid-ask spread is typically smaller, orders are filled faster and less gaps may exist between ticks.
For example, markets can have lower volume between the hours of 12:00 p.m.-2:00 p.m. ET, before major economic releases; conversely, market often see higher volume around the open and close of the trading day.
Traders also can look at average daily volume over a longer time period, such as a few weeks or months, to see if the markets currently are in a lower or higher volume than is typical.
Summary
What volume can’t show however, is whether traders are buying or selling, or opening or closing a position.
For example, if the ES contract is trading at 2375 and suddenly pushes down to 2360 while volume increases, the volume that comes into the market could be from traders opening new long positions at key levels of support. That could indicate a bullish sentiment. Volume also can be generated by liquidation of exiting long positions or opening of new short positions, a possible bearish indication.
A spike in volume at 2360 doesn’t necessarily mean that buyers are coming into the market and that the price will bounce.
Volume data is readily available for each futures contract and for the market as a whole. Although traders may use volume in different ways to interpret how to trade, volume can be an important factor to help inform your trading decisions.


stars

3b644da2 2bee 4d39 8d98 5208a20bec39


  • Hot Market of the Week – June Bonds
Hot market of the week is provided by QT Market Center, A Swiss army knife charting package that’s not just for Hedgers, Cooperatives and Farmers alike but also for Spread traders, Swing traders and shorter time frame application for intraday traders with a unique proprietary indicator that can be applied to your specific trading needs.
June 30 Year T-Bonds
The June 30 Year T-Bond break found temporary stability at its second downside PriceCount objective recently. Now, the chart has resumed its slide into new lows which, if sustained, would project a run to the third count in the 109^20 area.
PriceCounts – Not about where we’ve been , but where we might be going next!
e705ddd3 93f1 4833 80e3 d1e808fbc117
The PriceCount study is a tool that can help to project the distance of a move in price. The counts are not intended to be an ‘exact’ science but rather offer a target area for the four objectives which are based off the first leg of a move with each subsequent count having a smaller percentage of being achieved. It is normal for the chart to react by correcting or consolidating at an objective and then either resuming its move or reversing trend. Best utilized in conjunction with other technical tools, PriceCounts offer one more way to analyze charts and help to manage your positions and risk. Learn more at www.qtchartoftheday.com
Trading in futures, options, securities, derivatives or OTC products entails significant risks which must be understood prior to trading and may not be appropriate for all investors. Past performance of actual trades or strategies is not necessarily indicative of future results.
  • Broker’s Trading System of the Week

With algorithmic trading systems becoming more prevalent in portfolio diversification, the following system has been selected as the broker’s choice for this month.
PRODUCT
SYSTEM TYPE
Intraday
COST
USD 110 / monthly
Recommended Cannon Trading Starting Capital
$10,000
a5fd1228 3ba8 42c5 a40d c3e46544bdd0
The performance shown above is hypothetical in that the chart represents returns in a model account. The model account rises or falls by the average single contract profit and loss achieved by clients trading actual money pursuant to the listed system’s trading signals on the appropriate dates (client fills), or if no actual client profit or loss available – by the hypothetical single contract profit and loss of trades generated by the system’s trading signals on that day in real time (real‐time) less slippage, or if no real time profit or loss available – by the hypothetical single contract profit and loss of trades generated by running the system logic backwards on back adjusted data. Please read full disclaimer HERE.
Would you like to receive daily support & resistance levels?
Yes
S
No
S


Daily Levels for April 29th 2024

eb118b97 a50d 48fb ab4a efafa6ff5968

Trading Reports for Next Week

d398c77d 24dc 450b 92fb ef3ef27b13d9
d259df9c bf07 4429 9fa8 d12b53c37804
First Notice (FN), Last trading (LT) Days for the Week:
6d1a7821 c606 4107 83ef 6fa197eb7433

Improve Your Trading Skills

Get access to proprietary indicators and trading methods, consult with an experienced broker at 1-800-454-9572.

Explore trading methods. Register Here

* This is not a solicitation of any order to buy or sell, but a current market view provided by Cannon Trading Inc. Any statement of facts here in contained are derived from sources believed to be reliable, but are not guaranteed as to accuracy, nor they purport to be complete. No responsibility is assumed with respect to any such statement or with respect to any expression of opinion herein contained. Readers are urged to exercise their own judgement in trading.

Weekly Newsletter: Role of Speculators, Coffee Outlook & Trading Levels for April 22nd

Get Real Time updates and more by joining our Private Facebook Group!
Subscribe to our YouTube Channel

C35

Cannon Futures Weekly Letter Issue # 1190

In this issue:
  • Important Notices – Israel, Iran, PCE Report & More
  • Futures 101 – The Role of Speculators in Futures Trading
  • Hot Market of the Week – July Coffee
  • Broker’s Trading System of the Week – NQ intraday System
  • Trading Levels for Next Week
  • Trading Reports for Next Week


Important Notices –

  • The situation in the Middle East will loom over the markets next week. More on that below.
  • Keep an eye on these potential futures market movers:
  • It was hardly unexpected, but Israel’s missile strike on Iran Friday may foreshadow a dangerous series of tit-for-tat retaliation between the Middle East powers – and unsettle world markets. At the same time, the limited scale of the attack and Iran’s muted response appears so far to signal a successful effort by diplomats who have been working to avert all-out war.
  • At the outset of Israel’s offensive last night, volatility amplified in key futures markets – stock indexes (S&P 500, Dow, Nasdaq), currencies, energies (crude oil), metals (gold), financials (30-yr. bonds, 10-yr. notes). Into late evening and on into today, there has been a virtual across-the-board drop-off in the inflated price fluctuation seen when news broke of the military action.
  • GDP and PMI along with homes sales, durable goods and overall a packed week with economic reports.
  • PCE Friday will provide additional clues as to the future of interest rates
  • big earnings week MSFT, GOOG, META, XOM, Visa, TSLA
  • Volatility in Cocoa and Coffee continues. Copper broke higher.


Trading Resource of the Week: Understanding the Role of Speculators

What Are Speculators?
Speculators are primary participants in the futures market. A speculator is any individual or firm that accepts risk in order to make a profit. Speculators can achieve these profits by buying low and selling high. But in the case of the futures market, they could just as easily sell first and later buy at a lower price.
Obviously, this profit objective is easier said than done. Nonetheless, speculators aiming to profit in the futures market come in a variety of types. Speculators can be individual traders, proprietary trading firms, portfolio managers, hedge funds or market makers.
Individual Traders
For individuals trading their own funds, electronic trading has helped to level the playing field by improving access to price and trade information. The speed and ease of trade execution, combined with the application of modern risk management, gives the individual trader access to markets and strategies that were once reserved for institutions.
Proprietary Trading Firms
Proprietary trading firms, also known as prop shops, profit as a direct result of their traders’ activity in the marketplace. These firms supply their traders with the education and capital required to execute a large number of trades per day. By using the capital resources of the prop shop, traders gain access to more capital than they would if they were trading on their own account. They also may have access to the same type of research and strategies developed by larger institutions.
Portfolio or Investment Managers
A portfolio or investment manager is responsible for investing or hedging the assets of a mutual fund, exchange-traded fund or closed-end fund. The portfolio manager implements the fund’s investment strategy and manages the day-to-day trading. Futures markets are often used to increase or decrease the overall market exposure of a portfolio without disrupting the delicate balance of investments that may have taken a significant effort to build.
Hedge Funds
A hedge fund is a managed portfolio of investments that uses advanced investment strategies to maximize returns, either in an absolute sense or relative to a specified market benchmark. The name hedge fund is mostly historical, as the first hedge funds tried to hedge against the risk of a bear market by shorting the market. Today, hedge funds use hundreds of different strategies in an effort to maximize returns. The diverse and highly liquid futures marketplace offer hedge funds the ability to execute large transactions and either increase or decrease the market exposure of their portfolio.
Market Makers
Market makers are trading firms that have contractually agreed to provide liquidity to the markets, continually providing both bids and offers, usually in exchange for a reduction in trading fees. Market makers are important to the trading ecosystem as they help facilitate the movement of large transactions without effecting a substantial change in price. Market makers often profit from capturing the spread, the small difference between the bid and offer prices over a large number of transactions, or by trading related futures markets that they view as being priced to provide opportunity.
Conclusion
All types of speculators bring liquidity to the market place. Providing liquidity is a crucial market function that enables individuals to easily enter or exit the market. Though speculative trading activity generates considerable liquidity, all market players benefit. In contrast to speculators who aim to profit by assuming market risk, some buyers and sellers have a vested interest in the underlying asset of each contact. These market participants aim to offset or eliminate risk and are referred to as hedgers.


stars

3b644da2 2bee 4d39 8d98 5208a20bec39


  • Hot Market of the Week – July Coffee
Hot market of the week is provided by QT Market Center, A Swiss army knife charting package that’s not just for Hedgers, Cooperatives and Farmers alike but also for Spread traders, Swing traders and shorter time frame application for intraday traders with a unique proprietary indicator that can be applied to your specific trading needs.
July Coffee
July Coffee satisfied its third upside PriceCount objective in where it would be normal to get a near term reaction in the form of a consolidation or corrective trade, at least. At this point, IF the chart can sustain additional upside we are left with thelow percentage fourth count to aim for just above $300.
PriceCounts – Not about where we’ve been , but where we might be going next!
f1508120 0acf 4c7e 889d 59d4a77866e0
The PriceCount study is a tool that can help to project the distance of a move in price. The counts are not intended to be an ‘exact’ science but rather offer a target area for the four objectives which are based off the first leg of a move with each subsequent count having a smaller percentage of being achieved. It is normal for the chart to react by correcting or consolidating at an objective and then either resuming its move or reversing trend. Best utilized in conjunction with other technical tools, PriceCounts offer one more way to analyze charts and help to manage your positions and risk. Learn more at www.qtchartoftheday.com
Trading in futures, options, securities, derivatives or OTC products entails significant risks which must be understood prior to trading and may not be appropriate for all investors. Past performance of actual trades or strategies is not necessarily indicative of future results.
  • Broker’s Trading System of the Week

With algorithmic trading systems becoming more prevalent in portfolio diversification, the following system has been selected as the broker’s choice for this month.
PRODUCT
SYSTEM TYPE
Intraday
COST
USD 55 / monthly
Recommended Cannon Trading Starting Capital
$25,000
228964a9 3514 4d3b a9c2 49621d6ebecd
The performance shown above is hypothetical in that the chart represents returns in a model account. The model account rises or falls by the average single contract profit and loss achieved by clients trading actual money pursuant to the listed system’s trading signals on the appropriate dates (client fills), or if no actual client profit or loss available – by the hypothetical single contract profit and loss of trades generated by the system’s trading signals on that day in real time (real‐time) less slippage, or if no real time profit or loss available – by the hypothetical single contract profit and loss of trades generated by running the system logic backwards on back adjusted data. Please read full disclaimer HERE.
Would you like to receive daily support & resistance levels?
Yes
S
No
S


Daily Levels for April 22nd 2024

127d4560 c19c 4c3e 872a 87e87bc3bfe4

Trading Reports for Next Week

d398c77d 24dc 450b 92fb ef3ef27b13d9
d259df9c bf07 4429 9fa8 d12b53c37804
First Notice (FN), Last trading (LT) Days for the Week:
fa8ac78f aaed 4d53 b8c1 7683e3af1f2d

Improve Your Trading Skills

Get access to proprietary indicators and trading methods, consult with an experienced broker at 1-800-454-9572.

Explore trading methods. Register Here

* This is not a solicitation of any order to buy or sell, but a current market view provided by Cannon Trading Inc. Any statement of facts here in contained are derived from sources believed to be reliable, but are not guaranteed as to accuracy, nor they purport to be complete. No responsibility is assumed with respect to any such statement or with respect to any expression of opinion herein contained. Readers are urged to exercise their own judgement in trading.

Weekly Newsletter: May Crude Oil on the Move? & Trading Levels for April 15th

Get Real Time updates and more by joining our Private Facebook Group!
Subscribe to our YouTube Channel

C2

Cannon Futures Weekly Letter Issue # 1189

In this issue:
  •  Important Notices – Earnings, Gold all time Highs & More
  • Trading Resource of the Week – Trading Videos
  • Hot Market of the Week – May Crude Oil
  • Broker’s Trading System of the Week – NQ Swing System
  • Trading Levels for Next Week
  • Trading Reports for Next Week


Important Notices –

    • Earnings Tues- JNJ,BAC ,Morgan Stanley MS, Wed. -ABT, Thu.- AXP, NFLX
    • Econ Data  Mon- Retail Sales , Tues Housing Starts, Bldg Permits , Thu. Jobless claims, Existing home sales..
    • quiet on the fed speaker front
    • No Congressional action to speak of
    • The U.S. dollar index this morning forged another higher high and reached the highest level since early November.
    • With the June gold futures contract breaking a string of new all-time highs (eight straight days) yesterday, the market is facing the first definitive corrective environment since the middle of last month.
    • The bearish sentiment in financial futures (30-yr. T-bond, 10-yr. T-note) is escalating dramatically and could become overdone soon with some chatter in the market suggesting there might not be a single rate cuts this year.
    • Crude oil may see support this week from renewed talk of an imminent Iranian retaliation (as per U.S. officials) for the Israeli attack in Syria. U.S. officials have openly suggested Iranian retaliation against Israel is likely soon. Fears of disrupted supply remain front and center.


Trading Resource of the Week: Trading Videos, Instant Viewing

Watch a series of short videos, where our VP, Ilan Levy-Mayer shares his personal preferences and opinions on different trading topics.
·    Ever wondered when to exit a trade? Take a look at what Ilan has to share on Bollinger Bands and a study called PARABOLICS
·    Some common uses you can make of support and resistance levels.
·    Filter out the noise with range bar charts
·    “Price Confirmation”


stars

3b644da2 2bee 4d39 8d98 5208a20bec39


  • Hot Market of the Week – May Crude Oil
Hot market of the week is provided by QT Market Center, A Swiss army knife charting package that’s not just for Hedgers, Cooperatives and Farmers alike but also for Spread traders, Swing traders and shorter time frame application for intraday traders with a unique proprietary indicator that can be applied to your specific trading needs.
The March 20th Chart of the Day highlighted May crude oil had completed its first upside PriceCount objective. Now, the chart is consolidating after satisfying its second upside PriceCount objective. A this point, IF the chart can sustain further gains, the third count would project a possible run to the 94.82 area.
PriceCounts – Not about where we’ve been , but where we might be going next!
8b794a41 1b6d 49e3 be59 0a99af03b890
The PriceCount study is a tool that can help to project the distance of a move in price. The counts are not intended to be an ‘exact’ science but rather offer a target area for the four objectives which are based off the first leg of a move with each subsequent count having a smaller percentage of being achieved. It is normal for the chart to react by correcting or consolidating at an objective and then either resuming its move or reversing trend. Best utilized in conjunction with other technical tools, PriceCounts offer one more way to analyze charts and help to manage your positions and risk. Learn more at www.qtchartoftheday.com
Trading in futures, options, securities, derivatives or OTC products entails significant risks which must be understood prior to trading and may not be appropriate for all investors. Past performance of actual trades or strategies is not necessarily indicative of future results.
  • Broker’s Trading System of the Week

With algorithmic trading systems becoming more prevalent in portfolio diversification, the following system has been selected as the broker’s choice for this month.
PRODUCT
SYSTEM TYPE
Swing
COST
USD 299 / monthly
Recommended Cannon Trading Starting Capital
$75,000
32655e40 466f 43ab ae59 5d633fcbf7c3
The performance shown above is hypothetical in that the chart represents returns in a model account. The model account rises or falls by the average single contract profit and loss achieved by clients trading actual money pursuant to the listed system’s trading signals on the appropriate dates (client fills), or if no actual client profit or loss available – by the hypothetical single contract profit and loss of trades generated by the system’s trading signals on that day in real time (real‐time) less slippage, or if no real time profit or loss available – by the hypothetical single contract profit and loss of trades generated by running the system logic backwards on back adjusted data. Please read full disclaimer HERE.
Would you like to receive daily support & resistance levels?
Yes
S
No
S


Daily Levels for April 15th 2024

771a1b3e a8b5 4c92 93ff 8af9b7ddc603

Trading Reports for Next Week

355e348f 486b 4680 a381 a80073d0f10f
d259df9c bf07 4429 9fa8 d12b53c37804
First Notice (FN), Last trading (LT) Days for the Week:
863255b9 3bfd 4269 bc70 e4613f026765

Improve Your Trading Skills

Get access to proprietary indicators and trading methods, consult with an experienced broker at 1-800-454-9572.

Explore trading methods. Register Here

* This is not a solicitation of any order to buy or sell, but a current market view provided by Cannon Trading Inc. Any statement of facts here in contained are derived from sources believed to be reliable, but are not guaranteed as to accuracy, nor they purport to be complete. No responsibility is assumed with respect to any such statement or with respect to any expression of opinion herein contained. Readers are urged to exercise their own judgement in trading.

Weekly Newsletter: Notional Value, May Copper Outlook & Trading Levels for April 8th

Get Real Time updates and more by joining our Private Facebook Group!
Subscribe to our YouTube Channel

C38

Cannon Futures Weekly Letter Issue # 1188

In this issue:
  •  Important Notices – Earnings Season Starts April 12th
  • Trading Resource of the Week – About Contract Notional Value
  • Hot Market of the Week – May Copper
  • Broker’s Trading System of the Week – RBOB Swing System
  • Trading Levels for Next Week
  • Trading Reports for Next Week


Important Notices –

  • Market Moving Data Wed. /Thur.  CPI and PPI respectively , w/Jobless Claims Thur. as well
  • 1 Fed discussion RE: new BASEL lll requirements Wed. AM (raises min. Cap Req from 2% to 4.5% for all banks)
  • AG WASDE Thur.
  • Q1 Earnings Season Begins Fri. the 12th Bank Earnings, JPM, C, WFC, BLK all report on this day.


Trading Resource of the Week : About Contract Notional Value by CMEgroup.com

Contract Unit
The contract unit is a standardized size unique to each futures contract and can be based on volume, weight, or a financial measurement, depending on the contract and the underlying product or market.
For example, a single COMEX Gold contract unit (GC) is 100 troy ounces, which is measured by weight.
A NYMEX WTI Crude Oil contract unit (CL) is 1,000 barrels of oil, measured by volume.
The E-mini S&P 500 contract unit (ES) is a financial calculation based on a fixed multiplier times the S&P 500 Index.
Contract Notional Value
Contract notional value, also known as contract value, is the financial expression of the contract unit and the current futures contract price.
Determining Notional Value
Assume a Gold futures contract is trading at price of $1,000. The notional value of the contract is calculated by multiplying the contract unit by the futures price.
Contract unit x contract price = notional value
100 (troy ounces) x $1,000 = $100,000
If WTI Crude Oil is trading at $50 dollars and the contract unit is 1000 barrels, the notional would be;
$50 x 1,000 = $50,000
Now assume E-mini S&P 500 futures are trading at 2120.00. The multiplier for this contract is $50.
$50 x 2120.00 = $106,000


stars

3b644da2 2bee 4d39 8d98 5208a20bec39


  • Hot Market of the Week – May Copper
Hot market of the week is provided by QT Market Center, A Swiss army knife charting package that’s not just for Hedgers, Cooperatives and Farmers alike but also for Spread traders, Swing traders and shorter time frame application for intraday traders with a unique proprietary indicator that can be applied to your specific trading needs.
May Copper
May copper is completing its third upside PriceCount objective that is consistent with a challenge of the contract high. It would be normal to get a reaction in the form of a near term consolidation or corrective trade, at least, from this level. From here, IF the chart can sustain further gains, we are left with the low percentage fourth upside count to the 4.94 area to aim for (not shown here for presentation purposes).
PriceCounts – Not about where we’ve been , but where we might be going next!
26a5ed14 ac68 4e3d 87d7 32b6f353a42b
The PriceCount study is a tool that can help to project the distance of a move in price. The counts are not intended to be an ‘exact’ science but rather offer a target area for the four objectives which are based off the first leg of a move with each subsequent count having a smaller percentage of being achieved. It is normal for the chart to react by correcting or consolidating at an objective and then either resuming its move or reversing trend. Best utilized in conjunction with other technical tools, PriceCounts offer one more way to analyze charts and help to manage your positions and risk. Learn more at www.qtchartoftheday.com
Trading in futures, options, securities, derivatives or OTC products entails significant risks which must be understood prior to trading and may not be appropriate for all investors. Past performance of actual trades or strategies is not necessarily indicative of future results.
  • Broker’s Trading System of the Week

With algorithmic trading systems becoming more prevalent in portfolio diversification, the following system has been selected as the broker’s choice for this month.
PRODUCT
SYSTEM TYPE
Swing
COST
USD 160 / monthly
Recommended Cannon Trading Starting Capital
$25,000
83550ce4 cf9c 4afc ab89 e5ee2fd9dd36
The performance shown above is hypothetical in that the chart represents returns in a model account. The model account rises or falls by the average single contract profit and loss achieved by clients trading actual money pursuant to the listed system’s trading signals on the appropriate dates (client fills), or if no actual client profit or loss available – by the hypothetical single contract profit and loss of trades generated by the system’s trading signals on that day in real time (real‐time) less slippage, or if no real time profit or loss available – by the hypothetical single contract profit and loss of trades generated by running the system logic backwards on back adjusted data. Please read full disclaimer HERE.
Would you like to receive daily support & resistance levels?
Yes
S
No
S


Daily Levels for April 8th 2024

4d7ce40c c23b 4ee7 b34c e5b2c3d70422

Trading Reports for Next Week

7e9a5c96 d05e 4beb 9567 5c95f07367e0
d259df9c bf07 4429 9fa8 d12b53c37804
First Notice (FN), Last trading (LT) Days for the Week:
d43865c8 31dd 4466 b8a5 e96ddde4d232

Improve Your Trading Skills

Get access to proprietary indicators and trading methods, consult with an experienced broker at 1-800-454-9572.

Explore trading methods. Register Here

* This is not a solicitation of any order to buy or sell, but a current market view provided by Cannon Trading Inc. Any statement of facts here in contained are derived from sources believed to be reliable, but are not guaranteed as to accuracy, nor they purport to be complete. No responsibility is assumed with respect to any such statement or with respect to any expression of opinion herein contained. Readers are urged to exercise their own judgement in trading.

Weekly Newsletter: Understanding Margins, May Bean Meal Outlook and Automated NQ System

Get Real Time updates and more by joining our Private Facebook Group!
Subscribe to our YouTube Channel

C31

Cannon Futures Weekly Letter Issue # 1186

In this issue:
  •  Important Notices – Good Friday Trading Schedule
  • Trading Resource of the Week – Understanding Margins
  • Hot Market of the Week – May Bean Meal
  • Broker’s Trading System of the Week – NQ Intraday System
  • Trading Levels for Next Week
  • Trading Reports for Next Week


Important Notices –

  • 4 Day Trading week, All Mkts closed Good Friday (MKTS closed from Thursday afternoon until Sunday Afternoon)
  • 6 Data releases: New home sales, Durable Goods, Consumer Confidence, GDP (Q4 final), Jobless Claims, Chicago PMI
  • Grain traders! Big Prospective plantings report Thursday Morning.
  • Night Traders, WATCHOUT for volatility Wednesday and Sunday. Fed Speaker Waller: Econ. Outlook 6PM EDT. Jerome Powell Friday Morning 11:30 EDT @SF Monetary Policy Conference.


4ff4fc7b 00fb 48ea a8e2 eec4c4609c4b


Trading Resource of the Week : Understanding Margins by CMEgroup.com

Understanding Margin

Securities margin is the money you borrow as a partial down payment, up to 50% of the purchase price, to buy and own a stock, bond, or ETF. This practice is often referred to as buying on margin.
Futures margin is the amount of money that you must deposit and keep on hand with your broker when you open a futures position. It is not a down payment and you do not own the underlying commodity.
Futures margin generally represents a smaller percentage of the notional value of the contract, typically 3-12% per futures contract as opposed to up to 50% of the face value of securities purchased on margin.

Margins Move with the Markets

When markets are changing rapidly and daily price moves become more volatile, market conditions and the clearinghouses’ margin methodology may result in higher margin requirements to account for increased risk.
When market conditions and the margin methodology warrant, margin requirements may be reduced.

Types of Futures Margin

Initial margin is the amount of funds required by CME Clearing to initiate a futures position. While CME Clearing sets the margin amount, your broker may be required to collect additional funds for deposit.
Maintenance margin is the minimum amount that must be maintained at any given time in your account.
If the funds in your account drop below the maintenance margin level, a few things can happen:
  • You may receive a margin call where you will be required to add more funds immediately to bring the account back up to the initial margin level.
  • If you do not or can not meet the margin call, you may be able to reduce your position in accordance with the amount of funds remaining in your account.
  • Your position may be liquidated automatically once it drops below the maintenance margin level.

Summary

Futures margin is the amount of money that you must deposit and keep on hand with your broker when you open a futures position. It is not a down payment, and you do not own the underlying commodity.
The term margin is used across multiple financial markets. However, there is difference between securities margins and futures margins. Understanding these differences is essential, prior to trading futures contracts.


stars

3b644da2 2bee 4d39 8d98 5208a20bec39


  • Hot Market of the Week – May Bean Meal
Hot market of the week is provided by QT Market Center, A Swiss army knife charting package that’s not just for Hedgers, Cooperatives and Farmers alike but also for Spread traders, Swing traders and shorter time frame application for intraday traders with a unique proprietary indicator that can be applied to your specific trading needs.
May Bean Meal
May meal satisfied its first upside PriceCount objective and is correcting lower. At this point, IF the chart can resume its rally with new sustained highs, the second count would project a possible run to the 356.5 area.
PriceCounts – Not about where we’ve been , but where we might be going next!
9b3675bf 04d6 4b4f 9b5a c9ae82c43df2
The PriceCount study is a tool that can help to project the distance of a move in price. The counts are not intended to be an ‘exact’ science but rather offer a target area for the four objectives which are based off the first leg of a move with each subsequent count having a smaller percentage of being achieved. It is normal for the chart to react by correcting or consolidating at an objective and then either resuming its move or reversing trend. Best utilized in conjunction with other technical tools, PriceCounts offer one more way to analyze charts and help to manage your positions and risk. Learn more at www.qtchartoftheday.com
Trading in futures, options, securities, derivatives or OTC products entails significant risks which must be understood prior to trading and may not be appropriate for all investors. Past performance of actual trades or strategies is not necessarily indicative of future results.
  • Broker’s Trading System of the Week

With algorithmic trading systems becoming more prevalent in portfolio diversification, the following system has been selected as the broker’s choice for this month.
PRODUCT
Mini NASDAQ 100
SYSTEM TYPE
Intraday
COST
USD 55 / monthly
Recommended Cannon Trading Starting Capital
$20,000
f7389f2b 7178 4e28 83a0 2ee3eb7b58d4
The performance shown above is hypothetical in that the chart represents returns in a model account. The model account rises or falls by the average single contract profit and loss achieved by clients trading actual money pursuant to the listed system’s trading signals on the appropriate dates (client fills), or if no actual client profit or loss available – by the hypothetical single contract profit and loss of trades generated by the system’s trading signals on that day in real time (real‐time) less slippage, or if no real time profit or loss available – by the hypothetical single contract profit and loss of trades generated by running the system logic backwards on back adjusted data. Please read full disclaimer HERE.
Would you like to receive daily support & resistance levels?
Yes
S
No
S


Daily Levels for March 25th 2024

cff985a6 cddb 48ec 9cf9 b2df3dc2ee88

Trading Reports for Next Week

ddee5173 eaeb 4db2 9b96 7687c49cc099
d259df9c bf07 4429 9fa8 d12b53c37804
First Notice (FN), Last trading (LT) Days for the Week:
1ee7c896 4991 4ebc bb72 d924270bf921

Improve Your Trading Skills

Get access to proprietary indicators and trading methods, consult with an experienced broker at 1-800-454-9572.

Explore trading methods. Register Here

* This is not a solicitation of any order to buy or sell, but a current market view provided by Cannon Trading Inc. Any statement of facts here in contained are derived from sources believed to be reliable, but are not guaranteed as to accuracy, nor they purport to be complete. No responsibility is assumed with respect to any such statement or with respect to any expression of opinion herein contained. Readers are urged to exercise their own judgement in trading.

Weekly Newsletter: Understanding Price Banding, May Bean Oil Outlook and Automated Gold System

Get Real Time updates and more by joining our Private Facebook Group!
Subscribe to our YouTube Channel

C27

Cannon Futures Weekly Letter Issue # 1186

In this issue:
  •  Important Notices – FOMC Next Week
  • Trading Resource of the Week – Understanding Price Limits and Banding
  • Hot Market of the Week – May Bean Oil
  • Broker’s Trading System of the Week – Gold Swing System
  • Trading Levels for Next Week
  • Trading Reports for Next Week


Important Notices –

  • FOMC Meeting next week. Announcement on Wednesday.
  • Light data most of the week. Housing sales
  • Very few earnings
  • June is front month for indices, currencies and financials.: M = June
  • USA is on daylight savings time – most international countries have NOT changed yet.


Trading Resource of the Week : What are Price Limits and Price Banding? by CMEgroup.com

As a trader, you want to know that there are mechanisms in place to ensure an orderly market. A regulated marketplace like CME Group provides this order by setting price limits and price banding.
Price Limits
Price limits are the maximum price range permitted for a futures contract in each trading session. These price limits are measured in ticks and vary from product to product. When markets hit the price limit, different actions occur depending on the product being traded. Some markets may temporarily halt until price limits can be expanded or trading may be stopped for the day based on regulatory rules. Different futures contracts will have different price limit rules; i.e. Equity Index futures have different rules than Agricultural futures.
Example
Equity Indexes futures have a three level expansion: 7%, 13% and 20% to the downside, and a 7% limit up and down in overnight trading.
When price reaches any of those levels the market will go limit up or limit down.
Calculating Price Limits
Price limits are re-calculated daily and remain in effect for all trading days except in certain physically-deliverable markets, where price limits are lifted prior to expiration so that futures prices are not prevented from converging on prices for the underlying commodity.
Typically, Agricultural futures will go limit up or down most often compared to Equity Index futures which very rarely if ever go limit up or down. When trading a specific product, it is important to be aware of price limits and the mechanisms that occur when limits are hit. Traders also know that it is possible for limits to be reached for more than one session in a row, however the expansion of limit thresholds over the last few years have reduced this occurrence.
Price Banding
Price banding is a similar mechanism which subjects all orders to price validation and rejects orders outside the given band to maintain orderly markets. Bands are calculated dynamically for each product based on the last price, plus or minus a fixed band value. Thus, if markets quickly move in one direction, the price bands dynamically adjust to accommodate new trading ranges.
Conclusion
The rules for each market can be found on cmegroup.com.
It is important to note that traders can place trades outside the daily price limits. These trades will be executed when price limits and price bands move within the specified range. So, traders still have the ability to place good-til-canceled or good-til-date orders inside and outside daily price limits.
In the last few years there are fewer and fewer times that markets will actually go limit up or down, but it is important to be aware of these pricing rules when you trade.
efa302e7 662d 4483 85eb 5655e4b45680


stars

3b644da2 2bee 4d39 8d98 5208a20bec39


  • Hot Market of the Week – May Bean Oil
Hot market of the week is provided by QT Market Center, A Swiss army knife charting package that’s not just for Hedgers, Cooperatives and Farmers alike but also for Spread traders, Swing traders and shorter time frame application for intraday traders with a unique proprietary indicator that can be applied to your specific trading needs.
May Bean Oil
The rally in May soybean oil accelerated to its second upside PriceCount objective and now the chart is correcting. At this point, IF you can resume the rally with new sustained highs, the third count would project a possible run to the 50.87 area.
PriceCounts – Not about where we’ve been , but where we might be going next!
5bd46875 4f13 4f46 8290 888342486818
The PriceCount study is a tool that can help to project the distance of a move in price. The counts are not intended to be an ‘exact’ science but rather offer a target area for the four objectives which are based off the first leg of a move with each subsequent count having a smaller percentage of being achieved. It is normal for the chart to react by correcting or consolidating at an objective and then either resuming its move or reversing trend. Best utilized in conjunction with other technical tools, PriceCounts offer one more way to analyze charts and help to manage your positions and risk. Learn more at www.qtchartoftheday.com
Trading in futures, options, securities, derivatives or OTC products entails significant risks which must be understood prior to trading and may not be appropriate for all investors. Past performance of actual trades or strategies is not necessarily indicative of future results.
  • Broker’s Trading System of the Week

With algorithmic trading systems becoming more prevalent in portfolio diversification, the following system has been selected as the broker’s choice for this month.
Spartan Gold
PRODUCT
SYSTEM TYPE
Swing
COST
USD 75 / monthly
Recommended Cannon Trading Starting Capital
$20,000
846f5ed4 d467 4de2 9c1d 75acf0c4f4af
The performance shown above is hypothetical in that the chart represents returns in a model account. The model account rises or falls by the average single contract profit and loss achieved by clients trading actual money pursuant to the listed system’s trading signals on the appropriate dates (client fills), or if no actual client profit or loss available – by the hypothetical single contract profit and loss of trades generated by the system’s trading signals on that day in real time (real‐time) less slippage, or if no real time profit or loss available – by the hypothetical single contract profit and loss of trades generated by running the system logic backwards on back adjusted data. Please read full disclaimer HERE.
Would you like to receive daily support & resistance levels?
Yes
S
No
S


Daily Levels for March 18th 2024

b6a2bf3a a499 4edd 8d8e e4d3d22769b4

Trading Reports for Next Week

58d4627d b4e3 4117 a10c 1ddf826463a9
First Notice (FN), Last trading (LT) Days for the Week:

Improve Your Trading Skills

Get access to proprietary indicators and trading methods, consult with an experienced broker at 1-800-454-9572.

Explore trading methods. Register Here

871e501d 3a1d 4e83 8ee9 a2be76e7992f

* This is not a solicitation of any order to buy or sell, but a current market view provided by Cannon Trading Inc. Any statement of facts here in contained are derived from sources believed to be reliable, but are not guaranteed as to accuracy, nor they purport to be complete. No responsibility is assumed with respect to any such statement or with respect to any expression of opinion herein contained. Readers are urged to exercise their own judgement in trading.