Trading Resource of the Week – Trade Alerts Via Email/Text
Hot Market of the Week – May Wheat
Broker’s Trading System of the Week – MidCap SP Swing System
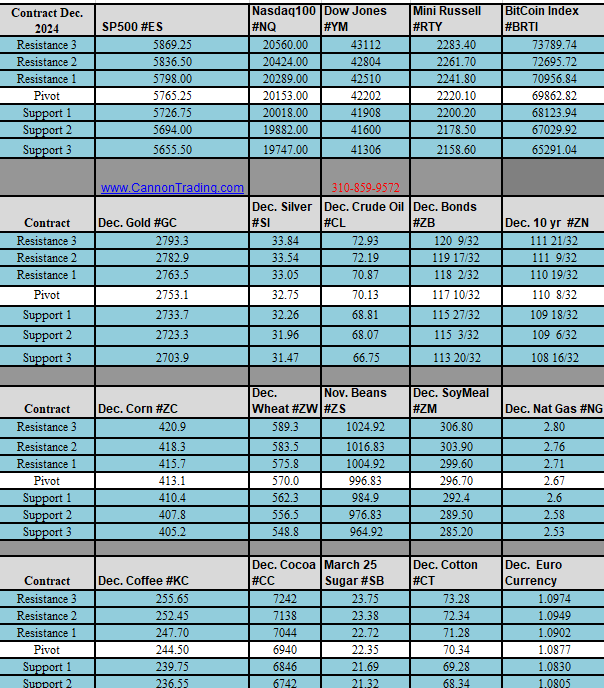
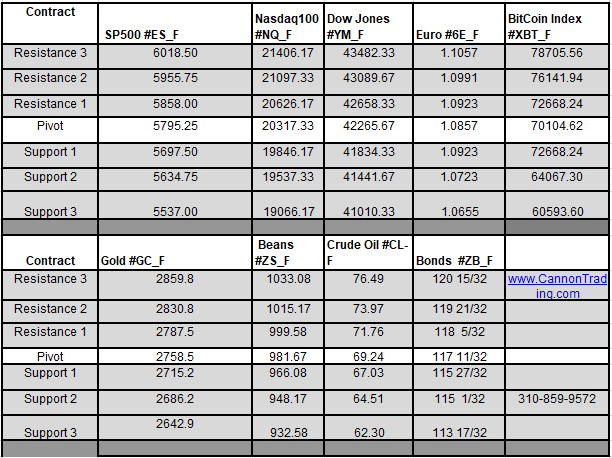
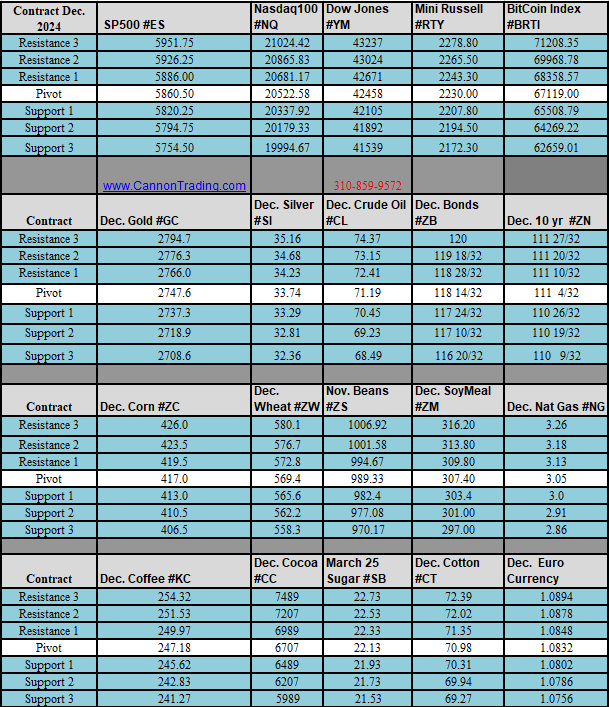
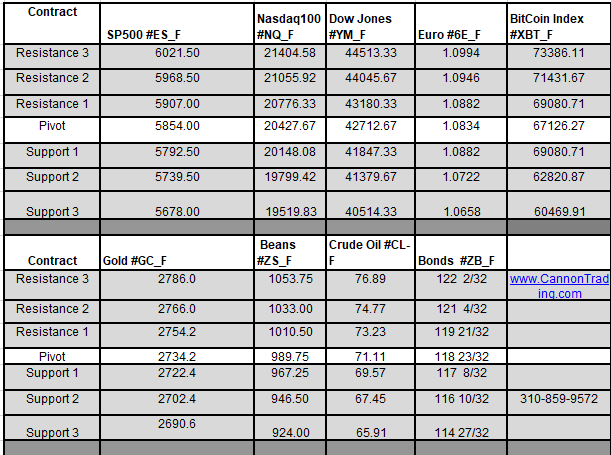
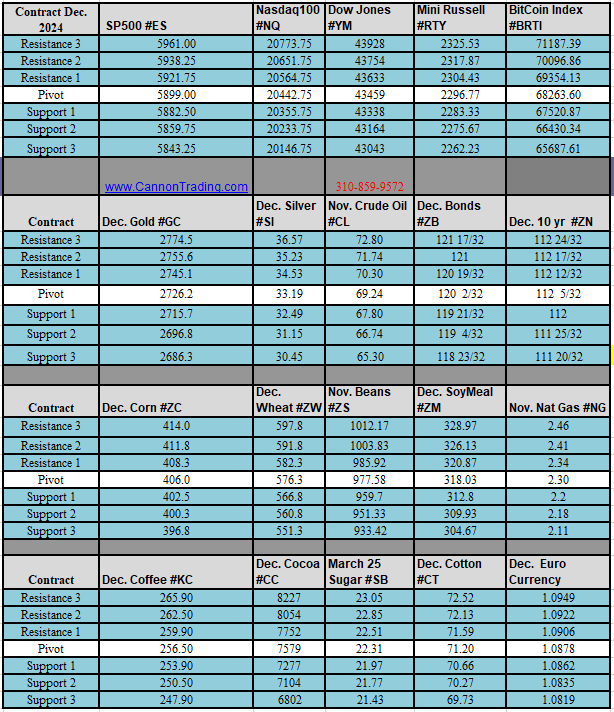
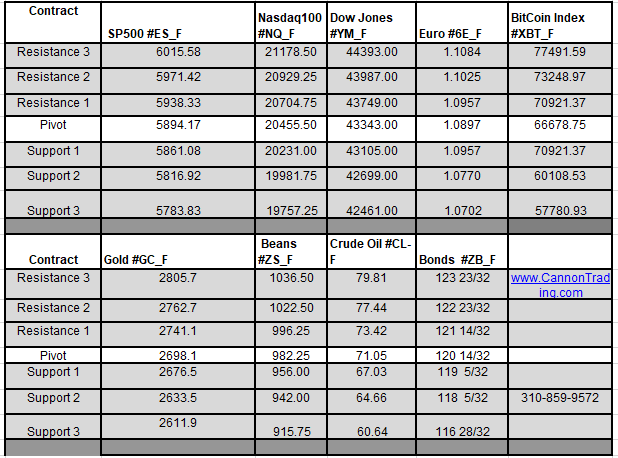
Trading Levels for Next Week
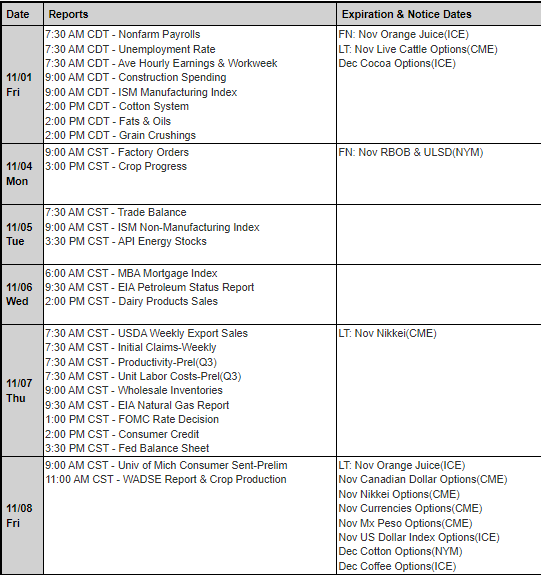
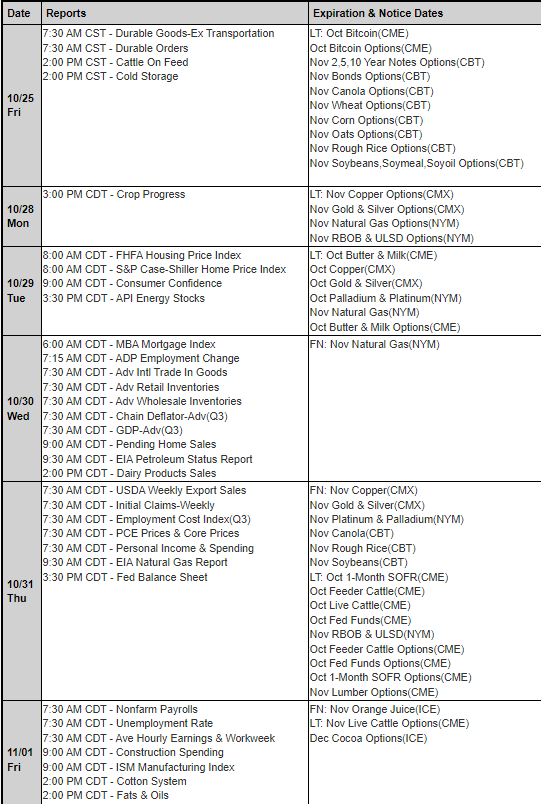
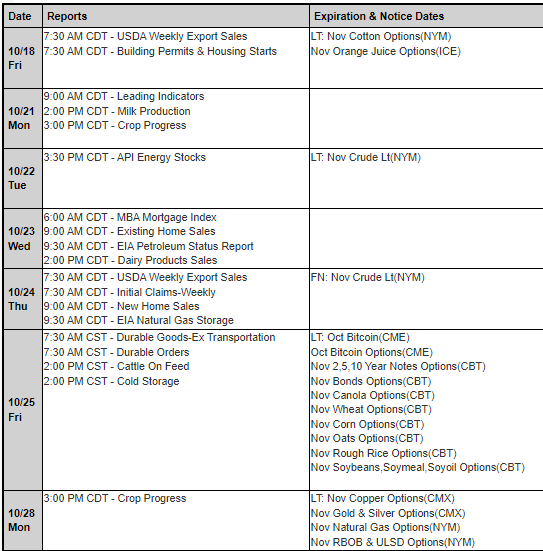
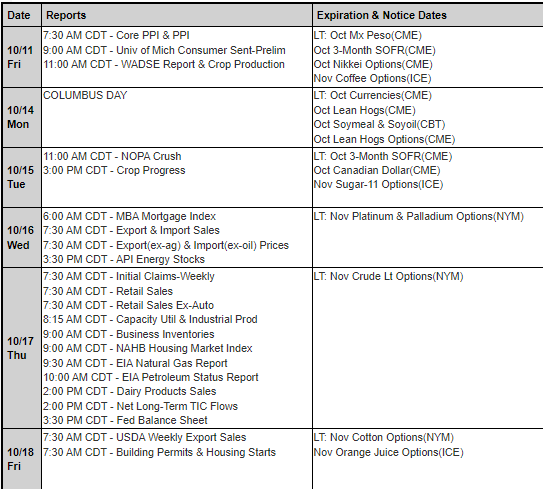
Trading Reports for Next Week
Important Notices –
FED Blackout Period Begins Sat. 9th, lasts for 9 business days
A smattering of earnings. Mostly Microcap to Midcap: Adobe Reports
Tuesday and Thursday Data: CPI, Jobless claim , Retail sales and PPI
Begin Trading June indices if you haven’t already: M = June
Spring your Clocks forward for those countries that subscribe to Daylight Savings.
Trading Resource of the Week : Understanding Open Interest by CMEgroup.com
Understanding Open Interest
Open interest is the total number of futures contracts held by market participants at the end of the trading day. It is used as an indicator to determine market sentiment and the strength behind price trends.
Unlike the total issued shares of a company, which typically remain constant, the number of outstanding futures contracts varies from day to day.
Open interest is calculated by adding all the contracts from opened trades and subtracting the contracts when a trade is closed.
For example, Sharon, Cynthia and Kurt are trading the same futures contract. If Sharon buys one contract to enter a long trade, open interest increases by one. Cynthia also goes long and buys six contracts, thereby increasing open interest to seven. If Kurt decides to short the market and sells three contracts, open interest again increases to 10.
Open interest would remain at 10 until the traders exit their positions, at which point open interest declines. For example, open interest declines to nine when Sharon sells one contract. When Kurt decides to exit his position, he buys back his three contracts and brings open interest down to six. At this point, until Cynthia decides to sell her six contracts, open interest will remain constant at six.
Open interest and volume are related concepts, one key difference is that volume counts all contracts that have been traded, while open interest is a total of contracts that remain open in the market.
Traders can think of open interest as the cash flowing to the market. As open interest increases, more money is moving into the futures contract and as open interest declines money is moving out of the futures contract.
CME Group products with the largest open interest include Eurodollars, Treasuries and stock index futures.
Open Interest Analysis
Analysts typically use open interest to confirm the strength of a trend. Increasing open interest is typically a confirmation of the trend whereas decreasing open interest can be a signal that the trend is losing strength.
The idea is that traders are supporting the trend by entering the market that increases the open interest. As traders lose faith in the trend they exit the market and open interest declines.
Open interest data is published at the end of each day. Additionally, every Friday afternoon, the CFTC publishes a report called the Commitment of Traders.
This report details open interest from different classes of market participants and whether they are holding a long or short position. This breakdown offers valuable insights into what producers, merchants, processors, users, swap dealers and money managers are doing in the market for a futures contract.
Open interest is one variable that many futures traders use in their analysis of the markets used in conjunction with other analysis to support trade decisions. Large changes in open interest can be an indicator when certain participants are entering or leaving the market and may give clues to market direction.
Hot Market of the Week – May Wheat
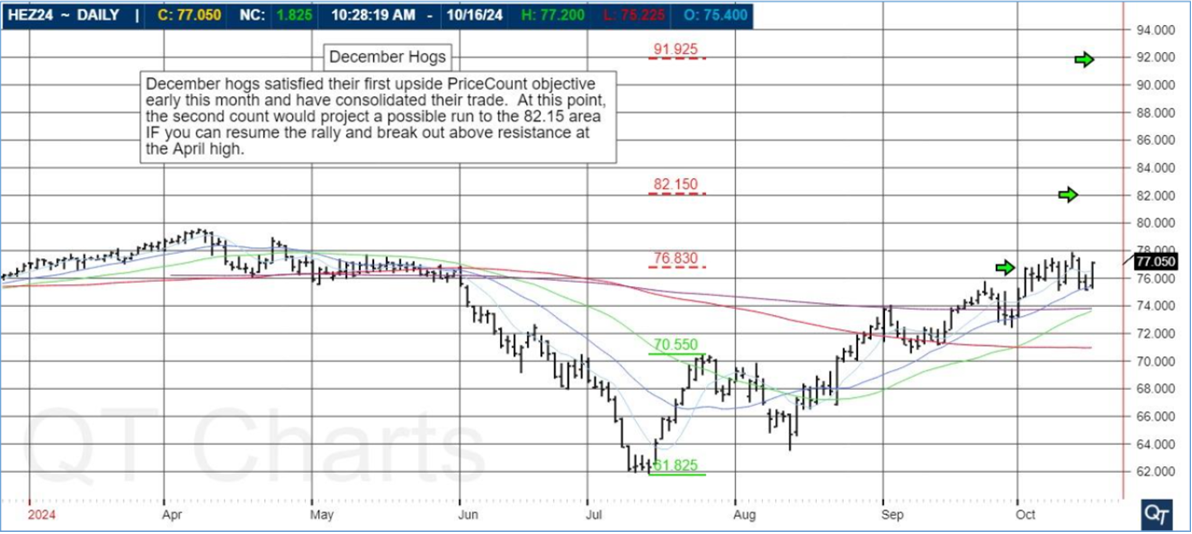
Hot market of the week is provided by QT Market Center, A Swiss army knife charting package that’s not just for Hedgers, Cooperatives and Farmers alike but also for Spread traders, Swing traders and shorter time frame application for intraday traders with a unique proprietary indicator that can be applied to your specific trading needs.
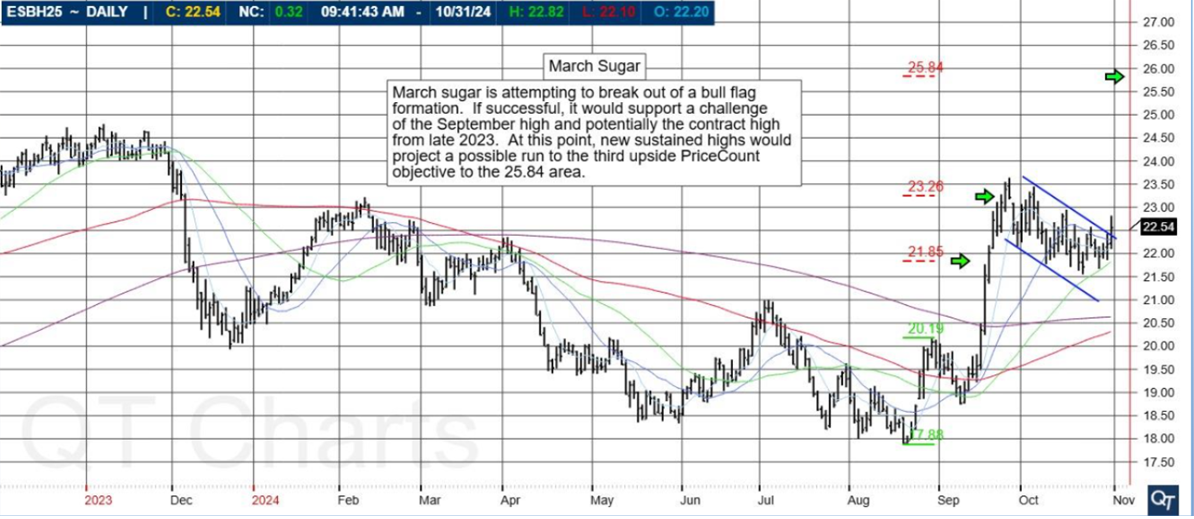
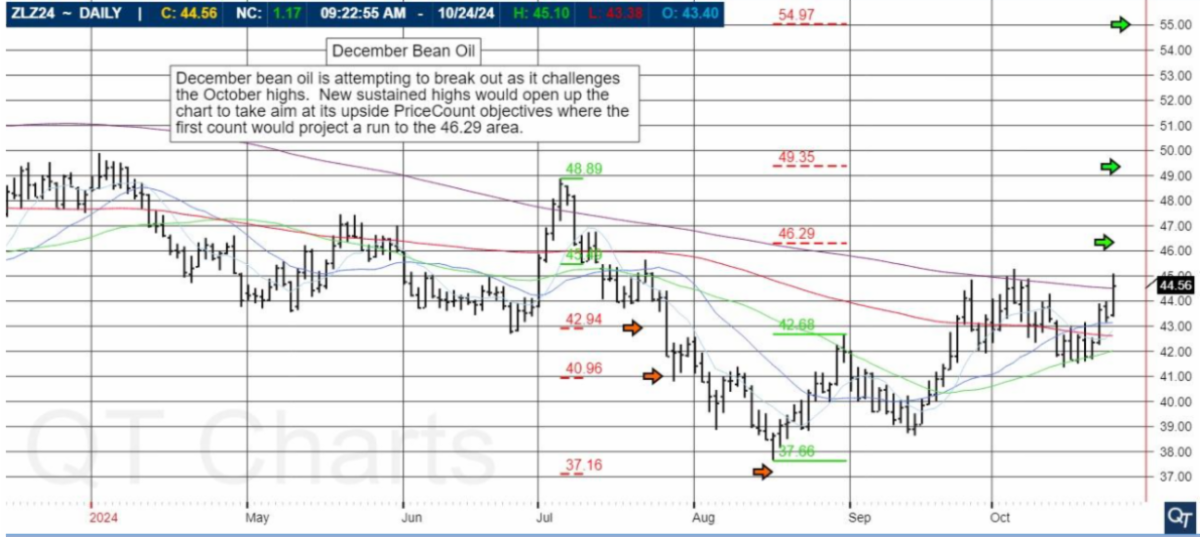
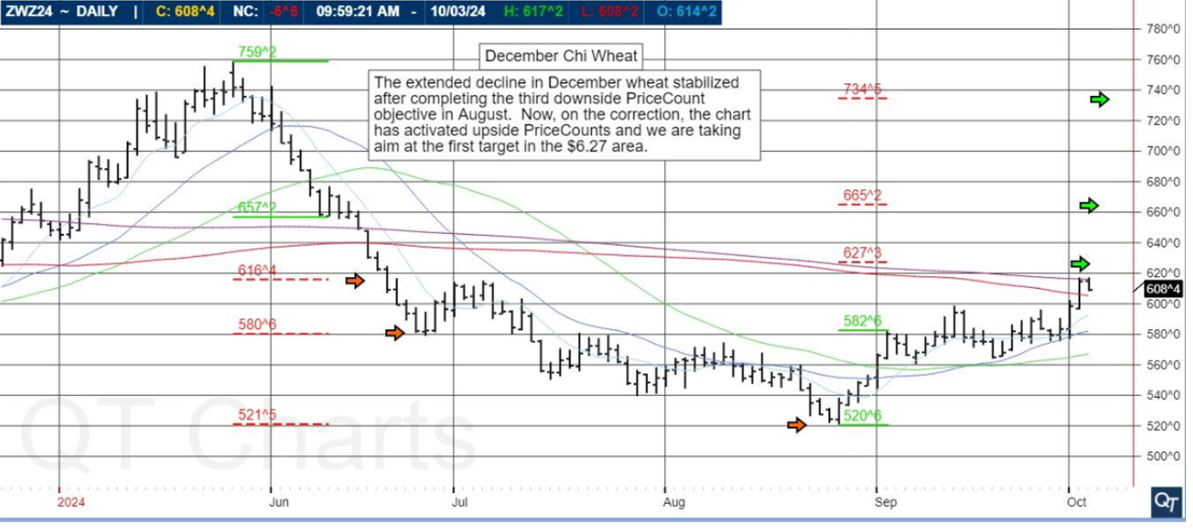
May wheat in Chicago broke down into a new contract low yesterday where the chart satisfied its third downside PriceCount objective. It would be normal to get a near term reaction from this level in the form of a consolidation or corrective trade, at least. At this point, IF you can sustain further weakness, we are left with the low percentage fourth objective to aim for around $4.20.
PriceCounts – Not about where we’ve been , but where we might be going next!
The PriceCount study is a tool that can help to project the distance of a move in price. The counts are not intended to be an ‘exact’ science but rather offer a target area for the four objectives which are based off the first leg of a move with each subsequent count having a smaller percentage of being achieved. It is normal for the chart to react by correcting or consolidating at an objective and then either resuming its move or reversing trend. Best utilized in conjunction with other technical tools, PriceCounts offer one more way to analyze charts and help to manage your positions and risk. Learn more at www.qtchartoftheday.com
Trading in futures, options, securities, derivatives or OTC products entails significant risks which must be understood prior to trading and may not be appropriate for all investors. Past performance of actual trades or strategies is not necessarily indicative of future results.
Broker’s Trading System of the Week
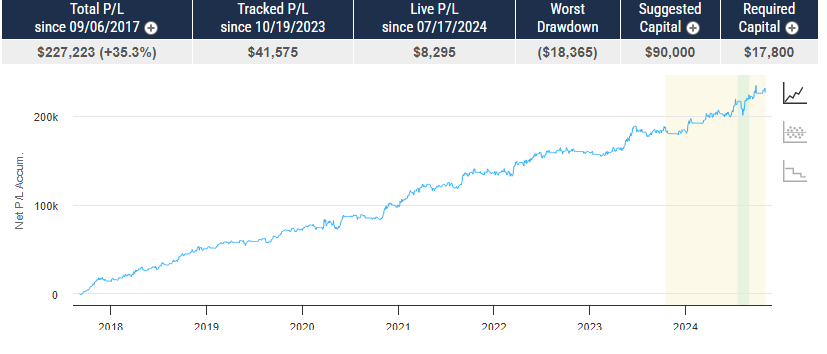
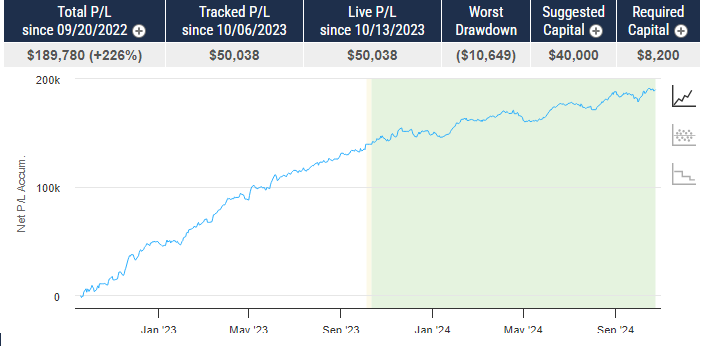
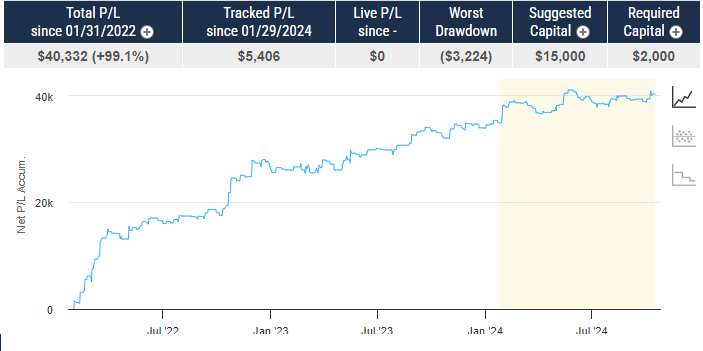
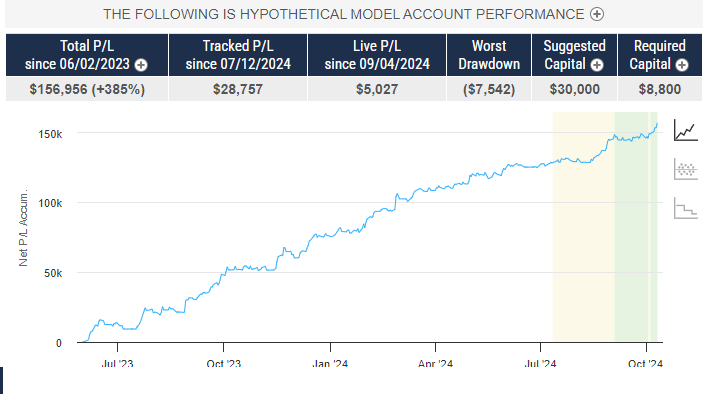
With algorithmic trading systems becoming more prevalent in portfolio diversification, the following system has been selected as the broker’s choice for this month.
The performance shown above is hypothetical in that the chart represents returns in a model account. The model account rises or falls by the average single contract profit and loss achieved by clients trading actual money pursuant to the listed system’s trading signals on the appropriate dates (client fills), or if no actual client profit or loss available – by the hypothetical single contract profit and loss of trades generated by the system’s trading signals on that day in real time (real‐time) less slippage, or if no real time profit or loss available – by the hypothetical single contract profit and loss of trades generated by running the system logic backwards on back adjusted data. Please read full disclaimer HERE.
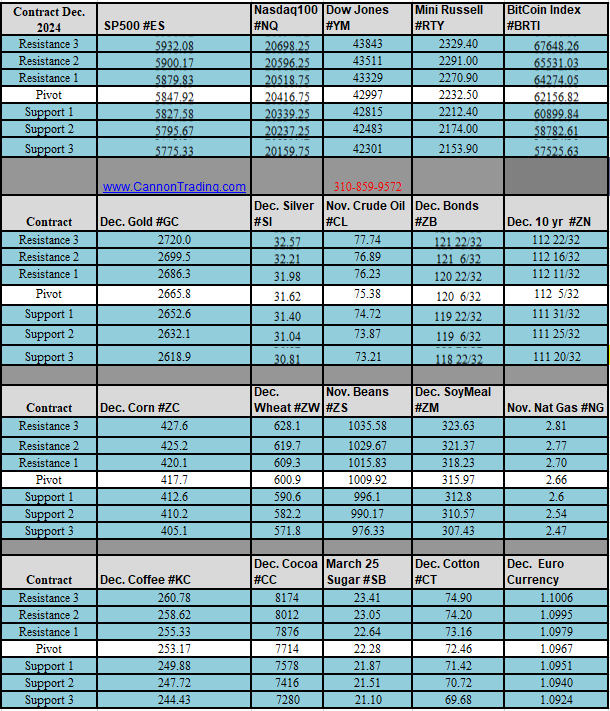
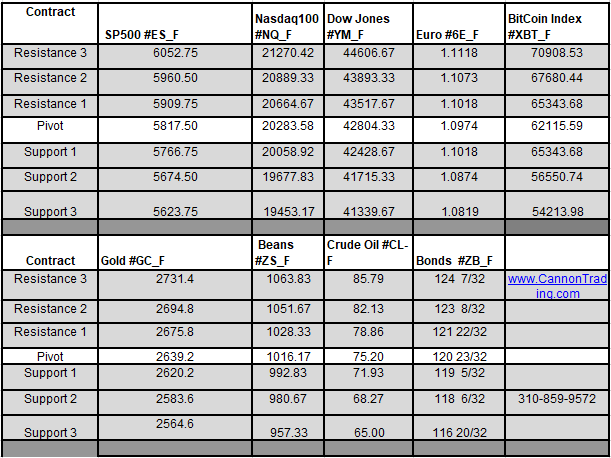
Would you like to receive daily support & resistance levels?
* This is not a solicitation of any order to buy or sell, but a current market view provided by Cannon Trading Inc. Any statement of facts here in contained are derived from sources believed to be reliable, but are not guaranteed as to accuracy, nor they purport to be complete. No responsibility is assumed with respect to any such statement or with respect to any expression of opinion herein contained. Readers are urged to exercise their own judgement in trading.
Watch an Example below using Sierra Charts from February 21st.
You will see the predicted TURNING POINTS marked on the ES intraday chart.
Hot Market of the Week – July Wheat
Hot market of the week is provided by QT Market Center, A Swiss army knife charting package that’s not just for Hedgers, Cooperatives and Farmers alike but also for Spread traders, Swing traders and shorter time frame application for intraday traders with a unique proprietary indicator that can be applied to your specific trading needs.
July wheat satisfied its third downside PriceCount objective and reacted with a key reversal with follow through to start today. At this point, IF the chart can resume its break with new sustained lows, we are left with only the low percentage fourth count to aim for in in the $4.62 area.
PriceCounts – Not about where we’ve been , but where we might be going next!
The PriceCount study is a tool that can help to project the distance of a move in price. The counts are not intended to be an ‘exact’ science but rather offer a target area for the four objectives which are based off the first leg of a move with each subsequent count having a smaller percentage of being achieved. It is normal for the chart to react by correcting or consolidating at an objective and then either resuming its move or reversing trend. Best utilized in conjunction with other technical tools, PriceCounts offer one more way to analyze charts and help to manage your positions and risk. Learn more at www.qtchartoftheday.com
Trading in futures, options, securities, derivatives or OTC products entails significant risks which must be understood prior to trading and may not be appropriate for all investors. Past performance of actual trades or strategies is not necessarily indicative of future results.
Broker’s Trading System of the Week
With algorithmic trading systems becoming more prevalent in portfolio diversification, the following system has been selected as the broker’s choice for this month.
The performance shown above is hypothetical in that the chart represents returns in a model account. The model account rises or falls by the average single contract profit and loss achieved by clients trading actual money pursuant to the listed system’s trading signals on the appropriate dates (client fills), or if no actual client profit or loss available – by the hypothetical single contract profit and loss of trades generated by the system’s trading signals on that day in real time (real‐time) less slippage, or if no real time profit or loss available – by the hypothetical single contract profit and loss of trades generated by running the system logic backwards on back adjusted data. Please read full disclaimer HERE.
Would you like to receive daily support & resistance levels?
* This is not a solicitation of any order to buy or sell, but a current market view provided by Cannon Trading Inc. Any statement of facts here in contained are derived from sources believed to be reliable, but are not guaranteed as to accuracy, nor they purport to be complete. No responsibility is assumed with respect to any such statement or with respect to any expression of opinion herein contained. Readers are urged to exercise their own judgement in trading.
Trading Resource of the Week : Real Time Email Alerts Directly to your Phone!
Self-Study Guide to Hedging with Grain and Oilseed Futures and Options. Regardless if you are a farmer, rancher or simply looking to trade grains and livestock futures, this guide will help you understand the ins and outs of trading and hedging using futures and options.
You will receive an email each time there is an entry or exit in a simple language along with the current price for that specific market.
A licensed series 3 broker at your fingertips
Email alerts available to US and Canada and Int’l clients
Hot market of the week is provided by QT Market Center, A Swiss army knife charting package that’s not just for Hedgers, Cooperatives and Farmers alike but also for Spread traders, Swing traders and shorter time frame application for intraday traders with a unique proprietary indicator that can be applied to your specific trading needs.
April crude oil activated upside PriceCounts last month but has continued to struggle with resistance around $78. If the chart can extend its rally with a sustained trade above $78, the first count would project a run to the 81.98 area.
PriceCounts – Not about where we’ve been , but where we might be going next!
The PriceCount study is a tool that can help to project the distance of a move in price. The counts are not intended to be an ‘exact’ science but rather offer a target area for the four objectives which are based off the first leg of a move with each subsequent count having a smaller percentage of being achieved. It is normal for the chart to react by correcting or consolidating at an objective and then either resuming its move or reversing trend. Best utilized in conjunction with other technical tools, PriceCounts offer one more way to analyze charts and help to manage your positions and risk. Learn more at www.qtchartoftheday.com
Trading in futures, options, securities, derivatives or OTC products entails significant risks which must be understood prior to trading and may not be appropriate for all investors. Past performance of actual trades or strategies is not necessarily indicative of future results.
Broker’s Trading System of the Week
With algorithmic trading systems becoming more prevalent in portfolio diversification, the following system has been selected as the broker’s choice for this month.
The performance shown above is hypothetical in that the chart represents returns in a model account. The model account rises or falls by the average single contract profit and loss achieved by clients trading actual money pursuant to the listed system’s trading signals on the appropriate dates (client fills), or if no actual client profit or loss available – by the hypothetical single contract profit and loss of trades generated by the system’s trading signals on that day in real time (real‐time) less slippage, or if no real time profit or loss available – by the hypothetical single contract profit and loss of trades generated by running the system logic backwards on back adjusted data. Please read full disclaimer HERE.
Would you like to receive daily support & resistance levels?
* This is not a solicitation of any order to buy or sell, but a current market view provided by Cannon Trading Inc. Any statement of facts here in contained are derived from sources believed to be reliable, but are not guaranteed as to accuracy, nor they purport to be complete. No responsibility is assumed with respect to any such statement or with respect to any expression of opinion herein contained. Readers are urged to exercise their own judgement in trading.
Important Notices – 1099 Forms, Valentines Day, Chinese New year
Trading Resource of the Week – Trade Alerts via Text/email
Hot Market of the Week – March SoyMeal
Broker’s Trading System of the Week – Unleaded Gasoline Swing Trading System
Trading Levels for Next Week
Trading Reports for Next Week
Important Notices –
1099 forms will be generated for all futures trading accounts held by US clients that placed any trades during the 2023 calendar year. Traders should expect to receive their 1099 forms via mail, email or through their portal in early February.
1099 forms will be provided directly from the FCM to the client.
Important Events Coming Up:
Chinese New Year
CPI
Valentines day
Earnings
Fed Speakers
More Data including PPI
Trading Resource of the Week : Real Time Email Alerts Directly to your Phone!
Self-Study Guide to Hedging with Grain and Oilseed Futures and Options. Regardless if you are a farmer, rancher or simply looking to trade grains and livestock futures, this guide will help you understand the ins and outs of trading and hedging using futures and options.
You will receive an email each time there is an entry or exit in a simple language along with the current price for that specific market.
A licensed series 3 broker at your fingertips
Email alerts available to US and Canada and Int’l clients
Hot market of the week is provided by QT Market Center, A Swiss army knife charting package that’s not just for Hedgers, Cooperatives and Farmers alike but also for Spread traders, Swing traders and shorter time frame application for intraday traders with a unique proprietary indicator that can be applied to your specific trading needs.
March soymeal resumed its slide where the chart is approaching its third downside PriceCount objective in the $340 area. It would be normal to get a reaction after completing the objective in the form of a near term consolidation or corrective trade, at least. The low percentage fourth count to $231 is not shown here for relevancy but the weekly chart shows significant downside potential remains on a longer term basis.
PriceCounts – Not about where we’ve been , but where we might be going next!
The PriceCount study is a tool that can help to project the distance of a move in price. The counts are not intended to be an ‘exact’ science but rather offer a target area for the four objectives which are based off the first leg of a move with each subsequent count having a smaller percentage of being achieved. It is normal for the chart to react by correcting or consolidating at an objective and then either resuming its move or reversing trend. Best utilized in conjunction with other technical tools, PriceCounts offer one more way to analyze charts and help to manage your positions and risk. Learn more at www.qtchartoftheday.com
Trading in futures, options, securities, derivatives or OTC products entails significant risks which must be understood prior to trading and may not be appropriate for all investors. Past performance of actual trades or strategies is not necessarily indicative of future results.
Broker’s Trading System of the Week
With algorithmic trading systems becoming more prevalent in portfolio diversification, the following system has been selected as the broker’s choice for this month.
The performance shown above is hypothetical in that the chart represents returns in a model account. The model account rises or falls by the average single contract profit and loss achieved by clients trading actual money pursuant to the listed system’s trading signals on the appropriate dates (client fills), or if no actual client profit or loss available – by the hypothetical single contract profit and loss of trades generated by the system’s trading signals on that day in real time (real‐time) less slippage, or if no real time profit or loss available – by the hypothetical single contract profit and loss of trades generated by running the system logic backwards on back adjusted data. Please read full disclaimer HERE.
Would you like to receive daily support & resistance levels?
* This is not a solicitation of any order to buy or sell, but a current market view provided by Cannon Trading Inc. Any statement of facts here in contained are derived from sources believed to be reliable, but are not guaranteed as to accuracy, nor they purport to be complete. No responsibility is assumed with respect to any such statement or with respect to any expression of opinion herein contained. Readers are urged to exercise their own judgement in trading.
Important Notices – 1099 Forms, CME Fees, FN & LT Days
Trading Resource of the Week – Futures Hedging Self Study Guide
Hot Market of the Week – March Copper
Broker’s Trading System of the Week – ES Day Trading System
Trading Levels for Next Week
Trading Reports for Next Week
Important Notices –
1099 forms will be generated for all futures trading accounts held by US clients that placed any trades during the 2023 calendar year. Traders should expect to receive their 1099 forms via mail, email or through their portal in early February.
1099 forms will be provided directly from the FCM to the client.
CME Fees Increase Update:
In a Special Executive Report released by the CME Group, it was announced that effective February 1, 2024, a number of transaction fees will see amended (increased) exchange / transaction fees.
Effective February 1, the CME Group is raising the exchange fees for a number of futures contracts.
For the COMEX metals products: Gold (GC), Silver (SI), Copper (HG) and Platinum (PL) fees are going up by 5 cents, from $1.55 to $1.60
For the COMEX E-mini metals products: miNY gold (QO), miNY silver (QI), miNY copper (QC) fees are going up by 25 cents, from $0.75 to $1.00
566 earnings reports next week
WASDE Report
Below are the contracts which are entering First Notice or Last Trading Day for the upcoming month. Be advised, for contracts that are deliverable, it is requested that all LONG positions be exited two days prior to First Notice and ALL positions be exited the day prior to Last Trading Day.
Trading Resource of the Week : Futures Hedging Self Study Guide!
Self-Study Guide to Hedging with Grain and Oilseed Futures and Options. Regardless if you are a farmer, rancher or simply looking to trade grains and livestock futures, this guide will help you understand the ins and outs of trading and hedging using futures and options.
Hot market of the week is provided by QT Market Center, A Swiss army knife charting package that’s not just for Hedgers, Cooperatives and Farmers alike but also for Spread traders, Swing traders and shorter time frame application for intraday traders with a unique proprietary indicator that can be applied to your specific trading needs.
March copper completed its first upside PriceCount objective and has settled into a range bound trade. IF the chart can resume its rally with new sustained highs, it would project a possible run to the second count in the 4.03 area, consistent with a challenge of the August high.
PriceCounts – Not about where we’ve been , but where we might be going next!
The PriceCount study is a tool that can help to project the distance of a move in price. The counts are not intended to be an ‘exact’ science but rather offer a target area for the four objectives which are based off the first leg of a move with each subsequent count having a smaller percentage of being achieved. It is normal for the chart to react by correcting or consolidating at an objective and then either resuming its move or reversing trend. Best utilized in conjunction with other technical tools, PriceCounts offer one more way to analyze charts and help to manage your positions and risk. Learn more at www.qtchartoftheday.com
Trading in futures, options, securities, derivatives or OTC products entails significant risks which must be understood prior to trading and may not be appropriate for all investors. Past performance of actual trades or strategies is not necessarily indicative of future results.
Broker’s Trading System of the Week
With algorithmic trading systems becoming more prevalent in portfolio diversification, the following system has been selected as the broker’s choice for this month.
The performance shown above is hypothetical in that the chart represents returns in a model account. The model account rises or falls by the average single contract profit and loss achieved by clients trading actual money pursuant to the listed system’s trading signals on the appropriate dates (client fills), or if no actual client profit or loss available – by the hypothetical single contract profit and loss of trades generated by the system’s trading signals on that day in real time (real‐time) less slippage, or if no real time profit or loss available – by the hypothetical single contract profit and loss of trades generated by running the system logic backwards on back adjusted data. Please read full disclaimer HERE.
Would you like to receive daily support & resistance levels?
* This is not a solicitation of any order to buy or sell, but a current market view provided by Cannon Trading Inc. Any statement of facts here in contained are derived from sources believed to be reliable, but are not guaranteed as to accuracy, nor they purport to be complete. No responsibility is assumed with respect to any such statement or with respect to any expression of opinion herein contained. Readers are urged to exercise their own judgement in trading.
Important Notices – 2024 World Cup Trading Championship
Trading Resource of the Week – FREE Trader’s Consultation
Hot Market of the Week – April Hogs
Broker’s Trading System of the Week – NQ Swing Trading System
Trading Levels for Next Week
Trading Reports for Next Week
Important Notices –
The 2024 World Cup Trading Championships® are just around the corner.
You are invited to enter the ultimate trading challenge, where some of the world’s best Futures and Forex traders compete.
The World Cup Trading Championships have been held since 1983 and are the most prestigious trading competitions in the industry. The winners of each division will prove that they are the best of the best.
The top profitable Entrants will be eligible to receive a magnificent pewter Bull and Bear trophy or a beautiful crystal Bull and Bear Trophy.
Real-money competitions based on net returns – no entry fee required.
Take on traders from across the globe to compete for coveted Bull & Bear trophies, glory, and new career opportunities.
Contact us at 1-310-859-9572 or Visit Us on the Web
Trading Resource of the Week : Book a Trading Consultation ( FREE, no obligation!)with a Cannon Trading Series 3 Broker
Available to both Clients and prospects!
Immediately increase your software and computer competence
Valuable order entry tips
Help create a personalized workspace
Compare multiple trading software
Get to know your Broker
Learning Options strategies
In this complimentary call or screen share session, which can last up to 30 minutes, you will have the opportunity to seek guidance and pose questions to our expert on a wide range of topics. These topics include, but are not limited to:
– Gaining insight into day trading margins.
– Assessing and reviewing various trading platforms and technologies.
Hot market of the week is provided by QT Market Center, A Swiss army knife charting package that’s not just for Hedgers, Cooperatives and Farmers alike but also for Spread traders, Swing traders and shorter time frame application for intraday traders with a unique proprietary indicator that can be applied to your specific trading needs.
April hogs stabilized their slide after completing the first downside PriceCount objective. Now, on the correction higher, the chart has activated upside counts and is taking aim at the first target in the 84.98 area.
PriceCounts – Not about where we’ve been , but where we might be going next!
The PriceCount study is a tool that can help to project the distance of a move in price. The counts are not intended to be an ‘exact’ science but rather offer a target area for the four objectives which are based off the first leg of a move with each subsequent count having a smaller percentage of being achieved. It is normal for the chart to react by correcting or consolidating at an objective and then either resuming its move or reversing trend. Best utilized in conjunction with other technical tools, PriceCounts offer one more way to analyze charts and help to manage your positions and risk. Learn more at www.qtchartoftheday.com
Trading in futures, options, securities, derivatives or OTC products entails significant risks which must be understood prior to trading and may not be appropriate for all investors. Past performance of actual trades or strategies is not necessarily indicative of future results.
Broker’s Trading System of the Week
With algorithmic trading systems becoming more prevalent in portfolio diversification, the following system has been selected as the broker’s choice for this month.
The performance shown above is hypothetical in that the chart represents returns in a model account. The model account rises or falls by the average single contract profit and loss achieved by clients trading actual money pursuant to the listed system’s trading signals on the appropriate dates (client fills), or if no actual client profit or loss available – by the hypothetical single contract profit and loss of trades generated by the system’s trading signals on that day in real time (real‐time) less slippage, or if no real time profit or loss available – by the hypothetical single contract profit and loss of trades generated by running the system logic backwards on back adjusted data. Please read full disclaimer HERE.
Would you like to receive daily support & resistance levels?
* This is not a solicitation of any order to buy or sell, but a current market view provided by Cannon Trading Inc. Any statement of facts here in contained are derived from sources believed to be reliable, but are not guaranteed as to accuracy, nor they purport to be complete. No responsibility is assumed with respect to any such statement or with respect to any expression of opinion herein contained. Readers are urged to exercise their own judgement in trading.
Join our private Facebook group for additional insight into trading and the futures markets!
In this issue:
Important Notices – 2024 World Cup Trading Championship
Trading Resource of the Week – Why Most Traders Lose?
Hot Market of the Week – March Feeder Cattle
Broker’s Trading System of the Week – MidCap Swing Trading System
Trading Levels for Next Week
Trading Reports for Next Week
Important Notices
The 2024 World Cup Trading Championships® are just around the corner.
You are invited to enter the ultimate trading challenge, where some of the world’s best Futures and Forex traders compete.
The World Cup Trading Championships have been held since 1983 and are the most prestigious trading competitions in the industry. The winners of each division will prove that they are the best of the best.
The top profitable Entrants will be eligible to receive a magnificent pewter Bull and Bear trophy or a beautiful crystal Bull and Bear Trophy.
Real-money competitions based on net returns – no entry fee required.
Take on traders from across the globe to compete for coveted Bull & Bear trophies, glory, and new career opportunities.
Hot market of the week is provided by QT Market Center, A Swiss army knife charting package that’s not just for Hedgers, Cooperatives and Farmers alike but also for Spread traders, Swing traders and shorter time frame application for intraday traders with a unique proprietary indicator that can be applied to your specific trading needs.
March feeder cattle stabilized their break last month after satisfying the fourth downside PriceCount objective. On the correction higher, the chart activated upside counts with the first objective projecting a run to the 238.53 area.
PriceCounts – Not about where we’ve been , but where we might be going next!
The PriceCount study is a tool that can help to project the distance of a move in price. The counts are not intended to be an ‘exact’ science but rather offer a target area for the four objectives which are based off the first leg of a move with each subsequent count having a smaller percentage of being achieved. It is normal for the chart to react by correcting or consolidating at an objective and then either resuming its move or reversing trend. Best utilized in conjunction with other technical tools, PriceCounts offer one more way to analyze charts and help to manage your positions and risk. Learn more at www.qtchartoftheday.com
Trading in futures, options, securities, derivatives or OTC products entails significant risks which must be understood prior to trading and may not be appropriate for all investors. Past performance of actual trades or strategies is not necessarily indicative of future results.
Broker’s Trading System of the Week
With algorithmic trading systems becoming more prevalent in portfolio diversification, the following system has been selected as the broker’s choice for this month.
The performance shown above is hypothetical in that the chart represents returns in a model account. The model account rises or falls by the average single contract profit and loss achieved by clients trading actual money pursuant to the listed system’s trading signals on the appropriate dates (client fills), or if no actual client profit or loss available – by the hypothetical single contract profit and loss of trades generated by the system’s trading signals on that day in real time (real‐time) less slippage, or if no real time profit or loss available – by the hypothetical single contract profit and loss of trades generated by running the system logic backwards on back adjusted data. Please read full disclaimer HERE.
Questions about the markets? trading? platforms? technology? trading systems? Get answers with a complimentary, confidential consultation with a Cannon Trading Company series 3 broker.
Would you like to receive daily support & resistance levels?
First Notice (FN), Last trading (LT) Days for the Week: www.mrci.com
This is not a solicitation of any order to buy or sell, but a current market view provided by Cannon Trading Inc. Any statement of facts herein contained are derived from sources believed to be reliable but are not guaranteed as to accuracy, nor they purport to be complete. No responsibility is assumed with respect to any such statement or with respect to any expression of opinion herein contained. Readers are urged to exercise their own judgment in trading.
Good Trading!
Trading Futures, Options on Futures, and retail off-exchange foreign currency transactions involves substantial risk of loss and is not suitable for all investors. You should carefully consider whether trading is suitable for you in light of your circumstances, knowledge, and financial resources. You may lose all or more of your initial investment. Opinions, market data, and recommendations are subject to change at any time.
The 2024 World Cup Trading Championships® are just around the corner.
You are invited to enter the ultimate trading challenge, where some of the world’s best Futures and Forex traders compete.
The World Cup Trading Championships have been held since 1983 and are the most prestigious trading competitions in the industry. The winners of each division will prove that they are the best of the best.
The top profitable Entrants will be eligible to receive a magnificent pewter Bull and Bear trophy or a beautiful crystal Bull and Bear Trophy.
Real-money competitions based on net returns – no entry fee required.
Take on traders from across the globe to compete for coveted Bull & Bear trophies, glory, and new career opportunities.
Hot market of the week is provided by QT Market Center, A Swiss army knife charting package that’s not just for Hedgers, Cooperatives and Farmers alike but also for Spread traders, Swing traders and shorter time frame application for intraday traders with a unique proprietary indicator that can be applied to your specific trading needs.
February natural gas accelerated off its December low to complete its third upside PriceCount objective before settling back with a corrective trade. Now, the chart is threatening to resume its rally where new sustained highs would project a possible run to the low percentage fourth upside count to the 4.44 area.
PriceCounts – Not about where we’ve been , but where we might be going next!
The PriceCount study is a tool that can help to project the distance of a move in price. The counts are not intended to be an ‘exact’ science but rather offer a target area for the four objectives which are based off the first leg of a move with each subsequent count having a smaller percentage of being achieved. It is normal for the chart to react by correcting or consolidating at an objective and then either resuming its move or reversing trend. Best utilized in conjunction with other technical tools, PriceCounts offer one more way to analyze charts and help to manage your positions and risk. Learn more at www.qtchartoftheday.com
Trading in futures, options, securities, derivatives or OTC products entails significant risks which must be understood prior to trading and may not be appropriate for all investors. Past performance of actual trades or strategies is not necessarily indicative of future results.
Broker’s Trading System of the Week
With algorithmic trading systems becoming more prevalent in portfolio diversification, the following system has been selected as the broker’s choice for this month.
The performance shown above is hypothetical in that the chart represents returns in a model account. The model account rises or falls by the average single contract profit and loss achieved by clients trading actual money pursuant to the listed system’s trading signals on the appropriate dates (client fills), or if no actual client profit or loss available – by the hypothetical single contract profit and loss of trades generated by the system’s trading signals on that day in real time (real‐time) less slippage, or if no real time profit or loss available – by the hypothetical single contract profit and loss of trades generated by running the system logic backwards on back adjusted data. Please read full disclaimer HERE.
Questions about the markets? trading? platforms? technology? trading systems? Get answers with a complimentary, confidential consultation with a Cannon Trading Company series 3 broker.
Would you like to receive daily support & resistance levels?
First Notice (FN), Last trading (LT) Days for the Week: www.mrci.com
This is not a solicitation of any order to buy or sell, but a current market view provided by Cannon Trading Inc. Any statement of facts herein contained are derived from sources believed to be reliable but are not guaranteed as to accuracy, nor they purport to be complete. No responsibility is assumed with respect to any such statement or with respect to any expression of opinion herein contained. Readers are urged to exercise their own judgment in trading.
Good Trading!
Trading Futures, Options on Futures, and retail off-exchange foreign currency transactions involves substantial risk of loss and is not suitable for all investors. You should carefully consider whether trading is suitable for you in light of your circumstances, knowledge, and financial resources. You may lose all or more of your initial investment. Opinions, market data, and recommendations are subject to change at any time.
Over 1 Trillion $$ in Market Cap report Q4 ’23 earnings on Friday the 15th.
Those reporting: JPM(Chase), UNH (United Healthcare), BAC (Bank of America), WFC (Wells Fargo), C (Citibank), BLK (BlackRock)
In the Ag sector, what is touted as “the biggest USDA data dump of the year, presenting the opportunity for the most market-moving surprises” by Arlan Suderman StoneX lead Ag analyst.
USDA Supply/Demand and Annual Crop production numbers to be released @11:00 a.m. CST
Real Time Email Alerts
Directly to your Phone!
You will receive an email each time there is an entry or exit in a simple language along with the current price for that specific market.
A licensed series 3 broker at your fingertips
Email alerts available to US and Canada and Int’l clients
With algorithmic trading systems becoming more prevalent in portfolio diversification, the following system has been selected as the broker’s choice for this month.
The performance shown above is hypothetical in that the chart represents returns in a model account. The model account rises or falls by the average single contract profit and loss achieved by clients trading actual money pursuant to the listed system’s trading signals on the appropriate dates (client fills), or if no actual client profit or loss available – by the hypothetical single contract profit and loss of trades generated by the system’s trading signals on that day in real time (real‐time) less slippage, or if no real time profit or loss available – by the hypothetical single contract profit and loss of trades generated by running the system logic backwards on back adjusted data. Please read full disclaimer HERE.
Questions about the markets? trading? platforms? technology? trading systems? Get answers with a complimentary, confidential consultation with a Cannon Trading Company series 3 broker.
Would you like to receive daily support & resistance levels?
First Notice (FN), Last trading (LT) Days for the Week: www.mrci.com
This is not a solicitation of any order to buy or sell, but a current market view provided by Cannon Trading Inc. Any statement of facts herein contained are derived from sources believed to be reliable but are not guaranteed as to accuracy, nor they purport to be complete. No responsibility is assumed with respect to any such statement or with respect to any expression of opinion herein contained. Readers are urged to exercise their own judgment in trading.
Good Trading!
Trading Futures, Options on Futures, and retail off-exchange foreign currency transactions involves substantial risk of loss and is not suitable for all investors. You should carefully consider whether trading is suitable for you in light of your circumstances, knowledge, and financial resources. You may lose all or more of your initial investment. Opinions, market data, and recommendations are subject to change at any time.
Wishing ALL of you a happy, healthy and successful New Year!
The Trader’s Prayer
May I never be facing north when the markets headed south, and may locked limit always be on my side. 🤜🏼
May the money left on the table be someone else’s and may my pockets be deeper than the correction.
✋ May I always be 5 minutes ahead of the market, And may my order have a clear path to the pit (electronic exchange now days….).
✋ And if this one is a winner, I swear I quit!
Make 2024 Your Best Trading Year Yet – Walk before you run
By Cannon Trading staff
The image of a successful futures trader is that of a lone wolf surveying the landscape looking for an opportunity to attack and seize quick and substantial profits. We all know about the potential for making a fortune in the futures markets. Yet, few do so. Why is that? What are some of the common pitfalls that prevent this dream from becoming a reality for most futures traders?
One of the most prevalent misconceptions for inexperienced futures traders is that they believe themselves to be smarter than the rest of the commodities market participants. They underestimate the qualifications and abilities of the rest of the futures markets professionals. This business of commodities trading is dominated by very dedicated, resourceful professionals who have invested lots of time and assets into their pursuit of trading futures profits. Competing against these seasoned professionals is not impossible but going at it alone, especially initially, is usually not the most prudent course of action for new futures traders.
When we were children, we learned to walk before we learned to run. This is true for most of our life experiences. We played t-ball before we played baseball. We took lessons from Arthur Murray before we entered dance competitions. We watched cooking shows or read cookbooks before we attempted to deep fry our first turkey. So, why do so many novice futures traders think that they should enter into the world of futures trading without the support of an experienced futures broker? Why, armed with their computers and quote systems do they think that they are equipped to go it alone and be successful? It isn’t logical. It goes counter to our collective life experiences.
If your goal is to trade futures/commodities independently, why not do so after acquiring valuable experience and insight by working with a seasoned professional futures broker? Someone who is already fully engaged in the futures markets. Why not begin by using a mentor, a teacher, an advisor who can supply ideas, guidelines, disciplines, and insights that the novice trader could not otherwise be exposed to? We all learned to drive with the help of an instructor, why not approach the commodities markets in a similar fashion? Your hard-earned capital is at stake. Getting an education can be a very expensive process, especially in the futures trading business. Why not take advantage of the help offered by an experienced professional? Help like this can shorten a new futures trader’s learning curve and reduce the cost of his or her tuition for this education.
It is true that not all commodities brokers are quality teachers or mentors. The futures trader must choose his or her mentor carefully….just as one does when choosing a lawyer, doctor, or accountant. The futures brokers at Cannon Trading as a group are among the finest professionals that you will find anywhere in the futures trading world. The management at Cannon Trading has chosen these brokers prudently and after much scrutiny. This is evidenced by the impressive record of professional business conduct for the past 30 years by Cannon’s brokers. This record can be reviewed by going to www.nfa.futures.org ( the National Futures Association) website and comparing Cannon Trading versus other futures brokerage firms. You will be impressed.
Professional athletes use sports psychologists. Boxers use corner men. Graduate students study under the guidance of their professors. Professional singers utilize vocal coaches. Shouldn’t you as a futures trader avail yourself of the same sort of support that successful people in all of these endeavors use?
Hot market of the week is provided by QT Market Center, A swiss army knife charting package that’s not just for Hedgers, Cooperatives and Farmers alike but also for Spread traders, Swing traders and shorter time frame application for intraday traders with a unique proprietary indicator that can be applied to your specific trading needs.
March resumed its slide into new lows. At this point, a third PriceCount objective of 98.93 would coincide with summer lows.
PriceCounts – Not about where we’ve been , but where we might be going next!
The PriceCount study is a tool that can help to project the distance of a move in price. The counts are not intended to be an ‘exact’ science but rather offer a target area for the four objectives which are based off the first leg of a move with each subsequent count having a smaller percentage of being achieved. It is normal for the chart to react by correcting or consolidating at an objective and then either resuming its move or reversing trend. Best utilized in conjunction with other technical tools, PriceCounts offer one more way to analyze charts and help to manage your positions and risk. Learn more at www.qtchartoftheday.com
Trading in futures, options, securities, derivatives or OTC products entails significant risks which must be understood prior to trading and may not be appropriate for all investors. Past performance of actual trades or strategies is not necessarily indicative of future results.
Broker’s Trading System of the Week
With algorithmic trading systems becoming more prevalent in portfolio diversification, the following system has been selected as the broker’s choice for this month.
The performance shown above is hypothetical in that the chart represents returns in a model account. The model account rises or falls by the average single contract profit and loss achieved by clients trading actual money pursuant to the listed system’s trading signals on the appropriate dates (client fills), or if no actual client profit or loss available – by the hypothetical single contract profit and loss of trades generated by the system’s trading signals on that day in real time (real‐time) less slippage, or if no real time profit or loss available – by the hypothetical single contract profit and loss of trades generated by running the system logic backwards on back adjusted data. Please read full disclaimer HERE.
Questions about the markets? trading? platforms? technology? trading systems? Get answers with a complimentary, confidential consultation with a Cannon Trading Company series 3 broker.
Would you like to receive daily support & resistance levels?
First Notice (FN), Last trading (LT) Days for the Week: www.mrci.com
This is not a solicitation of any order to buy or sell, but a current market view provided by Cannon Trading Inc. Any statement of facts herein contained are derived from sources believed to be reliable but are not guaranteed as to accuracy, nor they purport to be complete. No responsibility is assumed with respect to any such statement or with respect to any expression of opinion herein contained. Readers are urged to exercise their own judgment in trading.
Good Trading!
Trading Futures, Options on Futures, and retail off-exchange foreign currency transactions involves substantial risk of loss and is not suitable for all investors. You should carefully consider whether trading is suitable for you in light of your circumstances, knowledge, and financial resources. You may lose all or more of your initial investment. Opinions, market data, and recommendations are subject to change at any time.
RISK DISCLOSURE: Past results are not necessarily indicative of future results. The risk of loss in futures trading can be substantial, carefully consider the inherent risks of such an investment in light of your financial condition.