Jump to a section in this post:
1. Market Commentary
2. Support and Resistance Levels – S&P, Nasdaq, Dow Jones, Russell 2000
3. Support and Resistance Levels – Gold, Euro, Crude Oil, T-Bonds
4. Support and Resistance Levels – March Corn, March Wheat, Jan Beans, March Silver
5.Economic Report for January 24, 2012
1. Market Commentary
A week full of reports ahead with the “star” coming out this Wednesday, that being FOMC.
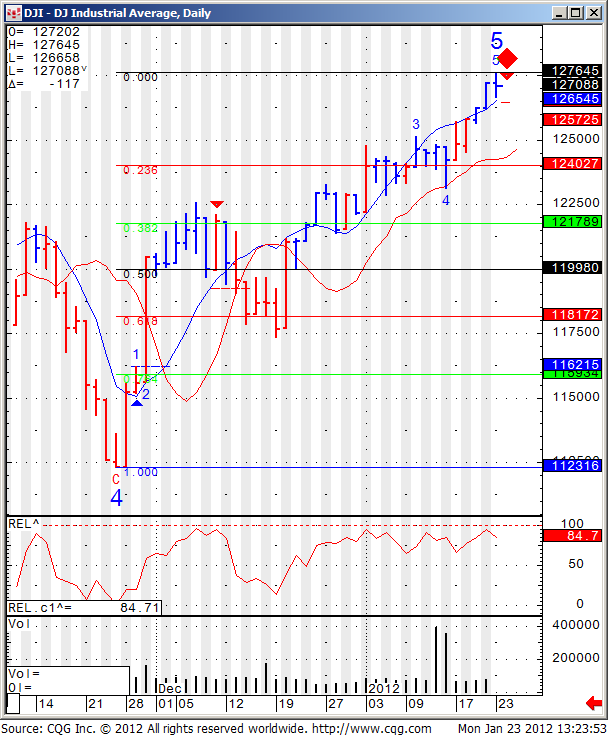
In between, you can view a chart of the Dow Jones Industrial chart with a possible small sell signal if the Dow Cash breaks below 12648.
Some of you may ask why am I showing the chart of the Dow Jones Cash Index? And my answer is that when it comes to stock indices, “Cash is King” and in this case the underlying asset for the Dow Jones futures ( and mini Dow Jones) is the Dow Jones Index, just like the SP500 cash index is the underlying for the mini SP500 futures.

2. Support and Resistance Levels – S&P, Nasdaq, Dow Jones, Russell 2000
| Contract (Dec. 2011) | SP500 (big & Mini) |
Nasdaq100 (big & Mini) |
Dow Jones (big & Mini) |
Mini Russell |
| Resistance Level 3 | 1330.00 | 2484.00 | 12791 | 800.57 |
| Resistance Level | 1324.00 | 2468.00 | 12748 | 794.23 |
| Resistance Level 1 | 1317.50 | 2452.00 | 12701 | 787.57 |
| Pivot Point | 1311.50 | 2436.00 | 12658 | 781.23 |
| Support Level | 1305.00 | 2420.00 | 12611 | 774.57 |
| Support Level 2 | 1299.00 | 2404.00 | 12568 | 768.23 |
| Support Level 3 | 1292.50 | 2388.00 | 12521 | 761.57 |
3. Support & Resistance Levels for Gold, Euro, Crude Oil, and U.S. T-Bonds
| Contract | Feb. Gold | Dec. Euro | Jan. Crude Oil | March. Bonds |
| Resistance Level 3 | 1704.1 | 1.3277 | 103.76 | 142 19/32 |
| Resistance Level 2 | 1693.0 | 1.3166 | 102.00 | 142 2/32 |
| Resistance Level 1 | 1685.3 | 1.3101 | 100.92 | 141 22/32 |
| Pivot Point | 1674.2 | 1.2990 | 99.16 | 141 5/32 |
| Support Level 1 | 1666.5 | 1.2925 | 98.08 | 140 25/32 |
| Support Level 2 | 1655.4 | 1.2814 | 96.32 | 140 8/32 |
| Support Level 3 | 1647.7 | 1.2749 | 95.24 | 139 28/32 |
4. Support & Resistance Levels for Corn, Wheat, Beans and Silver
| Contract | March Corn | March Wheat | Jan. Beans | March. Silver |
| Resistance Level 3 | 631.5 | 626.0 | 1234.50 | 3376.2 |
| Resistance Level 2 | 626.0 | 623.3 | 1226.50 | 3326.8 |
| Resistance Level 1 | 623.0 | 621.5 | 1222.00 | 3277.7 |
| Pivot Point | 617.5 | 618.8 | 1214.00 | 3228.3 |
| Support Level 1 | 614.5 | 617.0 | 1209.5 | 3179.2 |
| Support Level 2 | 609.0 | 614.3 | 1201.50 | 3129.8 |
| Support Level 3 | 606.0 | 612.5 | 1197.00 | 3080.7 |
5. Economic Reports
French Flash Services
3:00am
German Flash Manufacturing
3:30am
Flash Manufacturing
4:00am
Flash Services
4:00am
ECOFIN Meetings
All Day
Industrial New Orders
5:00am
Belgium NBB Business Climate
9:00am
Richmond Manufacturing Index
10:00am
President Obama Speaks
9:00pm
