Voted #1 Blog and #1 Brokerage Services on TraderPlanet for 2016!!
_____________________________________________________________
Dear Traders,
Oil Markets in Supply-Demand Tug of War
- 26 Oct 2017 www.cmegroup.com
- By Bluford Putnam
- Topics: Energy
U.S. West Texas Intermediate (WTI) crude oil has been stuck in a wide yet fairly well-defined trading range of $42 – $55 per barrel since September 2016. In the near-term, that range might shift modestly upward to $48 – $62, and drift lower over the long term by $10 to $15 per barrel.
High inventories and increased U.S. oil production have tended to push the price to the lower end of the range, while production cuts by the Organization of Petroleum Exporting Countries (OPEC), potential short-term supply disruptions, and incrementally stronger global economic growth have all worked to push the price into the upper portion of the range, and possibly expand the range toward $60 per barrel. Also, note that despite the lower volatility associated with range-bound trading, open interest in NYMEX WTI crude oil futures has soared to record highs as uncertainty in the oil market remains elevated even if volatility is low on a historical basis.
Long-Term Technology Themes Point to Lower Oil Prices
Trading Futures, Options on Futures, and retail off-exchange foreign currency transactions involves substantial risk of loss and is not suitable for all investors. You should carefully consider whether trading is suitable for you in light of your circumstances, knowledge, and financial resources. You may lose all or more of your initial investment. Opinions, market data, and recommendations are subject to change at any time.
Futures Trading Levels
10-27-2017
| Contract December 2017 | SP500 | Nasdaq100 | Dow Jones | Mini Russell | BitCoin Index |
| Resistance 3 | 2572.00 | 6111.83 | 23511 | 1511.07 | 6385.87 |
| Resistance 2 | 2568.50 | 6093.92 | 23457 | 1507.23 | 6185.39 |
| Resistance 1 | 2562.50 | 6070.83 | 23396 | 1502.37 | 6046.32 |
| Pivot | 2559.00 | 6052.92 | 23342 | 1498.53 | 5845.84 |
| Support 1 | 2553.00 | 6029.83 | 23281 | 1493.67 | 5706.77 |
| Support 2 | 2549.50 | 6011.92 | 23227 | 1489.83 | 5506.29 |
| Support 3 | 2543.50 | 5988.83 | 23166 | 1484.97 | 5367.22 |
| Contract | December Gold | Dec. Silver | Dec. Crude Oil | Dec. Bonds | Dec. Euro |
| Resistance 3 | 1296.7 | 17.26 | 53.75 | 152 15/32 | 1.2005 |
| Resistance 2 | 1290.2 | 17.15 | 53.24 | 152 2/32 | 1.1937 |
| Resistance 1 | 1279.3 | 16.97 | 52.94 | 151 12/32 | 1.1807 |
| Pivot | 1272.8 | 16.86 | 52.43 | 150 31/32 | 1.1739 |
| Support 1 | 1261.9 | 16.68 | 52.13 | 150 9/32 | 1.1610 |
| Support 2 | 1255.4 | 16.57 | 51.62 | 149 28/32 | 1.1542 |
| Support 3 | 1244.5 | 16.39 | 51.32 | 149 6/32 | 1.1412 |
| Contract | Dec. Corn | Dec. Wheat | November Beans | Dec. SoyMeal | Nov. Nat Gas |
| Resistance 3 | 354.3 | 441.9 | 985.08 | 319.00 | 3.16 |
| Resistance 2 | 353.2 | 439.6 | 981.92 | 317.50 | 3.13 |
| Resistance 1 | 351.8 | 435.7 | 976.58 | 314.80 | 3.09 |
| Pivot | 350.7 | 433.3 | 973.42 | 313.30 | 3.06 |
| Support 1 | 349.3 | 429.4 | 968.1 | 310.6 | 3.0 |
| Support 2 | 348.2 | 427.1 | 964.92 | 309.10 | 3.00 |
| Support 3 | 346.8 | 423.2 | 959.58 | 306.40 | 2.96 |
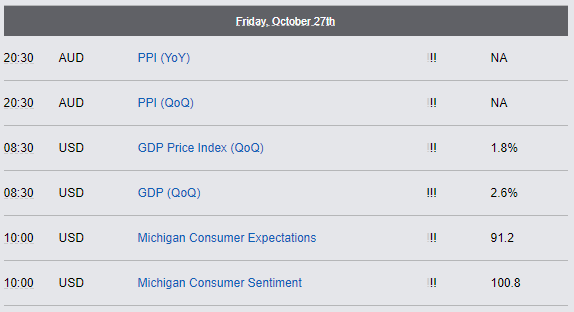
Economic Reports, source:

This is not a solicitation of any order to buy or sell, but a current market view provided by Cannon Trading Inc. Any statement of facts here in contained are derived from sources believed to be reliable, but are not guaranteed as to accuracy, nor they purport to be complete. No responsibility is assumed with respect to any such statement or with respect to any expression of opinion herein contained. Readers are urged to exercise their own judgement in trading.