Jump to a section in this post:
1. Market Commentary
2. Support and Resistance Levels – S&P, Nasdaq, Dow Jones, Russell 2000, Dollar Index
3. Support and Resistance Levels – Gold, Euro, Crude Oil, T-Bonds
4. Support and Resistance Levels – Corn, Wheat, Beans, Silver
5. Economic Reports for Wednesday June 13, 2012
Hello Traders,
Gold is holding some levels and starting to build somewhat of a bullish base in an attempt to make a run and break the 1641 high from last week?
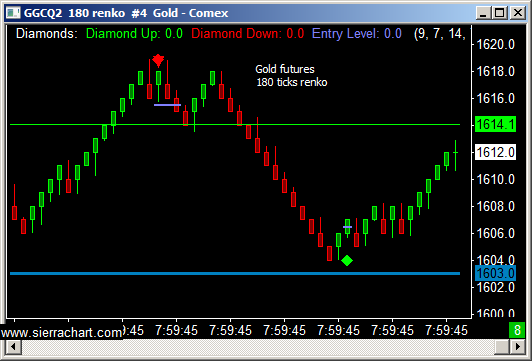
I think so but in between I wanted to share with you a screen shot from today’s trading session of my intraday gold chart.

Would you like to have access to my DIAMOND and TOPAZ ALGOs as shown above and be able to apply for any market and any time frame on your own PC ? You can now have a two weeks free trial where I enable the ALGO along with few studies for your own sierra/ ATcharts IN ADDITION to your free access into the “Live charts/ trading signals” room.
I think so but in between I wanted to share with you a screen shot from today’s trading session of my intraday gold chart.
To start your trial, please visit: https://www.cannontrading.com/tools/intraday-futures-trading-signals
Or
send me an email with the following information:
1. Are you currently trading futures?
2. Charting software you use?
3. If you use sierra or ATcharts, please let me know the user name so I can enable you
4. Markets you currently trading?
GOOD TRADING!
Trading Futures, Options on Futures, and retail off-exchange foreign currency transactions involves substantial risk of loss and is not suitable for all investors. You should carefully consider whether trading is suitable for you in light of your circumstances, knowledge, and financial resources. You may lose all or more of your initial investment. Opinions, market data, and recommendations are subject to change at any time.
2. Support and Resistance Levels – S&P, Nasdaq, Dow Jones, Russell 2000, Dollar Index
| Contract Sept. 2012 | SP500 (big & Mini) | Nasdaq100 (big & Mini) | Dow Jones (big & Mini) | Mini Russell | Dollar Index |
| Resistance 3 | 1340.40 | 2591.00 | 12701 | 776.57 | 83.09 |
| Resistance 2 | 1328.70 | 2566.50 | 12598 | 767.03 | 82.92 |
| Resistance 1 | 1322.60 | 2553.00 | 12544 | 761.77 | 82.68 |
| Pivot | 1310.90 | 2528.50 | 12441 | 752.23 | 82.52 |
| Support 1 | 1304.80 | 2515.00 | 12387 | 746.97 | 82.28 |
| Support 2 | 1293.10 | 2490.50 | 12284 | 737.43 | 82.11 |
| Support 3 | 1287.00 | 2477.00 | 12230 | 732.17 | 81.87 |
3. Support & Resistance Levels for Gold, Euro, Crude Oil, and U.S. T-Bonds
| Contract | Aug Gold | June Euro | July Crude Oil | Sept. Bonds | |
| Resistance 3 | 1656.8 | 1.2626 | 87.07 | 149 30/32 | |
| Resistance 2 | 1637.8 | 1.2578 | 85.40 | 149 18/32 | |
| Resistance 1 | 1624.3 | 1.2539 | 84.42 | 148 28/32 | |
| Pivot | 1605.3 | 1.2491 | 82.75 | 148 16/32 | |
| Support 1 | 1591.8 | 1.2452 | 81.77 | 147 26/32 | |
| Support 2 | 1572.8 | 1.2404 | 80.10 | 147 14/32 | |
| Support 3 | 1559.3 | 1.2365 | 79.12 | 146 24/32 |
4. Support & Resistance Levels for Corn, Wheat, Beans and Silver
| Contract | July Corn | July Wheat | July Beans | July Silver | |
| Resistance 3 | 605.8 | 649.3 | 1471.67 | 2995.3 | |
| Resistance 2 | 598.7 | 642.7 | 1458.33 | 2950.2 | |
| Resistance 1 | 591.3 | 629.3 | 1446.67 | 2921.8 | |
| Pivot | 584.2 | 622.7 | 1433.33 | 2876.7 | |
| Support 1 | 576.8 | 609.3 | 1421.7 | 2848.3 | |
| Support 2 | 569.7 | 602.7 | 1408.33 | 2803.2 | |
| Support 3 | 562.3 | 589.3 | 1396.67 | 2774.8 |
5. Economic Reports
source:http://www.forexfactory.com/calendar.php
All times are Eastern time Zone (EST)
This is not a solicitation of any order to buy or sell, but a current market view provided by Cannon Trading Inc. Any statement of facts herein contained are derived from sources believed to be reliable, but are not guaranteed as to accuracy, nor they purport to be complete. No responsibility is assumed with respect to any such statement or with respect to any expression of opinion herein contained. Readers are urged to exercise their own judgment in trading
 1:30am