____________________________________________________________
Voted #1 Blog and #1 Brokerage Services on TraderPlanet for 2016!!
_____________________________________________________________
Dear Traders,
Front month for stock indices is September.
Front month for currencies and financials is September.
Front month for crude oil and gold is August.
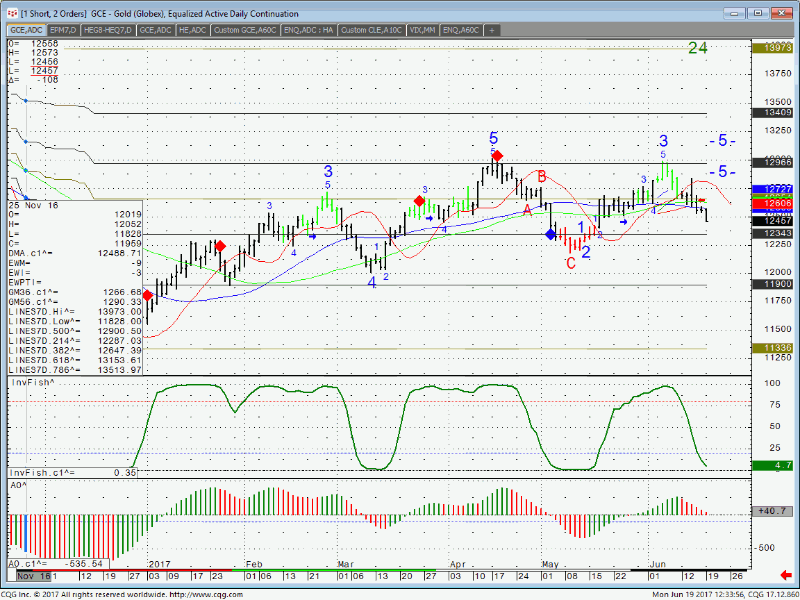
Gold daily chart for review below. Market has to hold support at $1234 in order for it to have a chance at a resumption of the rally:

Good Trading
Trading Futures, Options on Futures, and retail off-exchange foreign currency transactions involves substantial risk of loss and is not suitable for all investors. You should carefully consider whether trading is suitable for you in light of your circumstances, knowledge, and financial resources. You may lose all or more of your initial investment. Opinions, market data, and recommendations are subject to change at any time.
Futures Trading Levels
6-20-2017
| Contract September 2017 | SP500 | Nasdaq100 | Dow Jones | Mini Russell | Dollar Index |
| Resistance 3 | 2475.83 | 5909.00 | 21648 | 1435.53 | 97.97 |
| Resistance 2 | 2463.67 | 5845.75 | 21564 | 1428.47 | 97.63 |
| Resistance 1 | 2457.08 | 5809.75 | 21517 | 1423.43 | 97.43 |
| Pivot | 2444.92 | 5746.50 | 21433 | 1416.37 | 97.09 |
| Support 1 | 2438.33 | 5710.50 | 21386 | 1411.33 | 96.90 |
| Support 2 | 2426.17 | 5647.25 | 21302 | 1404.27 | 96.56 |
| Support 3 | 2419.58 | 5611.25 | 21255 | 1399.23 | 96.36 |
| Contract | August Gold | July Silver | August Crude Oil | Sept. Bonds | Sept. Euro |
| Resistance 3 | 1265.8 | 16.83 | 45.95 | 156 19/32 | 1.1318 |
| Resistance 2 | 1261.5 | 16.76 | 45.62 | 156 11/32 | 1.1293 |
| Resistance 1 | 1253.8 | 16.61 | 44.99 | 155 28/32 | 1.1248 |
| Pivot | 1249.5 | 16.53 | 44.66 | 155 20/32 | 1.1223 |
| Support 1 | 1241.8 | 16.38 | 44.03 | 155 5/32 | 1.1178 |
| Support 2 | 1237.5 | 16.31 | 43.70 | 154 29/32 | 1.1153 |
| Support 3 | 1229.8 | 16.16 | 43.07 | 154 14/32 | 1.1108 |
| Contract | July Corn | July Wheat | July Beans | July SoyMeal | July Nat Gas |
| Resistance 3 | 385.7 | 478.4 | 950.08 | 309.63 | 3.05 |
| Resistance 2 | 383.6 | 475.8 | 947.42 | 306.97 | 3.01 |
| Resistance 1 | 379.4 | 471.4 | 942.58 | 304.23 | 2.95 |
| Pivot | 377.3 | 468.8 | 939.92 | 301.57 | 2.91 |
| Support 1 | 373.2 | 464.4 | 935.1 | 298.8 | 2.9 |
| Support 2 | 371.1 | 461.8 | 932.42 | 296.17 | 2.82 |
| Support 3 | 366.9 | 457.4 | 927.58 | 293.43 | 2 |
Economic Reports, source:
This is not a solicitation of any order to buy or sell, but a current market view provided by Cannon Trading Inc. Any statement of facts here in contained are derived from sources believed to be reliable, but are not guaranteed as to accuracy, nor they purport to be complete. No responsibility is assumed with respect to any such statement or with respect to any expression of opinion herein contained. Readers are urged to exercise their own judgement in trading.
