Cannon Trading / E-Futures.com
Wishing you all a great weekend. Amazing how fast short February went by and Monday will be the last trading day of the month.
I expect the higher volatility we have seen over the last few days to stay with us for a while….so as mentioned before be aware of it, adjust your trading parameters accordingly and stay disciplined!
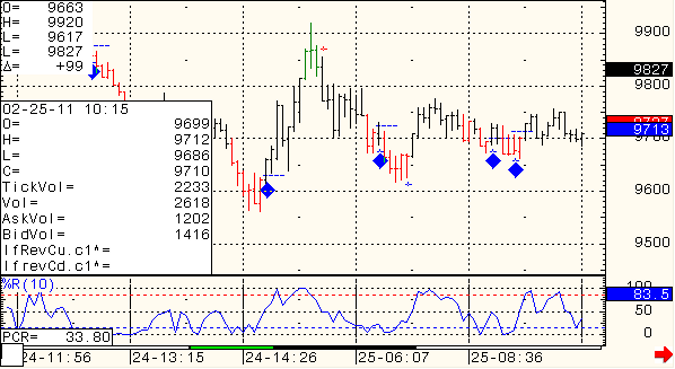
Below you will see a screen shot from the crude oil futures chart I share intraday. We also execute this crude day-trading system in-house as an “auto traded ” trading system with letter of direction.
The day-trading system is up slightly more than $1,000 NET per contract traded since we launched live trading on Jan. 28th 2011.*
*These are risky markets and only risk capital should be used.
Past performances are not necessarily indicative of future results.
If you are interested in more information, would like to see detailed LIVE results, please send me an email or speak with your broker.
Daily E-Mini S&P 500 Futures Trading Chart

GOOD TRADING!
TRADING LEVELS!

Economics Report Source: http://www.forexfactory.com/calendar.php
Monday, February 28, 2011
Core PCE Price Index m/m
8:30am USD
Personal Spending m/m
8:30am USD
FOMC Member Dudley Speaks
8:30am USD
Personal Income m/m
8:30am USD
Chicago PMI
9:45am
Pending Home Sales m/m
10:00am USD
This is not a solicitation of any order to buy or sell, but a current market view provided by Cannon Trading Company, Inc. Any statement of facts herein contained are derived from sources believed to be reliable, but are not guaranteed as to accuracy, nor they purport to be complete. No responsibility is assumed with respect to any such statement or with respect to any expression of opinion herein contained. Readers are urged to exercise their own judgment in trading!