Jump to a section in this post:
1. Market Commentary
2. Support and Resistance Levels – S&P, Nasdaq, Dow Jones, Russell 2000, Dollar Index
3. Support and Resistance Levels – Gold, Euro, Crude Oil, T-Bonds
4. Support and Resistance Levels – Corn, Wheat, Beans, Silver
5. Economic Reports for Tuesday May 23, 2012
Hello Traders,
Good ranges on many markets I follow intra day, which most day-traders look for.
As I said many times before , volatility and wide ranges can be a double edge sword….
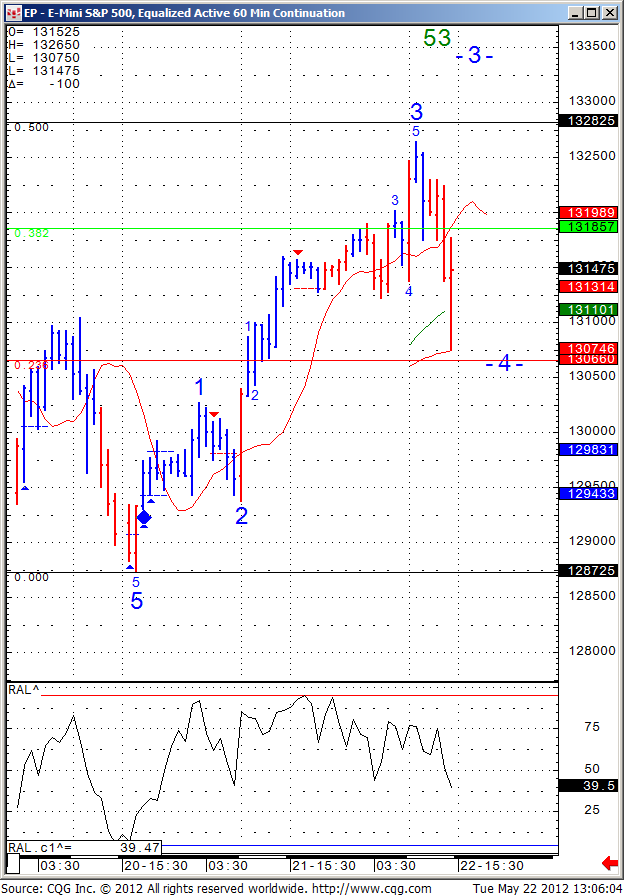
Below you will see an hourly chart of the mini SP 500 along with some potential Elliott Wave targets for either pull backs or continued bounce.
Trade with patience, trade with discipline and good trading to all.
Hourly chart of Mini S&P 500 below for your review:

GOOD TRADING!
Trading Futures, Options on Futures, and retail off-exchange foreign currency transactions involves substantial risk of loss and is not suitable for all investors. You should carefully consider whether trading is suitable for you in light of your circumstances, knowledge, and financial resources. You may lose all or more of your initial investment. Opinions, market data, and recommendations are subject to change at any time.
2. Support and Resistance Levels – S&P, Nasdaq, Dow Jones, Russell 2000, Dollar Index
| Contract June 2012 | SP500 (big & Mini) | Nasdaq100 (big & Mini) | Dow Jones (big & Mini) | Mini Russell | Dollar Index |
| Resistance 3 | 1343.77 | 2599.67 | 12663 | 783.07 | 83.00 |
| Resistance 2 | 1335.13 | 2580.33 | 12607 | 776.23 | 82.47 |
| Resistance 1 | 1325.07 | 2559.67 | 12543 | 767.47 | 82.15 |
| Pivot | 1316.43 | 2540.33 | 12487 | 760.63 | 81.62 |
| Support 1 | 1306.37 | 2519.67 | 12423 | 751.87 | 81.31 |
| Support 2 | 1297.73 | 2500.33 | 12367 | 745.03 | 80.78 |
| Support 3 | 1287.67 | 2479.67 | 12303 | 736.27 | 80.46 |
3. Support & Resistance Levels for Gold, Euro, Crude Oil, and U.S. T-Bonds
| Contract | June Gold | June Euro | July Crude Oil | June Bonds | |
| Resistance 3 | 1620.6 | 1.2942 | 94.89 | 147 23/32 | |
| Resistance 2 | 1607.5 | 1.2880 | 94.09 | 147 13/32 | |
| Resistance 1 | 1587.2 | 1.2782 | 92.79 | 147 9/32 | |
| Pivot | 1574.1 | 1.2720 | 91.99 | 146 31/32 | |
| Support 1 | 1553.8 | 1.2622 | 90.69 | 146 27/32 | |
| Support 2 | 1540.7 | 1.2560 | 89.89 | 146 17/32 | |
| Support 3 | 1520.4 | 1.2462 | 88.59 | 146 13/32 |
4. Support & Resistance Levels for Corn, Wheat, Beans and Silver
| Contract | July Corn | July Wheat | July Beans | July Silver | |
| Resistance 3 | 651.3 | 711.0 | 1448.00 | 2947.5 | |
| Resistance 2 | 640.2 | 705.5 | 1432.75 | 2912.5 | |
| Resistance 1 | 618.6 | 695.5 | 1407.50 | 2862.5 | |
| Pivot | 607.4 | 690.0 | 1392.25 | 2827.5 | |
| Support 1 | 585.8 | 680.0 | 1367.0 | 2777.5 | |
| Support 2 | 574.7 | 674.5 | 1351.75 | 2742.5 | |
| Support 3 | 553.1 | 664.5 | 1326.50 | 2692.5 |
This is not a solicitation of any order to buy or sell, but a current market view provided by Cannon Trading Inc. Any statement of facts herein contained are derived from sources believed to be reliable, but are not guaranteed as to accuracy, nor they purport to be complete. No responsibility is assumed with respect to any such statement or with respect to any expression of opinion herein contained. Readers are urged to exercise their own judgment in trading!
5. Economic Reports
source:http://www.forexfactory.com/calendar.php All times are Eastern time Zone (EST)
 4:00am