In this post:
1. Market Commentary
2. Support and Resistance Levels
3. Daily Mini Mini S&P 500 Futures Chart

1. Market Commentary
Volatility remains high and what I wrote the last few days, still holds:
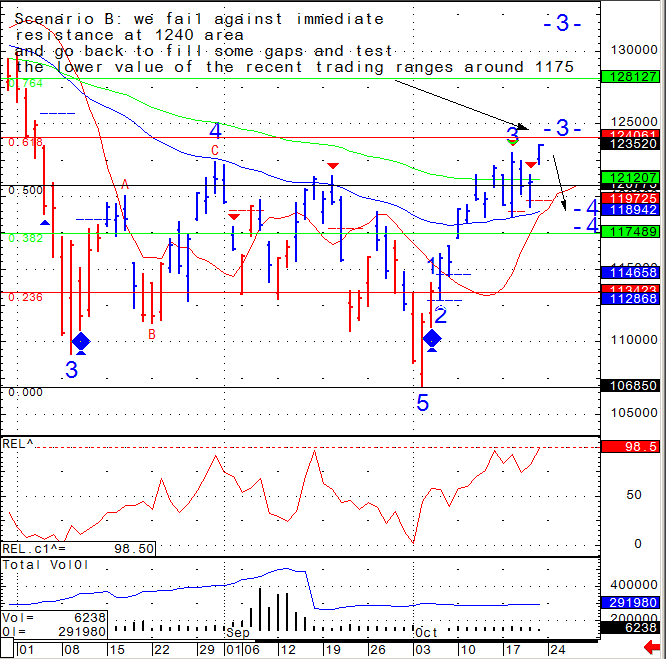
As far as the daily chart, I am now confused again….Once again there is a CASE for both sides, bulls and the bears and the potential for a BIG MOVE EITHER WAY is greater than normal as we are sitting on important price levels in the SP500, which has been the leader for the rest of the markets as of the last few weeks.
With the close today I am now leaning towards the long side…..BUT still not excited about the risk / reward scenario.
GOOD TRADING!

2. Support and Resistance Levels
| Contract (Dec. 2011) | SP500 (big & Mini) | Nasdaq100 (big & Mini) | Dow Jones (big & Mini) | Mini Russell |
| Resistance 3 | 1253.60 | 2406.50 | 12166 | 737.23 |
| Resistance 2 | 1244.55 | 2376.00 | 11964 | 724.27 |
| Resistance 1 | 1239.90 | 2357.00 | 11860 | 717.43 |
| Pivot | 1230.85 | 2326.50 | 11658 | 704.47 |
| Support 1 | 1226.20 | 2307.50 | 11554 | 697.63 |
| Support 2 | 1217.15 | 2277.00 | 11352 | 684.67 |
| Support 3 | 1212.50 | 2258.00 | 11248 | 677.83 |
| Contract | Dec. Gold | Dec. Euro | Nov. Crude Oil | Dec. Bonds |
| Resistance 3 | 1664.7 | 1.4156 | 92.01 | 139 21/32 |
| Resistance 2 | 1657.2 | 1.4027 | 90.45 | 139 9/32 |
| Resistance 1 | 1649.3 | 1.3956 | 89.07 | 138 24/32 |
| Pivot | 1641.8 | 1.3827 | 87.51 | 138 12/32 |
| Support 1 | 1633.9 | 1.3756 | 86.13 | 137 27/32 |
| Support 2 | 1626.4 | 1.3627 | 84.57 | 137 15/32 |
| Support 3 | 1618.5 | 1.3556 | 83.19 | 136 30/32 |

3. Daily Mini Mini S&P 500 Futures Chart
Daily chart with two possible scenarios for your review below:

