Jump to a section in this post:
1. Market Commentary
2. Support and Resistance Levels – S&P, Nasdaq, Dow Jones, Russell 2000
3. Support and Resistance Levels – Gold, Euro, Crude Oil, T-Bonds
4. Support and Resistance Levels – March Corn, March Wheat, Jan Beans, March Silver
5. Economic Reports for Wednesday, January 11, 2012

1. Market Commentary
So after periods of high volatility towards the end of last year, the last few weeks we saw very tight and narrow ranges.
I am still hoping that this is due to the holidays and end of the year trading and not a market environment that is here to stay with us…..
Last few days ranges on the mini SP have been quite narrow in comparison to November and October of 2011.
Every trader is different and some prefer the “quieter, slower” trading environment, while others prefer “instant gratification or punishment” = volatility.
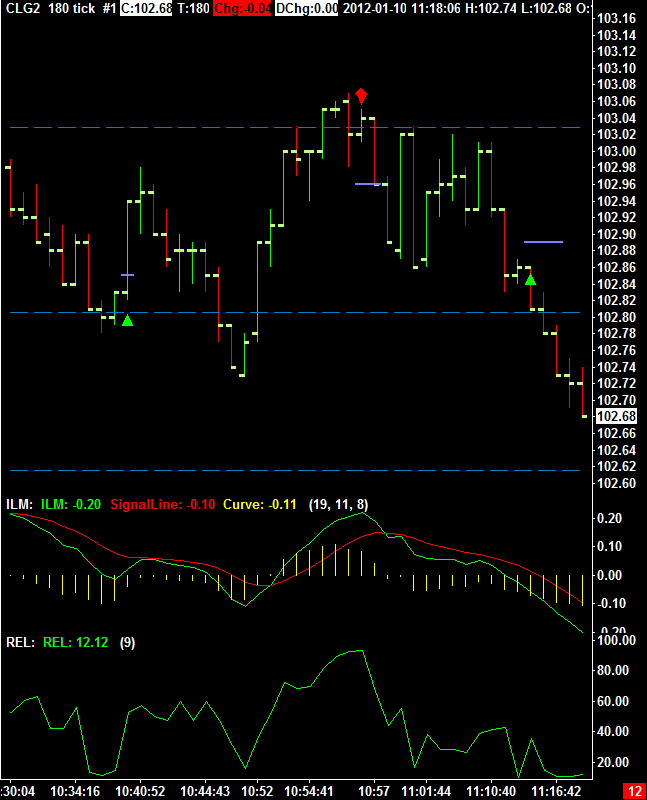
The crude oil market definitely falls into the second category and below is an intraday chart from part of this morning trading.
I am using 180 tick chart and you can see that in approximately 18 minutes time frame the crude market had a range of about 60 cents which equals to $600 per one contract, against you or in your favor….but the point is, this market has higher volatility and ranges.

Would you like to have access to my DIAMOND ALGO as shown above
and be able to apply for any market and any time frame on your own PC ? You can now have a two weeks free trial where I enable the ALGO along with few studies for your own sierra/ ATcharts.
If so, please send me an email with the following information:
1. Are you currently trading futures?
2. Charting software you use?
3. If you use sierra or ATcharts, please let me know the user name so I can enable you
4. Markets you currently trading?
2. Support and Resistance Levels – S&P, Nasdaq, Dow Jones, Russell 2000
| Contract (Dec. 2011) | SP500 (big & Mini) |
Nasdaq100 (big & Mini) |
Dow Jones (big & Mini) |
Mini Russell |
| Resistance Level 3 | 1297.40 | 2400.33 | 12507 | 778.53 |
| Resistance Level 2 | 1294.60 | 2389.67 | 12481 | 771.17 |
| Resistance Level 1 | 1290.80 | 2376.33 | 12442 | 766.63 |
| Pivot Point | 1288.00 | 2365.67 | 12416 | 759.27 |
| Support Level 1 | 1284.20 | 2352.33 | 12377 | 754.73 |
| Support Level 2 | 1281.40 | 2341.67 | 12351 | 747.37 |
| Support Level 3 | 1277.60 | 2328.33 | 12312 | 742.83 |
3. Support & Resistance Levels for Gold, Euro, Crude Oil, and U.S. T-Bonds
| Contract | Feb. Gold | Dec. Euro | Jan. Crude Oil | March. Bonds |
| Resistance Level 3 | 1649.9 | 1.2897 | 105.40 | 144 15/32 |
| Resistance Level 2 | 1645.7 | 1.2860 | 104.41 | 143 26/32 |
| Resistance Level 1 | 1639.1 | 1.2820 | 103.29 | 143 10/32 |
| Pivot Point | 1634.9 | 1.2783 | 102.30 | 142 21/32 |
| Support Level 1 | 1628.3 | 1.2743 | 101.18 | 142 5/32 |
| Support Level 2 | 1624.1 | 1.2706 | 100.19 | 141 16/32 |
| Support Level 3 | 1617.5 | 1.2666 | 99.07 | 141 |
4. Support & Resistance Levels for Corn, Wheat, Beans and Silver
| Contract | March Corn | March Wheat | Jan. Beans | March. Silver |
| Resistance 3 | 663.2 | 645.8 | 1248.33 | 3189.0 |
| Resistance 2 | 659.3 | 642.9 | 1240.67 | 3110.0 |
| Resistance 1 | 655.7 | 641.3 | 1236.33 | 3048.5 |
| Pivot | 651.8 | 638.4 | 1228.67 | 2969.5 |
| Support 1 | 648.2 | 636.8 | 1224.3 | 2908.0 |
| Support 2 | 644.3 | 633.9 | 1216.67 | 2829.0 |
| Support 3 | 640.7 | 632.3 | 1212.33 | 2767.5 |
5. Economic Reports
FOMC Member Lockhart Speaks
9:00am
Crude Oil Inventories
10:30am
Beige Book
2:00pm