In this post:
1. Market Commentary
2. Support and Resistance Levels
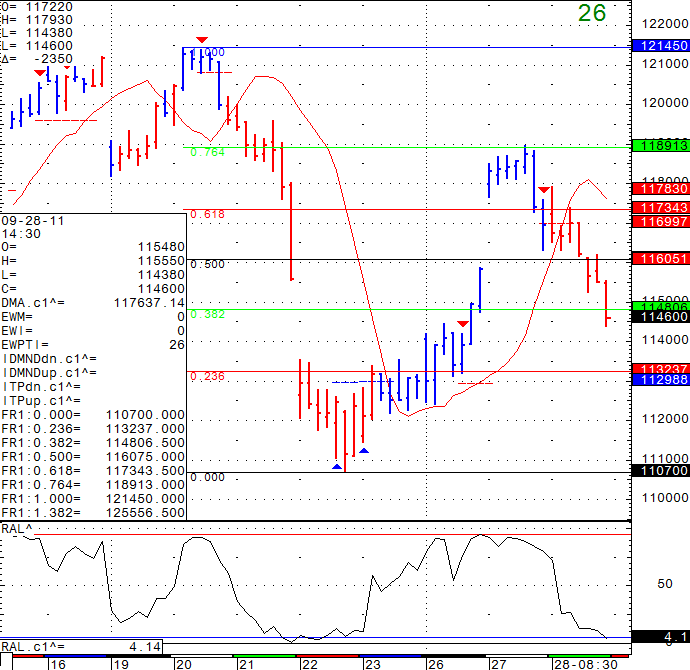
3. Daily S&P 500 Futures Chart
4. Economic Reports

1. Market Commentary
I am back talking about the gaps and the PIT session SP500 as I have been for the last few days.
We closed the gap at 1159 going down today and a look at hourly chart suggest that the short term gaps are all filled. Bit oversold on the downside but overall my indicators suggest short to medium term further downside pressure – however the market will need to take out 1070 before we can see another leg down, until then we should see volatility both ways.
GOOD TRADING!

2. SUPPORT AND RESISTANCE LEVELS!
| Contract (Dec. 2011) | SP500 (big & Mini) | Nasdaq100 (big & Mini) | Dow Jones (big & Mini) | Mini Russell |
| Resistance 3 | 1203.77 | 2319.75 | 11468 | 711.07 |
| Resistance 2 | 1191.53 | 2297.75 | 11355 | 698.23 |
| Resistance 1 | 1168.27 | 2256.00 | 11145 | 674.37 |
| Pivot | 1156.03 | 2234.00 | 11032 | 661.53 |
| Support 1 | 1132.77 | 2192.25 | 10822 | 637.67 |
| Support 2 | 1120.53 | 2170.25 | 10709 | 624.83 |
| Support 3 | 1097.27 | 2128.50 | 10499 | 600.97 |
| Contract | Dec. Gold | Dec. Euro | Nov. Crude Oil | Dec. Bonds |
| Resistance 3 | 1684.0 | 1.3800 | 87.47 | 143 21/32 |
| Resistance 2 | 1671.5 | 1.3742 | 86.05 | 142 20/32 |
| Resistance 1 | 1639.1 | 1.3641 | 83.39 | 141 28/32 |
| Pivot | 1626.6 | 1.3583 | 81.97 | 140 27/32 |
| Support 1 | 1594.2 | 1.3482 | 79.31 | 140 3/32 |
| Support 2 | 1581.7 | 1.3424 | 77.89 | 139 2/32 |
| Support 3 | 1549.3 | 1.3323 | 75.23 | 138 10/32 |

3. Hourly S&P 500 Pit Session Chart from September 28, 2011

Would you like to have access to my DIAMOND ALGO as shown above and be able to apply for any market and any time frame?
If so, please send me an email with the following information:
- Are you currently trading futures?
- Charting software you use?
- If you use sierra or ATcharts, please let me know the user name so I can enable you.
- Markets you currently trade.
4. Economic Reports for Thursday September 29, 2011
Unemployment Claims
8:30am
Final GDP q/q
8:30am
Final GDP Price Index q/q
8:30am
Pending Home Sales m/m
10:00am
Natural Gas Storage
10:30am
Economics Report Source: http://www.forexfactory.com/calendar.php
