Cannon Trading / E-Futures.com
Wishing all of you a great trading month in March!
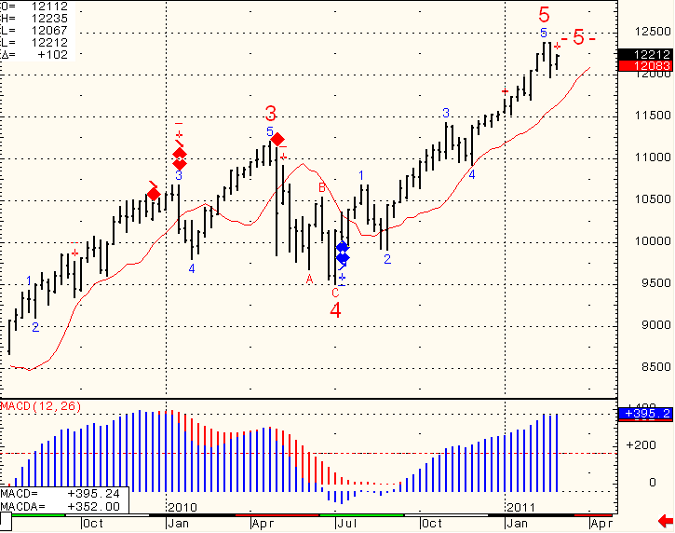
Weekly chart of mini Dow Jones futures for your review below. While most of you are shorter term traders, even considered futures day-traders, it is wise to know what the longer time frame charts are showing as well.
In the case of the weekly chart below, we will need to see a break below 119.50 in order to get a weekly sell signal according to my technical opinion.
Daily E-Mini S&P 500 Futures Trading Chart

GOOD TRADING!
TRADING LEVELS!

Economics Report Source: http://www.forexfactory.com/calendar.php
Tuesday, February 29, 2011
Fed Chairman Bernanke Testifies
10:00am USD
ISM Manufacturing PMI
10:00am USD
Construction Spending m/m
10:00am USD
ISM Manufacturing Prices
10:00am USD
Total Vehicle Sales
All Day USD
This is not a solicitation of any order to buy or sell, but a current market view provided by Cannon Trading Company, Inc. Any statement of facts herein contained are derived from sources believed to be reliable, but are not guaranteed as to accuracy, nor they purport to be complete. No responsibility is assumed with respect to any such statement or with respect to any expression of opinion herein contained. Readers are urged to exercise their own judgment in trading!