____________________________________________________________________
Voted #1 Blog and #1 Brokerage Services on TraderPlanet for 2016!!
____________________________________________________________________
Dear Traders,
A picture is worth a thousand words….
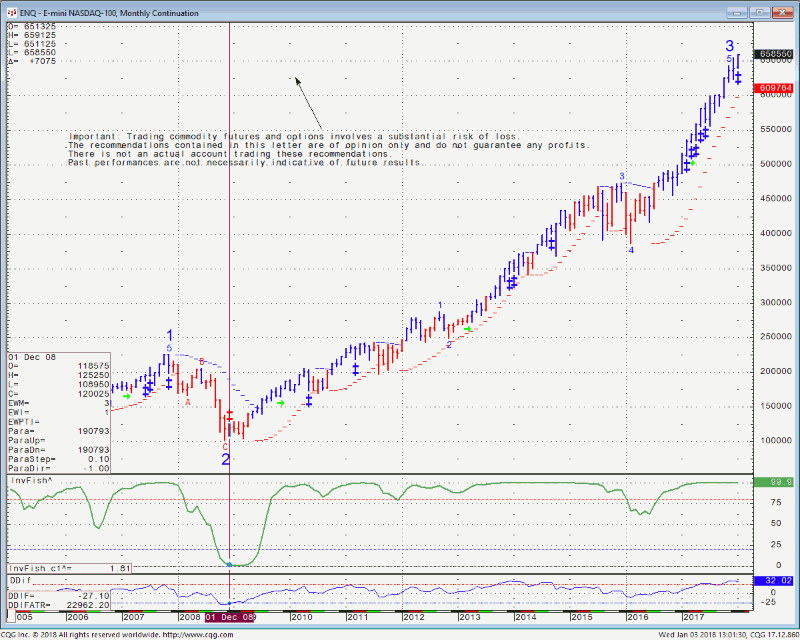
A look at the monthly mini NASDAQ 100 chart below illustrates the amazing rally we had since 2008.
The last technical sell signal on the monthly chart was late 2008…since then, you can see more than a few buy signals on this rally ( blue plus signs and green arrows), which in my opinion, was initiated and fueled by the Fed. to a large extent.
mini NASDAQ monthly chart:

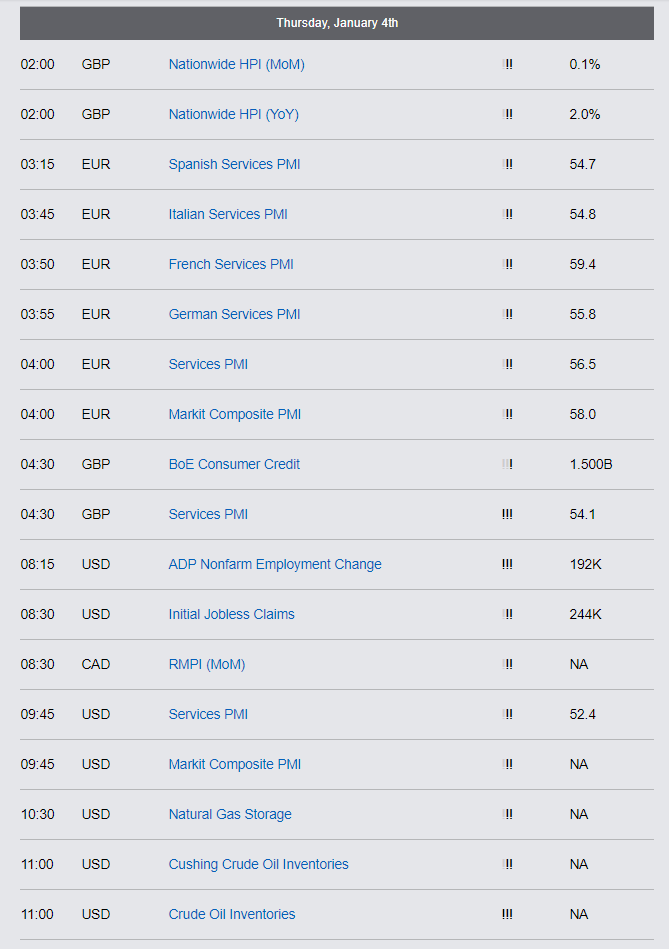
On a different note, remember that crude oil inventories will be out tomorrow at 10 AM Central time, due to the long weekend we just had.
Natural gas numbers will be out as normal at 9:30 Am Central.
Please keep in mind that our brokers here at Cannon are available to chat about the markets, trading techniques, mental aspects of trading and much more. Feel free to pick up the phone and call us at 310 859 9572 any time.
Good Trading!
Trading Futures, Options on Futures, and retail off-exchange foreign currency transactions involves substantial risk of loss and is not suitable for all investors. You should carefully consider whether trading is suitable for you in light of your circumstances, knowledge, and financial resources. You may lose all or more of your initial investment. Opinions, market data, and recommendations are subject to change at any time.
Futures Trading Levels
1-04-2018
| Contract March 2018 | SP500 | Nasdaq100 | Dow Jones | Mini Russell | BitCoin Index |
| Resistance 3 | 2742.08 | 6694.25 | 25083 | 1569.10 | 16163.66 |
| Resistance 2 | 2728.17 | 6642.75 | 24996 | 1563.40 | 15783.62 |
| Resistance 1 | 2720.08 | 6614.25 | 24943 | 1559.30 | 15377.58 |
| Pivot | 2706.17 | 6562.75 | 24856 | 1553.60 | 14997.54 |
| Support 1 | 2698.08 | 6534.25 | 24803 | 1549.50 | 14591.50 |
| Support 2 | 2684.17 | 6482.75 | 24716 | 1543.80 | 14211.46 |
| Support 3 | 2676.08 | 6454.25 | 24663 | 1539.70 | 13805.42 |
| Contract | Feb. Gold | Mar. Silver | Feb. Crude Oil | Mar. Bonds | Mar. Euro |
| Resistance 3 | 1337.6 | 17.52 | 63.82 | 153 6/32 | 1.2170 |
| Resistance 2 | 1330.3 | 17.40 | 62.82 | 152 25/32 | 1.2144 |
| Resistance 1 | 1323.5 | 17.30 | 62.29 | 152 17/32 | 1.2105 |
| Pivot | 1316.2 | 17.18 | 61.29 | 152 4/32 | 1.2079 |
| Support 1 | 1309.4 | 17.08 | 60.76 | 151 28/32 | 1.2040 |
| Support 2 | 1302.1 | 16.96 | 59.76 | 151 15/32 | 1.2014 |
| Support 3 | 1295.3 | 16.86 | 59.23 | 151 7/32 | 1.1975 |
| Contract | Mar. Corn | Mar. Wheat | March Beans | Mar. SoyMeal | Feb. Nat Gas |
| Resistance 3 | 356.5 | 443.0 | 975.42 | 321.57 | 3.14 |
| Resistance 2 | 355.5 | 440.0 | 972.58 | 320.33 | 3.10 |
| Resistance 1 | 354.3 | 438.0 | 970.67 | 319.47 | 3.05 |
| Pivot | 353.3 | 435.0 | 967.83 | 318.23 | 3.00 |
| Support 1 | 352.0 | 433.0 | 965.9 | 317.4 | 3.0 |
| Support 2 | 351.0 | 430.0 | 963.08 | 316.13 | 2.91 |
| Support 3 | 349.8 | 428.0 | 961.17 | 315.27 | 2.85 |
Economic Reports, source:

This is not a solicitation of any order to buy or sell, but a current market view provided by Cannon Trading Inc. Any statement of facts here in contained are derived from sources believed to be reliable, but are not guaranteed as to accuracy, nor they purport to be complete. No responsibility is assumed with respect to any such statement or with respect to any expression of opinion herein contained. Readers are urged to exercise their own judgement in trading.