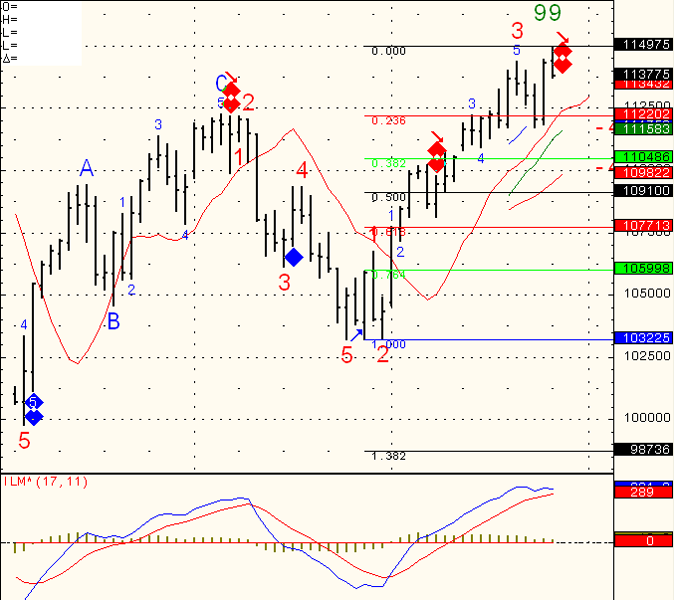
Daily chart of Mini SP below. As I mentioned last week, I got a couple of potential “sell signals” and the market only gave us a small decline if that. What is being referred to as “divergence”. Well…I got one more potential for market retracement.
This time the SP will have to drop below 1123 in order for me to enter a short swing position. I call it price conformation. Meaning I would like to see price action confirming my technical speculation. FIB levels on the chart will be used to determine potential targets, stops etc.

GOOD TRADING!
FUTURES TRADING LEVELS

This Week’s Calendar from Econoday.Com
All reports are EST time
Another great source for economic reports around the globe with “report importance indicator” at: http://www.forexfactory.com/calendar.php
Tuesday, September 28th 2010 – http://mam.econoday.com/byweek.asp?cust=mam
- ICSC-Goldman Store Sales
7:45 AM ET - Redbook
8:55 AM ET - S&P Case-Shiller HPI
9:00 AM ET - Consumer Confidence
10:00 AM ET - State Street Investor Confidence Index
10:00 AM ET - 4-Week Bill Auction
11:30 AM ET - 5-Yr Note Auction
1:00 PM ET
Disclaimer:
Trading commodity futures and options involves substantial risk of loss. The recommendations contained in this letter is of opinion only and does not guarantee any profits. These are risky markets and only risk capital should be used. Past performances are not necessarily indicative of future results. This is not a solicitation of any order to buy or sell, but a current futures market view provided by Cannon Trading Inc. Any statement of facts herein contained are derived from sources believed to be reliable, but are not guaranteed as to accuracy, nor they purport to be complete. No responsibility is assumed with respect to any such statement or with respect to any expression of opinion herein contained. Readers are urged to exercise their own judgment in trading!