Tuesday Morning Support and Resistance Numbers

If you would like these numbers before the market opens, make sure you SIGN UP with your email above.

Here’s a morning cup o’ joe for all you futures traders, our morning support and resistance levels. Good trading!

divider black 190

Support and Resistance Levels – S&P 500, Nasdaq 100, Dow Jones, Mini Russell 2000, 30-Year US Bond, 10-Year US Note

Contract (June) Mini S&P 500 Mini Nasdaq 100 Dow Jones Mini Russell 2000 30-Year US Bond 10-Year US Note
Resistance Level 3 ——————————————Resistance Level 2

——————————————

Resistance Level 1

——————————————

Support Level 1

——————————————

Support Level 2

——————————————

Support Level 3

1362.751352


1346.75


1333.75


1329.25


1315.75

26472624


2607


2581


2575


2543

1283012791


12730


12630


12511


12476

794.9786.9


782


774.1


772.2


756

14700 (all time high)14626 

14620


14508


14416


14328

13331.513324.5


13319.5 (all time high)

13229


13225


13217.5

Continue reading “Tuesday Morning Support and Resistance Numbers”

Cannon Trading New Website! | Support and Resistance Levels

Jump to a section in this post:
1. Market Commentary
2. Support and Resistance Levels – S&P, Nasdaq, Dow Jones, Russell 2000
3. Support and Resistance Levels – Gold, Euro, Crude Oil, T-Bonds
4. Support and Resistance Levels – Corn, Wheat, Beans, Silver
5. Economic Reports for Tuesday May 15, 2012


Hello Traders,

Cannon Trading Co, Inc. NEW WEBSITE TO LAUNCH TONIGHT!

Same great information, more tools and much better presentation and ease of navigation!


I wrote Friday after the close: 

“I thought we finished the week on a somewhat bearish note….

The market tried to penetrate higher the last 3 sessions and failed each time.

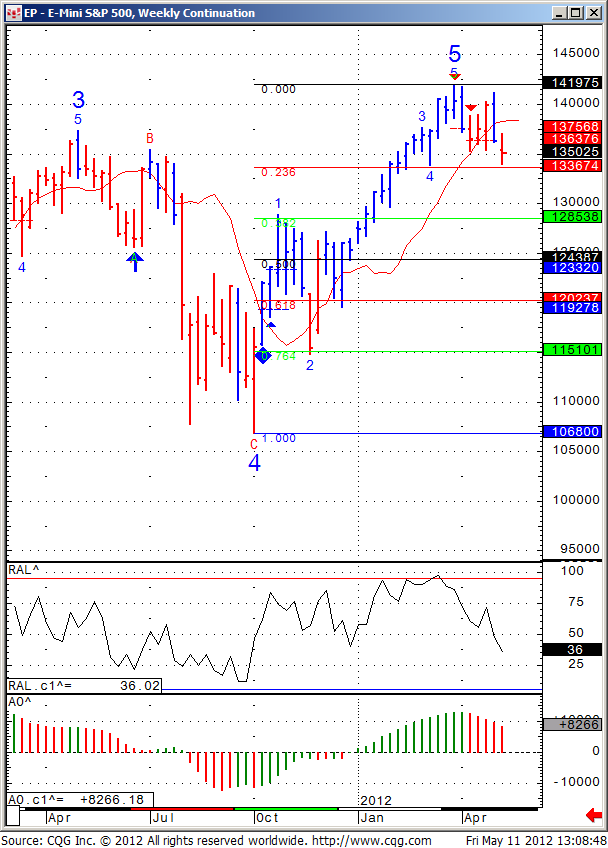
Also I got a sell signal on the weekly chart which I am attaching below for your review.

I think what type of price action we will see ( if ) when we trade at  1336- 1339 area, may give us further clues about this market. “

Well we tested this area today and did not get much of a bounce and actually closed right at 1336.

To me this shift the medium – longer term stance into bearish but as I said in the past, each day is different and one can not tell what the next day will bring…..

On a different note ( market) , weekly chart of the gold market for your review below with some key areas to watch.

Continue reading “Cannon Trading New Website! | Support and Resistance Levels”

Bearish Note for the Week End | Support and Resistance Levels

Jump to a section in this post:
1. Market Commentary
2. Support and Resistance Levels – S&P, Nasdaq, Dow Jones, Russell 2000
3. Support and Resistance Levels – Gold, Euro, Crude Oil, T-Bonds
4. Support and Resistance Levels – Corn, Wheat, Beans, Silver
5. Economic Reports for Monday May 14, 2012


Hello Traders,

I thought we finished the week on a somewhat bearish note….

The market tried to penetrate higher the last 3 sessions and failed each time.

Also I got a sell signal on the weekly chart which I am attaching below for your review.

I think what type of price action we will see ( if ) when we trade at 1336- 1339 area, may give us further clues about this market.

568


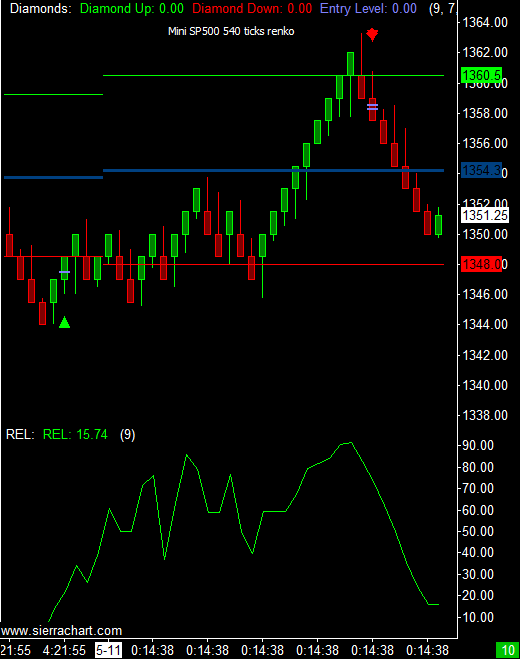
On a different note, below you will see a screen shot from today’s live trading signals I share with clients and prospects. This one is of the Mini SP 500 from May 11th 2012. We had one long signal during the early AM session before I start the service and one short signal midday, which turned out to be a good one. Of course, not all signals are as good…but if you like to come and try the service on free trial basis, please visit:

https://www.cannontrading.com/education-day-trading-webinar

1336766377919


Would you like to have access to my DIAMOND and TOPAZ ALGOs as shown above and be able to apply for any market and any time frame on your own PC ? You can now have a two weeks free trial where I enable the ALGO along with few studies for your own sierra/ ATcharts.

If so, please send me an email with the following information:

1. Are you currently trading futures?

2. Charting software you use?

3. If you use sierra or ATcharts, please let me know the user name so I can enable you

4. Markets you currently trading?

Continue reading “Bearish Note for the Week End | Support and Resistance Levels”

Friday Morning Support and Resistance Numbers

If you would like these numbers before the market opens, make sure you SIGN UP with your email above.

Here’s a morning cup o’ joe for all you futures traders, our morning support and resistance levels. Good trading!

divider black 190

Support and Resistance Levels – S&P 500, Nasdaq 100, Dow Jones, Mini Russell 2000, 30-Year US Bond, 10-Year US Note

Contract (June) Mini S&P 500 Mini Nasdaq 100 Dow Jones Mini Russell 2000 30-Year US Bond 10-Year US Note
Resistance Level 3 ——————————————Resistance Level 2

——————————————

Resistance Level 1

——————————————

Support Level 1

——————————————

Support Level 2

——————————————

Support Level 3

1363.751356.25


1351.5


1339.25


1336


1348.25

26372622


2613


2603


2583


2575

1289212828


12788


12824


12802


12763

794.50789.80


786.8


780.9


778.6


772.8

1461114515


14508


14416


14405


14321

13315.513308.5 (all time high)

13304.5


13229


13225


13217.5

Continue reading “Friday Morning Support and Resistance Numbers”

STOPS: Why Don’t We Keep Them | Support and Resistance Levels

Jump to a section in this post:
1. Market Commentary
2. Support and Resistance Levels – S&P, Nasdaq, Dow Jones, Russell 2000
3. Support and Resistance Levels – Gold, Euro, Crude Oil, T-Bonds
4. Support and Resistance Levels – Corn, Wheat, Beans, Silver
5. Economic Reports for Thursday May 10, 2012


Hello Traders,

We published this article a good few months back BUT I think this subject is worth revisiting almost on a weekly basis…STOPS.

STOPS: Why Don’t We Keep Them

by RealityTrader on Jan 19, 2011

With everything said and written on the subject of stops, it should be a given that everyone is conditioned to keep them religiously even before they start trading. No matter what source a newer trader turns to, utter importance of stops will be underlined and emphasized up to the degree that keeping them heralded as the ultimate key to success. We all heard adages like “Take care of your losses, profits will take care of themselves.”

Do all the stern warnings work? Not really.

Time and again traders blow their stops, widen them in the course of a trade, hold losing position in the false hope for recovery. If this destructive behavior continues despite all the warnings, there must be deeply rooted reasons for this. As with most trading flaws, failure to keep stops roots in fundamental misconceptions about the very nature of the market and trading. Such misconceptions result in incorrect psychological makeup which, in turn, creates behavioral patterns harmful for a trader’s performance. In order to re-condition oneself it is necessary to work out fundamental, even philosophical if you will, understanding of the market as an environment in which a trader operates.

Let us list and analyze the misconceptions that cause failure to keep stops.

Right action must result in profit.
This misconception stems from misunderstanding of the very nature of the market as an uncertain environment. Newer trader sees a market as a conglomerate of firm links between reasons and outcomes. In such a conglomerate, every reason results in single possible outcome. The simplest case of such link would be “good news – up, bad news – down”. We know it’s not true – price reacts to news in a wide variety of ways.

Similarly, an inexperienced trader applying the setup he knows “should work” expects every trade to be a winner, providing that all the components of the setup are right. Have you ever heard complaints like “Everything was exactly like in that book, yet the trade failed”? That is direct result of this misunderstanding. Everything may be right, yet the trade fails – just because markets work in probabilities and not in certainties.

If a system produces certain percentage of wins over time, it’s just statistics – and, as it is always the case with statistics, it cannot predict an outcome of a particular trade. No matter how good the setup is, any given trade can fail. That’s why it’s imperative for a trader to distinguish between two kinds of losses.

The first kind is a loss caused by a trader’s mistake – failure to follow all the rules of system applied, or impulsive entry without any reason at all. Such losses must be taken as a lesson. The second kind is the case where every piece of puzzle was in place, yet the trade failed – such losses must be written off as a part of trading game, as a tribute to uncertainty of the markets.

Of course, if you identify a component of your trading system that regularly causes trade failure, you can and should tweak your system in order to minimize failures. However, during a trade a stop must be taken as soon as signal of failure appears. The line of thinking “The setup was so good, it must work eventually” is a disaster waiting to happen.
Failure to perceive the market as an uncertain environment can result in another misconception:
Losses can be eliminated.
In a paradoxical way, this erroneous notion leads to more losses. A trader tweaks his system endlessly trying to get rid of losses completely. In such constant adjusting and re-adjusting, the system evolves into something totally different, losing its original logic, or even ceases producing entry signals at all. As a result, a trader either abandons his system, which was not a bad one to begin with or, in a worst case, simply refuses to take losses. After all, he made his system so perfect by eliminating all the reasons for failures, it just MUST work! Meanwhile, had he stayed with original approach, maybe with some minor tweaks, it would continue producing steady results.

My trade is who I am.
This is one of those hidden subconscious misconceptions that cause us to refuse to take our stop. A trader perceives the result of his trade as a reflection of his personality, his abilities. A trade failure makes him feel as though he is a failure. Winning makes him feel “right”, while losing makes him feel being “wrong.” Nobody likes to be a failure, to be wrong. That’s why, in order to avoid being wrong, we refuse to take our stop. Remember that you can be right and still lose on this particular trade. You can be wrong and win, too.

It’s important to differ between good and bad trade, and we will be back to this later, in the Random reinforcement part. At this point it’s important to separate your self-perception from the result of your trade. Taking a stop loss, you are stopping your loss from growing – there is nothing foolish about that. The major trigger for the right approach here is a realization that by accepting the market as an uncertain environment, we automatically accept the possibility of losses. If we don’t expect the market to work in our favor every time, there is no reason to feel foolish when it doesn’t.

A loss is just a paper loss until it’s taken.
This is a big mistake in thinking. If a loss gets out of hand, it’s very real. It paralyzes you, it clouds your judgment, and it makes you miss other opportunities. Instead of taking a pre-determined loss and moving on to another trade, you sit and watch your losing one, twitching in pain and feeling remorse. Your chance to take a small stop is long gone. You are agonizing now over big one that is going to deplete your account too much and inflict serious emotional wounds. You hardly notice any other opportunities. The market has moved on, other sectors and stocks are in play, and you still nurture your losing trade, hating it and not being able to finally drop it. At some point you will ask yourself “Why was this trade so important to me? What made me hold onto it?” And this takes us to the next common error:

Putting too much importance into single trade.

A newer trader tends to see each trade as overly important, as if it’s going to make or break him. The market is an endless stream of opportunities. The next trade is right around the corner. No single trade is so important that it would be worth abandoning all other opportunities. Perceive your trading as a process, not as separate events. With the correct approach trading becomes natural, like breathing. Each entry is inhale, each exit is exhale. Breathe in and breathe out. Don’t choke yourself trying to hold onto each given breath.

Random reinforcement.
This is an important concept to understand. The market is not always rewarding right decisions and punishing bad ones. The practical implication is that a trader runs a risk to stop applying proper techniques if he sees wrong ones being rewarded sometimes. Take a stop, observe a stock reversing and going into profit zone – and you get tempted to skip your stop next time. If you try it and it works, there is significant chance that you continue doing just that – the bad habit gets reinforced. You may win several times by breaking your rules. What happens eventually is that one trade that does not reverse destroys your account. It’s important to define what good and bad trades are. Unlike many think, a good trade is not always a winning trade; a bad trade is not always a losing trade.

– A good trade is a trade where you kept all your rules that you know to be working in a long run. A good trade can be a winning one when the market acts accordingly to what your system indicates. It can be a losing trade when the market acts against it, but it’s still a good trade.

– A bad trade is a trade made against your better judgment, against your rules. It can be a losing trade when a market acts as it “should.” It can be a winning trade when the market rewards your bad judgment, and it can be a very dangerous trap as a bad habit gets reinforced.

The last thing to say in conclusion is that a certain psychological barrier for a trader to overcome to start applying his stops with no hesitation. When this barrier is overtaken, things suddenly become so clear and automatic that a trader can’t even believe it was ever a problem for him. When this barrier is overcome, you feel that stops became natural part of your trading, that you take them with no slightest hesitation and forget about them instantly, moving on to search for your next trade, that taking stops do not trigger any negative emotions. This is wonderful feeling of total self-control. Not only will it do plenty of good to your trading performance, it’s a very rewarding feeling in itself.

Continue reading “STOPS: Why Don’t We Keep Them | Support and Resistance Levels”

Thursday Morning Support and Resistance

If you would like these numbers before the market opens, make sure you SIGN UP with your email above.

Here’s a morning cup o’ joe for all you futures traders, our morning support and resistance levels. Good trading!

divider black 190

Support and Resistance Levels – S&P 500, Nasdaq 100, Dow Jones, Mini Russell 2000, 30-Year US Bond, 10-Year US Note

Contract (June) Mini S&P 500 Mini Nasdaq 100 Dow Jones Mini Russell 2000 30-Year US Bond 10-Year US Note
Resistance Level 3 ——————————————Resistance Level 2

——————————————

Resistance Level 1

——————————————

Support Level 1

——————————————

Support Level 2

——————————————

Support Level 3

13841375.5


1367.5


1357


1354


1348.25

26752663


2648


2622.5


2615.5


2609

1299212923


12846


12824


12802


12763

807.50800.90


794.3


788.6


785.9


780.9

1442214412


14406


14321


14306


14222

13308.5 (all time high)13300 

13228


13219


13211


13204.5

Continue reading “Thursday Morning Support and Resistance”

Mini Russell 2000, Mini SP 500, Crude Oil, Gold futures Chart | Support and Resistance

Jump to a section in this post:
1. Market Commentary
2. Support and Resistance Levels – S&P, Nasdaq, Dow Jones, Russell 2000
3. Support and Resistance Levels – Gold, Euro, Crude Oil, T-Bonds
4. Support and Resistance Levels – Corn, Wheat, Beans, Silver
5. Economic Reports for Wednesday May 9, 2012


Hello Traders,

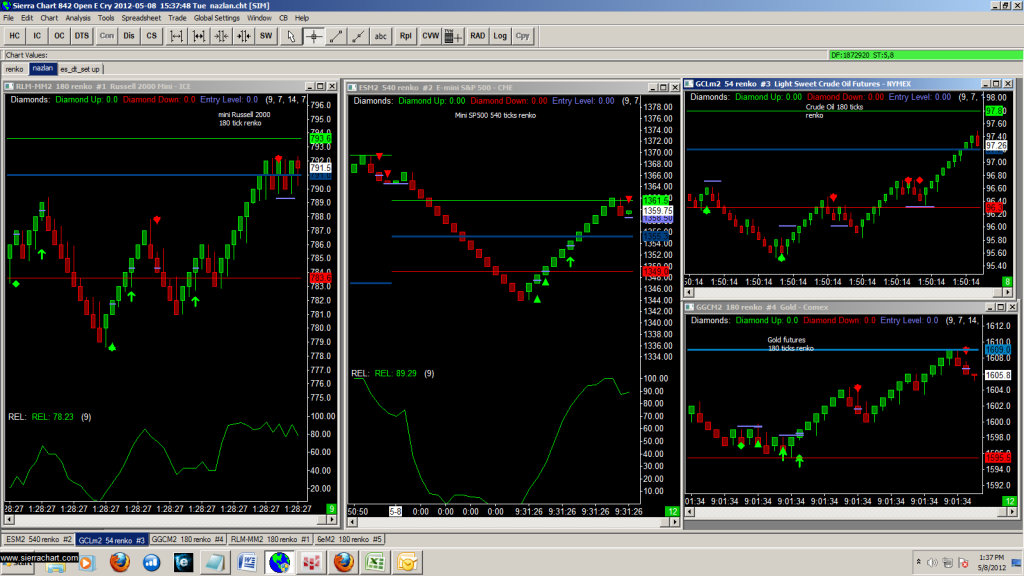
Below is a screen shot of my desktop charting from today, which I share with interested clients and prospects on a trial basis and subscription basis.

What you see below are my intra-day charts for the : ( from left to right)

Mini Russell 2000, Mini SP 500, Crude Oil ( top right), Gold futures, (bottom right)

If you have not had the trial before,


1336509475703

Continue reading “Mini Russell 2000, Mini SP 500, Crude Oil, Gold futures Chart | Support and Resistance”

Tuesday Morning Support and Resistance

If you would like these numbers before the market opens, make sure you SIGN UP with your email above.

Here’s a morning cup o’ joe for all you futures traders, our morning support and resistance levels. Good trading!

divider black 190

Support and Resistance Levels – S&P 500, Nasdaq 100, Dow Jones, Mini Russell 2000, 30-Year US Bond, 10-Year US Note

Contract (June) Mini S&P 500 Mini Nasdaq 100 Dow Jones Mini Russell 2000 30-Year US Bond 10-Year US Note
Resistance Level 3 ——————————————Resistance Level 2

——————————————

Resistance Level 1

——————————————

Support Level 1

——————————————

Support Level 2

——————————————

Support Level 3

1377.251369.5


1365


1356.5


1351.5


1335.75

26702650


2628


2615


2601


2586

1303112971


12905


12870


12835


12799

807.5800.90


795.2


786.6


781.4


772.8

1451514430


14419


14323


14308


14227

13223.513302 (all time high)

13230.5


13219


13211


13204.5

Continue reading “Tuesday Morning Support and Resistance”

Big Moves Down on the Open of Sunday Night Session

Jump to a section in this post:
1. Market Commentary
2. Support and Resistance Levels – S&P, Nasdaq, Dow Jones, Russell 2000
3. Support and Resistance Levels – Gold, Euro, Crude Oil, T-Bonds
4. Support and Resistance Levels – Corn, Wheat, Beans, Silver
5. Economic Reports for Tuesday May 8, 2012


Hello Traders,

Big moves down on the open of Sunday night session, corrected during the day session and market actually managed to close slightly higher.

Daily chart of the mini Russell 2000 for your review below, along with potential levels to watch.

y8jzbTAUzgQkgb0kW0mw1YDqWMd8QTaE0gAAACgAP8HGqwFOOs90Q8AAAAASUVORK5CYII=

Continue reading “Big Moves Down on the Open of Sunday Night Session”

Monthly Unemployment Causes Big Market Moves | Support and Resistance

Jump to a section in this post:
1. Market Commentary
2. Support and Resistance Levels – S&P, Nasdaq, Dow Jones, Russell 2000
3. Support and Resistance Levels – Gold, Euro, Crude Oil, T-Bonds
4. Support and Resistance Levels – Corn, Wheat, Beans, Silver
5. Economic Reports for Monday May 7, 2012


Hello Traders,

Monthly unemployment came out and as expected caused some big moves in major markets.

I sent an hourly and daily chart of the mini SP on Thursday afternoon and below you will see an updated daily chart of the mini SP after today’s big move.,

A8WyIUALFA9RAAAAAElFTkSuQmCC
Also our weekly newsletter is now available for your viewing.

Continue reading “Monthly Unemployment Causes Big Market Moves | Support and Resistance”