Cannon Trading / E-Futures.com
Crude Oil has been moving the rest of the commodities sector the last few months and has influence on all futures.
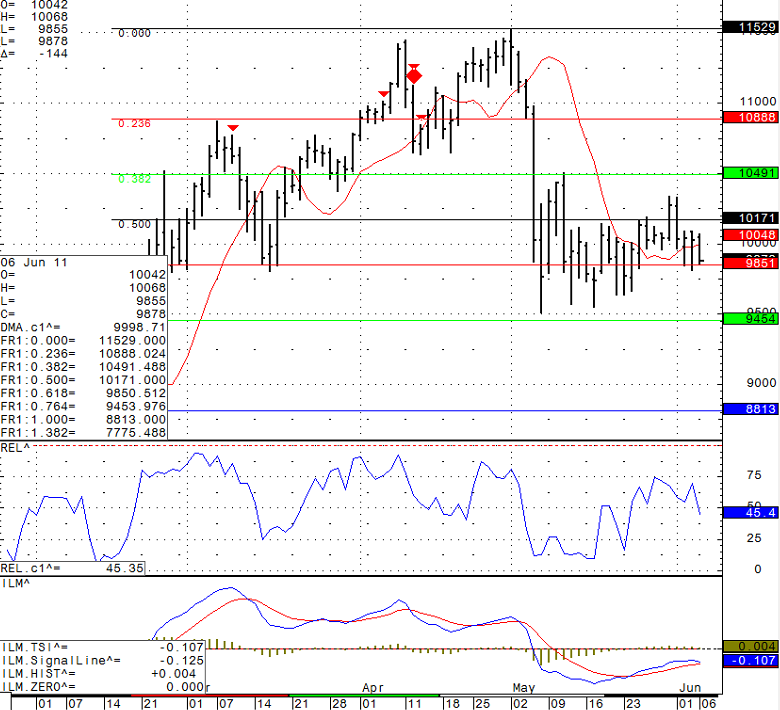
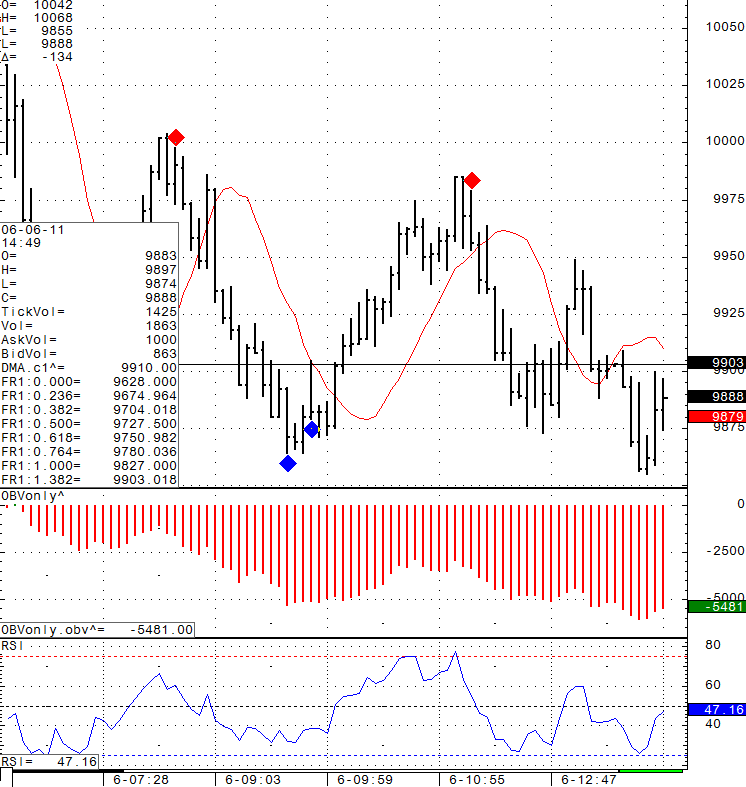
Thought I would share a daily chart for review, along with a screen shot of the crude oil set ups I share in my daily live day-trade signals service.
As far as longer term direction for crude, I will need to see which level we can break out first, 104.91 on the upside or 94.54 on the downside. In between, you have wide 410 trading range ( equal to $10,000 per one contract against you or in your favor….)
Daily mini S&P trading chart screenshot from today June 6th, 2011

Intra-day trading chart screenshot from today June 6th, 2011
Intra-day chart: (blue diamond = potential buy, red diamond = potential sell)
 Continue reading “Futures Trading Levels, Crude Oil as a Leader of Commodity Prices”