Crude Oil Futures & Economic Reports 3.25.2015

Connect with Us! Use Our Futures Trading Levels and Economic Reports RSS Feed.

Like us on FacebookFollow us on TwitterView our profile on LinkedInFind us on Google+Cannon Trading Futures Trading Resistance & Support Levels and Economic ReportsFind us on Yelp

1. Market Commentary
2. Futures Support and Resistance Levels – S&P, Nasdaq, Dow Jones, Russell 2000, Dollar Index
3. Commodities Support and Resistance Levels – Gold, Euro, Crude Oil, T-Bonds
4. Commodities Support and Resistance Levels – Corn, Wheat, Beans, Silver
5. Futures Economic Reports for Wednesday March 25, 2015

Hello Traders,

For 2015 I would like to wish all of you discipline and patience in your trading!

One of my favorite markets for day trading is crude oil. Actually not this month… it has taken way too much money out of my system… but normally it is. I like the fast action and some of the set ups both fear and greed present in this market.

Tomorrow is API (American Petroleum Institute) report that normally comes out Wednesday at 9:30 CDT (on short weeks, holidays etc. , this report will be pushed to Thursday at 10 AM CDT). I tell my clients that this report is way too volatile and I like to be out 5 minutes before and not resume trading 5 minutes until after the report comes out. This report by itself deserves a writing but on short, the report provides information on how our stock pile is doing ( = supply/demand) and the market will move based on the numbers versus what was expected. Again as a day trader, your main job is to know about this report, when it comes out and in my opinion stay out of the market during this time.

Observe crude oil futures tomorrow during the time of report to get a feel.

If you never traded crude oil futures before, observe for a bit and try doing so in demo mode first.

I wrote an article about this topic, you can access at:

https://www.cannontrading.com/community/newsletter/Day-Trading-Commodities-with-Crude-Oil-Futures#one

Continue reading “Crude Oil Futures & Economic Reports 3.25.2015”

Futures Levels & Economic Reports 2.04.2015

Connect with Us! Use Our Futures Trading Levels and Economic Reports RSS Feed.

Like us on FacebookFollow us on TwitterView our profile on LinkedInFind us on Google+Cannon Trading Futures Trading Resistance & Support Levels and Economic ReportsFind us on Yelp

1. Market Commentary
2. Futures Support and Resistance Levels – S&P, Nasdaq, Dow Jones, Russell 2000, Dollar Index
3. Commodities Support and Resistance Levels – Gold, Euro, Crude Oil, T-Bonds
4. Commodities Support and Resistance Levels – Corn, Wheat, Beans, Silver
5. Futures Economic Reports for Wednesday February 4, 2015

Hello Traders,

For 2015 I would like to wish all of you discipline and patience in your trading!

Day Trading Commodities with Crude Oil Futures

By: Ilan Levy-Mayer, Cannon Trading Commodities Broker & VP

Crude Oil is one of MY favorite futures market for day trading. Before I dive in and share with you how the volatility in crude oil fits my risk tolerance for day trading and provide a couple of chart examples, we should review some of the specifications of Crude Oil Futures.

Crude Oil Futures have monthly expiration. So each month we trade a different contract month, so one needs to know when is the first notice day and last trading day for crude oil futures in order to always make sure we are trading the proper month with the most liquidity and avoid any chance of getting into delivery situation.

Next is the contract size. Crude Oil futures are based on 100,000 barrels. To be honest from a day trading perspective all I care is that each tick or 1 cent fluctuation is $10 against me or in my favor per contract. That means that a move from 92.94 to 92.74 = $200.

Another factor is trading hours. At the time I am sharing my thoughts with you, April 8th 2013, crude oil futures trade on the CME Globex platform and trade from 5 PM CDT until the next day at 4 PM CDT. That is 23 of straight trading hours. I definitely don’t recommend day trading this market 23 hours… but it is good to know the trading hours.

Continue reading “Futures Levels & Economic Reports 2.04.2015”

Economic Reports & Futures Levels 1.30.2015

Connect with Us! Use Our Futures Trading Levels and Economic Reports RSS Feed.

Like us on FacebookFollow us on TwitterView our profile on LinkedInFind us on Google+Cannon Trading Futures Trading Resistance & Support Levels and Economic ReportsFind us on Yelp

1. Market Commentary
2. Futures Support and Resistance Levels – S&P, Nasdaq, Dow Jones, Russell 2000, Dollar Index
3. Commodities Support and Resistance Levels – Gold, Euro, Crude Oil, T-Bonds
4. Commodities Support and Resistance Levels – Corn, Wheat, Beans, Silver
5. Futures Economic Reports for Friday January 30, 2015

Hello Traders,

For 2015 I would like to wish all of you discipline and patience in your trading!

Few ways to enter a trade….

There are so many different aspects to trading.

From financial, emotional aspects to actual details of when to enter a trade, when to exit a trade and SO MUCH more in between…..

An important part of trading is trade entry. Assuming a trader knows why he/ she about to enter a trade the next step sounds simple right? Simply buy or sell the contract you wish to trade….

Many times it is that simple, depending on the time frame you are trading you may simply buy @ market and get the market price at that time. Some traders try to make small profits where every tick counts hence they may use the “buy bid” or “sell ask” button in order to get in at the best market price at that time. Many times you may save a tick by doing so but other times you may find yourself chasing the bid or the ask…

Another way is for a trader to decide that yes she wants to enter the specific market but she would like to get in at a price that is better and will use a limit order. Example may be, trader got the signal she was looking for to sell the mini SP 500 futures. The September contract was at 1982.75. Trader decided that she is willing to take the risk of not getting into the trade but she will only sell if the market hits her limit price of 1983.75 for example. There times that this patience will allow for a better entry price, hence better chances to meet target but there are times that trader will not get in and “miss a possible winning trade”

Continue reading “Economic Reports & Futures Levels 1.30.2015”

Futures Levels & Economic Reports 1.08.2015

Connect with Us! Use Our Futures Trading Levels and Economic Reports RSS Feed.

Like us on FacebookFollow us on TwitterView our profile on LinkedInFind us on Google+Cannon Trading Futures Trading Resistance & Support Levels and Economic ReportsFind us on Yelp

1. Market Commentary
2. Futures Support and Resistance Levels – S&P, Nasdaq, Dow Jones, Russell 2000, Dollar Index
3. Commodities Support and Resistance Levels – Gold, Euro, Crude Oil, T-Bonds
4. Commodities Support and Resistance Levels – Corn, Wheat, Beans, Silver
5. Futures Economic Reports for Thursday January 8, 2015

Hello Traders,

For 2015 I would like to wish all of you discipline and patience in your trading!

The recent sell off and volatility in crude oil grabbed many headlines these past few months.

Crude oil has been one of my favorite markets for day trading over the last 10 years or so because of it’s volatility and the fact that it either rewards you or punishes you very quickly…

I wrote an article about day-trading crude oil futures which you can read here.

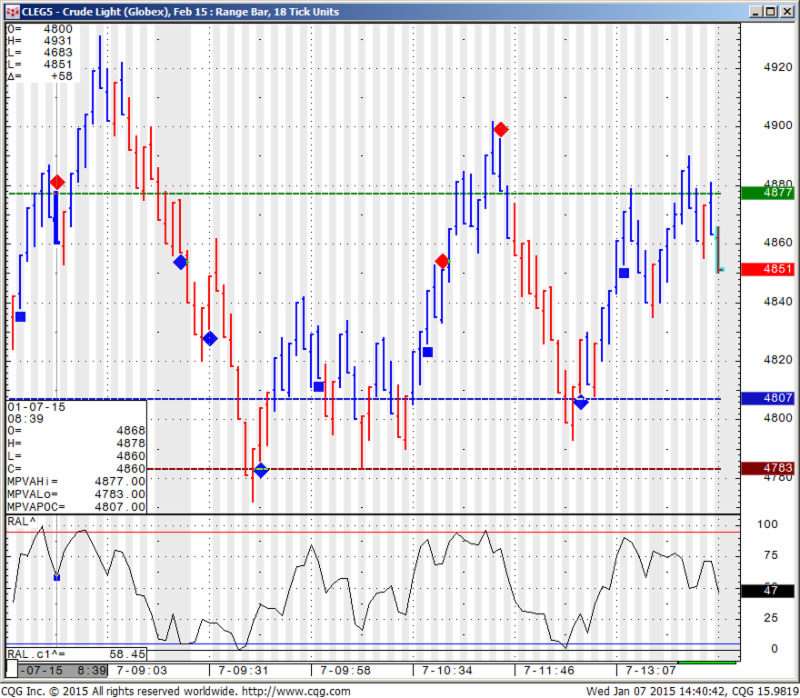
Below is a screen shot from my chart for today’s session.

I use 18 ticks range bar chart in addition to my 15 minutes charts.

CLEG5, - Crude Light (Globex), Feb 15: Range Bar, 18 Tick Units
CLEG5, – Crude Light (Globex), Feb 15: Range Bar, 18 Tick Units

Continue reading “Futures Levels & Economic Reports 1.08.2015”

Crude Oil Futures & Economic Reports 11.14.2014

Hello Traders,

For 2014 I would like to wish all of you discipline and patience in your trading!

Hello Traders,

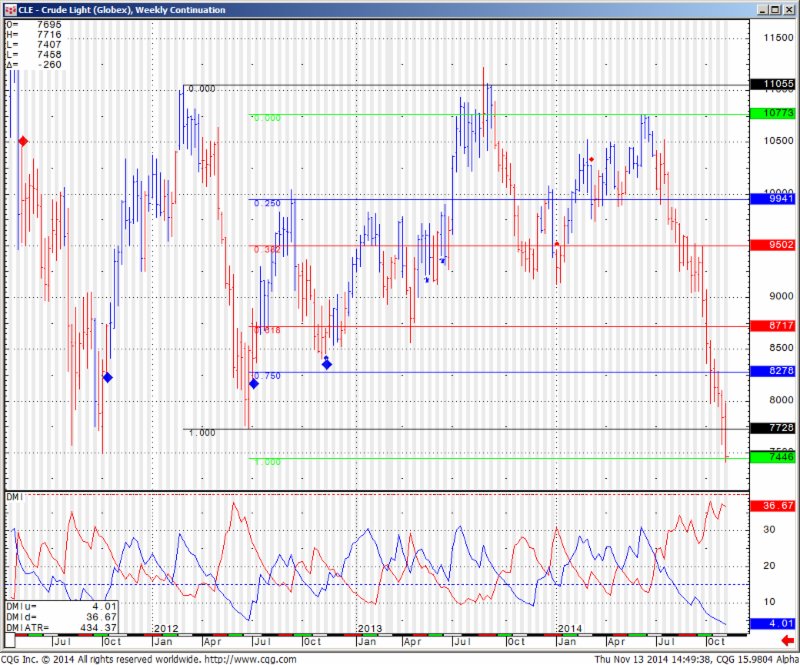
Tried to think about something worth sharing, information that can help traders and to be honest I could not think of anything I have not shared with you before so Decided to share a weekly chart of crude oil futures as we are sitting against MAJOR weekly support level at a 4 year lows. It will be interesting to see if we consolidate around here, have an initial bounce or break through and continue the slide we have seen. The next FIB level I draw on the weekly is at 53.90 just an FYI since you can not see it on the chart below.
PS: Crude Oil is one of the more active/volatile markets out there and is an interesting day trading market to say the least……
845

Continue reading “Crude Oil Futures & Economic Reports 11.14.2014”

Crude Oil & Gold Futures Renko Charts; Economic Reports & Levels 10.08.2014

Hello Traders,

For 2014 I would like to wish all of you discipline and patience in your trading!


Another two markets I like to touch on when it comes to “other markets to daytrade beside the mini SP 500” are Crude Oil Futures and Gold futures.


More than a few similarities between the two markets.


They are both volatile, can move VERY fast. I have seen some very large moves happen in matter of minutes if not seconds. The “fear & greed” factor really plays a role in these specific two markets.

Both have active trading hours starting with Far East trading around 10 PM est all the way to the next morning until about 3 PM est. Good volume generally speaking but not close to the mini SP or ten year notes. So you may see some slippage on stops but the volume is more than enough to trade size.

Each tick on gold is $10, so every dollar move =$100 against you or in your favor. Crude is similar, each tick = $10. One full $1 move = $1000.

Continue reading “Crude Oil & Gold Futures Renko Charts; Economic Reports & Levels 10.08.2014”

Bonds Futures and Crude Oil Futures Unique Patterns

Hello Traders,

For 2014 I would like to wish all of you discipline and patience in your trading!

Time sure does tick a bit different in the commodities and futures world….

Some traders know time has passed quickly when it is time to change to the Dec. contract versus the Sept. contract, others may notice it when they think “wow, monthly unemployment is this Friday, time sure flies…” and still other traders, perhaps professionals and money managers notice it when one month ends and another starts and it is time to share monthly results with their clients…..

Either way you look at it, hope October will be a great trading month!

Today I noticed a couple of market behaviors I have noticed in the past and wanted to share with you.

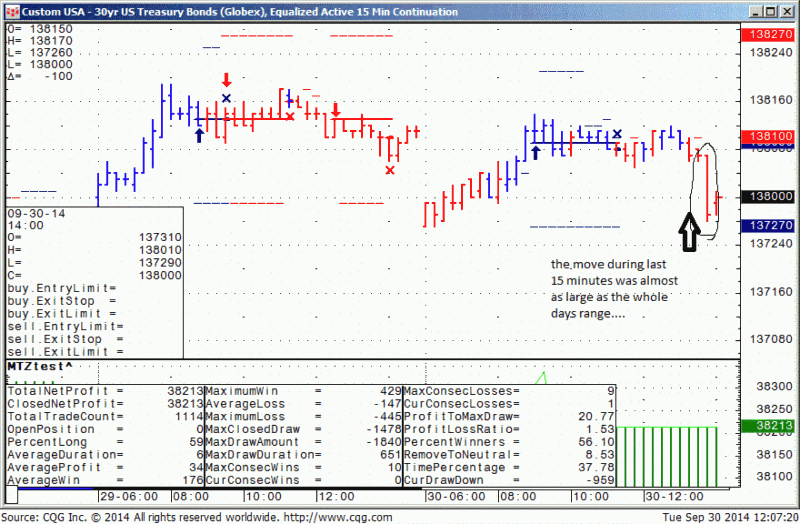
The first is us Bonds trading behavior on the last trading day of the month on the last 15 minutes of the old pit session, i.e. 13:45 to 14:00 central time.

While I did not spend any time trying to predict the direction of the move, I seen it many times, the bonds will make a 10-15 ticks ( 15 tick in bonds = $500 per contract) move during the last 15 minutes as large traders position themselves ahead of months close.

Below is a 15 minute chart of Bonds from today….notice the very tight range all day long until the last 15 minutes….if you go back to the last trading day of the month, you will notice this pattern more often than not. Of course, I leave the important work to you…and that is which way and how can one try to take advantage of it….PS: My trade system below missed entering the short by 1 tick )-:


Custom USA - 30Yr US Treasury Bonds (Globex), Equalized Active 15Min Continuation
Custom USA – 30Yr US Treasury Bonds (Globex), Equalized Active 15Min Continuation


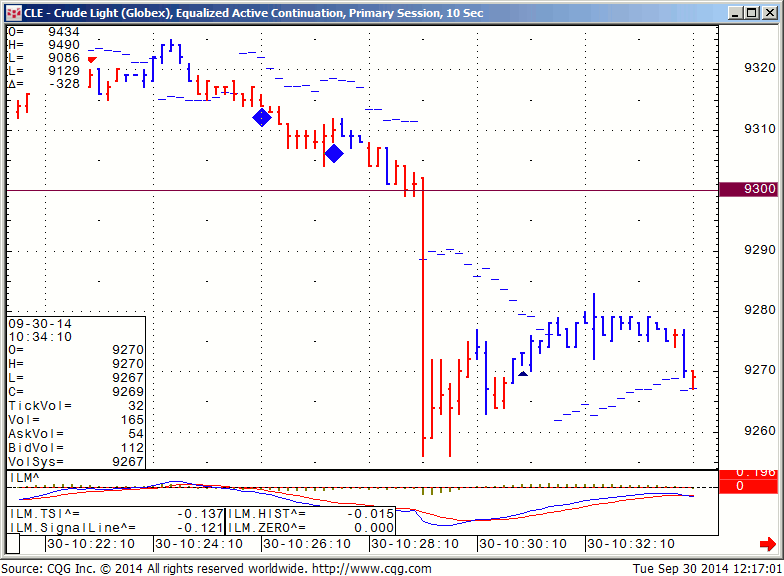
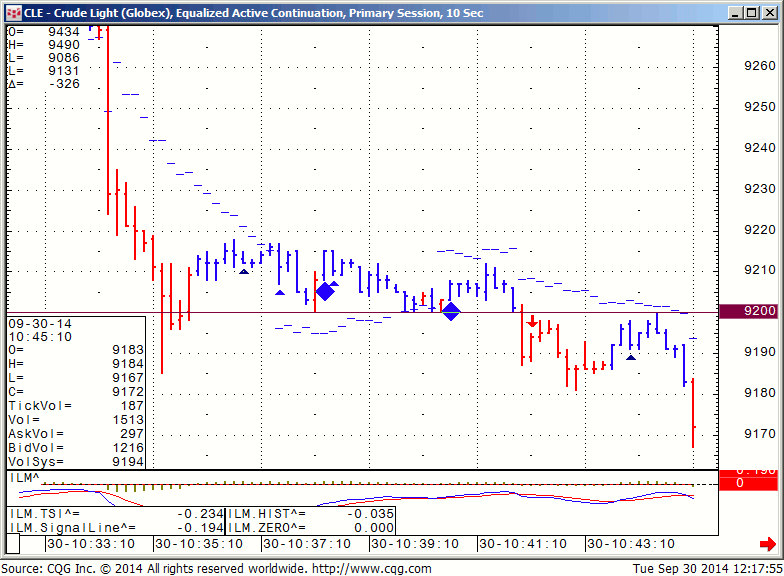
The second pattern for you to investigate if interested is the behavior of crude oil futures around “round numbers”. Today was obviously a HUGE move in crude ( down over $3 or $3000 per contract or 3.5%) but notice the 10 seconds chart I am sharing with ( yes, seconds, not minutes…) of what happened when crude broke below 93.00 and 92.00 today…..Once again, the million dollar question, how and can you take advantage of it? Obviously in this case it seems like there were MANY sell stops placed right below the round numbers which resulted in another accelerated move to the down side.

Crude breaking below $93.00


CLE - Crude Light (Globex), Equalized Active Continuation, Primary Session, 10Sec
CLE – Crude Light (Globex), Equalized Active Continuation, Primary Session, 10Sec


Crude breaking below $92.00

CLE - Crude Light (Globex), Equalized Active Continuation, Primary Session, 10Sec
CLE – Crude Light (Globex), Equalized Active Continuation, Primary Session, 10Sec


Continue reading “Bonds Futures and Crude Oil Futures Unique Patterns”

Crude Oil Futures Testing Major Weekly Support Level, SP500 Volatility Higher + Levels for 8.6.2014

Hello Traders,

For 2014 I would like to wish all of you discipline and patience in your trading!

Volatility has picked up again! Make sure you adapt as markets are always changing and what may work for range bound/ low volatility days will not work for wide range/ higher volatility days.

I see major support for SP500 at 1795 and it will be interesting to see price reaction if we test this level in the next few days.

On a different note, I wrote a quick analysis along with chart for Crude Oil futures at:

http://experts.forexmagnates.com/crude-oil-attempting-break-lower/

Continue reading “Crude Oil Futures Testing Major Weekly Support Level, SP500 Volatility Higher + Levels for 8.6.2014”

Futures Market update and Economic Reports 7.01.2014

Connect with Us! Use Our Futures Trading Levels and Economic Reports RSS Feed.

Like us on FacebookFollow us on TwitterView our profile on LinkedInFind us on Google+Cannon Trading Futures Trading Resistance & Support Levels and Economic ReportsFind us on Yelp

1. Market Commentary
2. Futures Support and Resistance Levels – S&P, Nasdaq, Dow Jones, Russell 2000, Dollar Index
3. Commodities Support and Resistance Levels – Gold, Euro, Crude Oil, T-Bonds
4. Commodities Support and Resistance Levels – Corn, Wheat, Beans, Silver
5. Futures Economic Reports for Tuesday July 1, 2014

Hello Traders,

For 2014 I would like to wish all of you discipline and patience in your trading!

 Wishing everyone great trading month in July!

TradeTheNews.com Weekly Market Update: Summer Doldrums Arrive Early

– The second quarter still has one session left to go on Monday, however there was very little quarter-end repositioning driving trading volumes or volatility any higher this week. The final reading of first quarter US GDP came in much lower at -2.9%, however markets ignored this well-trodden story to concentrate on more recent, more positive numbers: the May Markit manufacturing PMI reading pushed out to 61, its highest level since May 2010; May new home sales surged 18.6% from April to an adjusted rate of 504K, the highest level since 2008; and May core PCE at 1.5%. Similarly positive data were seen out of China and Japan, while European indicators held steady at a low level of growth and inflation. The S&P500 made an all-time intraday high on Tuesday and then edged lower, while European bourses moved lower all week. For the week, the DJIA dropped 0.6%, the S&P500 fell 0.1% and the Nasdaq gained 0.7.

– The annualized May core PCE, the Fed’s preferred measure of inflation, grew 1.5%, right in line with consensus expectations. This is the highest rate of growth in the measure since February 2013, and the overall reaction to the data among analysts and the Fed was very measured this week. The headline PCE was a bit higher, at 1.8%. Fed dove Bullard said PCE inflation would not get above 2% until 2015 but warned that the Fed is much closer to achieving its goals and the economy is doing much better than most people realize. While Bullard also reiterated his view that rate hikes would not be appropriate until the first quarter of 2015, Bullard’s firm tone helped force equity markets lower on Thursday morning. Fed hawk Lacker said the recent inflation data was not just “noise” and that inflation measures would head higher this year. Lacker also warned it would be a mistake to allow inflation to get out of control before the Fed started raising rates. Recall that last week, Fed Chair Yellen said “…recent readings on, for example, the CPI index have been a bit on the high side, but I think the data we’re seeing is noisy.”

– The final revision of the weather-impacted US first quarter GDP missed expectations and sank much lower, to -2.9% from the -1.0% preliminary figure. This was the fastest rate of decline since the Great Recession and the largest drop recorded since the end of World War II that wasn’t part of an official recession. However, nearly every component of the final reading was very modestly adjusted with the exception of imports and exports (which more or less cancelled each other out), and the services PCE, which was revised to +1.5% from +4.3% in the preliminary data, driven entirely by updated estimates of health care spending. The feds had assumed medical services would be up sharply due to expanded access under the ACA, but the latest quarterly services survey showed few signs of acceleration. After the data, Barclays adjusted its call to +2.9% from +4% in its prior view, to reflect a more modest rebound in Q2 consumption growth. TD Ameritrade cut its Q2 GDP view to +3.0% from +3.6% prior.

– Oil prices spiked higher on Tuesday on reports the Obama administration had cleared the way for the first exports of US crude oil in 40 years. Federal officials informed two energy firms – Pioneer Natural Resources and Enterprise Products Partners – they can legally export ultra-light oil condensate, which is a product of shale drilling. The front-month WTI crude contract traded as high as $107.50 before the Commerce Department clarified that there had been no broad change in policy. Commerce said that the two companies were granted permission to export shale condensate only after it had been run through a distillation tower to become a petroleum product and only because of a large oversupply of condensate, clarifying that the move had no larger implications for crude exports. Nevertheless, refiners tanked on Wednesday, with Valero down 10% or so on the week.

– On Friday Ukraine signed the historic free-trade agreement with the European Union that has been at the heart of months of violence and upheaval in the country, drawing an immediate threat of “grave consequences” from Russia. Ukraine President Poroshenko declared a unilateral ceasefire for the week, however hostilities continued, with both sides exchanging fire on several occasions. The tentative ceasefire is expected to extend through Monday to allow of an attempt at peace talks. Western powers reiterated they stand ready to impose more sanctions if Russia fails to make a good faith effort de-escalate the tensions and return full control of Ukraine’s border to the Kiev government.

– The US Supreme Court ruled against Barry Diller’s Aereo streaming television service, calling it a broad violation of broadcaster copyrights. The sweeping and definitive ruling was split 6 to 3, and the majority opinion went out of its way to call out Aereo as the equivalent of a cable company, not merely an equipment provider. They also emphasized that the ruling does not endanger other technologies, including cloud computing technology. Mr. Diller said the ruling was the end of the road for Aereo, calling the ruling a big loss for consumers.

– In earnings, shares of Nike gained ground on impressive fourth quarter numbers, beating on the top and bottom line. Futures orders were up 11%, while even China – previously a soft spot – appears to have made a fully recovery from its inventory adjustment with a 4% rise in sales. Walgreen missed bottom-line expectations in its third quarter, but bevenue was up 6% y/y and met consensus views while Rx comps were up 6.3%. Walgreen also said it was considering reincorporating in Switzerland for tax reasons as part of its combination with Alliance Boots. Monsanto beat earnings expectations in its third quarter results and authorized a big new share buyback program. Note that earnings were down 5% y/y and revenue missed expectations, dragged lower by a 16% y/y decline in sales of genetically-engineered corn seeds. Homebuilders Lennar and KB Homes reported very strong quarterly results, with robust gains in new home sales and strong growth in backlogs.

– In M&A news, France’s Alstom accepted General Electric’s $13.5 billion offer to acquire the firm’s power generation and grid businesses, with the additional caveat that GE enter three JVs with Alstom for grid infrastructure, renewable power equipment and nuclear power. The deal comes after the French government got an option to buy as much as 20% of Alstom from Bouygues following the closing of the deal, giving the government the guarantee it needed that Alstom will remain a French firm. Oracle reached a deal to acquire Micros Systems for $68/share in cash, in a total deal valued at $5.3B. This is the company’s biggest buy since acquiring Sun Microsystems for $7.4 billion back in 2009. Midwest utilities Wisconsin Energy and Integrys Energy entered an all-stock merger valued at $9.1 billion.

– FX markets remained locked in tight ranges for yet another week as volatility declined even further. Analysts noted as long as US bond yields were in retreat and the US yield curve continued its bullish steepening, the greenback should stay offered, pushing volatility even lower and keeping the carry trade in play. Volatility in the EUR/USD pair matched all-time lows at 4.55%. GBP/USD saw a little profit-taking after failing to close above the pivotal 1.7050 weekly chart point. USD/JPY slid lower, dropping below its 200-day moving average to end the week around 101.34 largely due to US rates. Key support is at 100.70 and could ignite downside momentum if broken.

– China HSBC flash manufacturing PMI for June returned to expansionary territory for the first time in six months, signaling the “targeted mini-stimulus” measures orchestrated by policymakers are starting to gain some traction. The data showed an upward inflection in input prices and improvement in the employment component, although growth in new export orders slowed. HSBC chief China economist said he expects continued accommodative policy until the recovery is sustained. China Beige Book assessment of Q2 was more measured, indicating fewer companies had access to credit amid weakening investment environment. Shanghai Composite ended the week up 0.5%.

– Trading in Tokyo was decidedly more bearish as Nikkei225 fell 1.7%, weighed down by firmer Yen and even more fodder for the BOJ to stick to its guns on policy. May unemployment rate fell to a 17-year low of 3.5%, while job-to-applicant ratio hit a 22-year high of 1.09x. Inflation figures also maintained their upward trend, with core Japan-wide CPI reaching its highest point since 1982. Japan PM Abe formally unveiled his “3rd arrow” plans early in the week, announcing plans to cut the corporate tax rate from current 35%+ to below 30% over the next few years, enact portfolio management reforms for pension funds, and revise the tax system with intent on promoting the number of women in the workforce.


If you like the information we share? We would appreciate your positive reviews on our new yelp!! Continue reading “Futures Market update and Economic Reports 7.01.2014”