Gold Futures Outlook/ Chart Review & Support and Resistance Levels 11.10.2021

Dear Futures Trader,

Get Real Time updates and more on our private FB group!

Daily chart of gold futures below for your review.
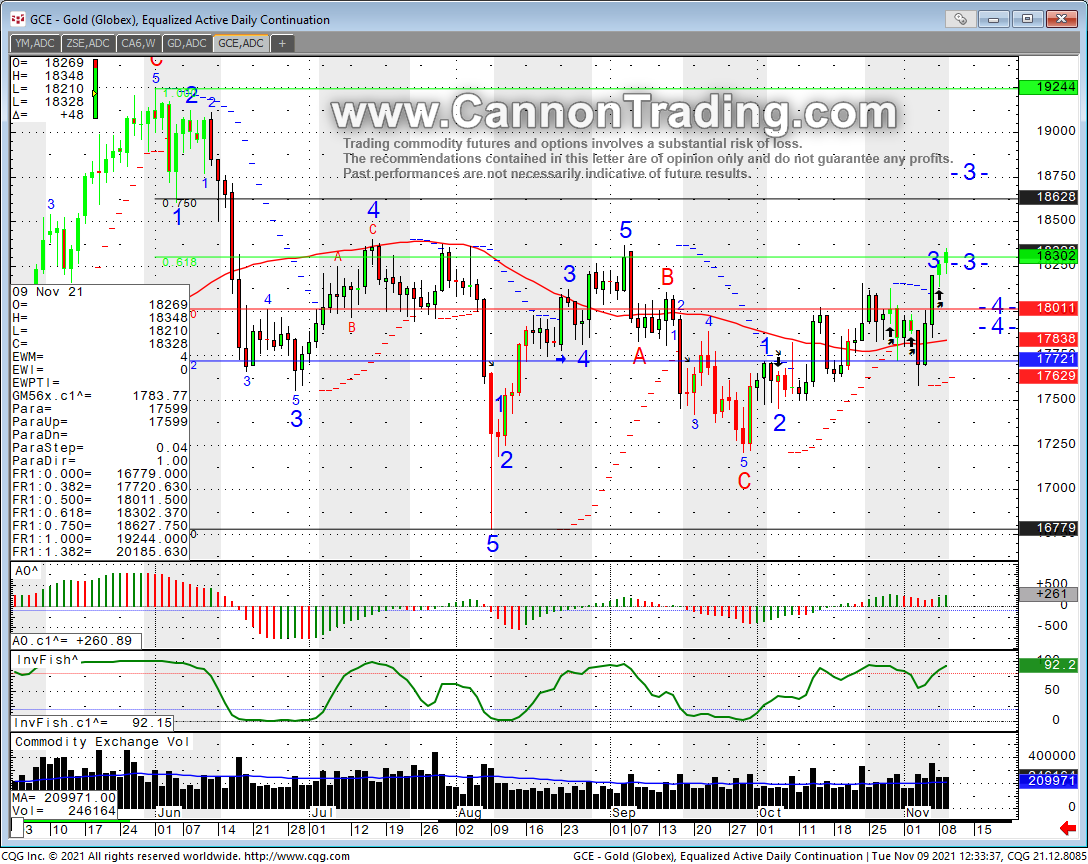
Notice a few recent TECHNICAL buy signals appeared on the daily chart.
Inflation fears are also a factor but Bitcoin seems to compete with gold for attention.
The gold market experienced good amount of selling between 1835 and 1841 during the last few months, a break above it can trigger another leg higher, failure will send this market to being the range bound it has these past few months.
If you are looking at longer term trades, MICRO gold is a good, smaller size alternative.
Some traders like to use combination of futures and options, example long the futures, selling a call on rallies and using the premium to buy puts in case of a pullback. Many ways to lose money in the trading world and very few to try and profit…..
Knowing your risk is the first step, managing your risk is the 2nd step. Evaluating the trade, positions and market dynamics is an ongoing process.
Gold Futures Chart 11.10.2021

Good Trading

Trading Futures, Options on Futures, and retail off-exchange foreign currency transactions involves substantial risk of loss and is not suitable for all investors.  You should carefully consider whether trading is suitable for you in light of your circumstances, knowledge, and financial resources. You may lose all or more of your initial investment. Opinions, market data, and recommendations are subject to change at any time when it comes to Futures Trading.


Futures Trading Levels

11-10-2021

Futures Support and Resistance Levels 11.10.2021


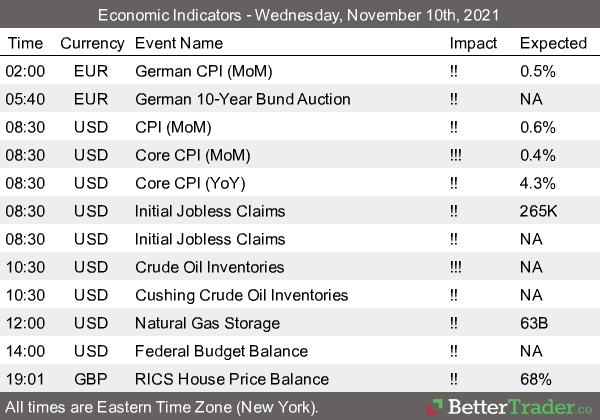
Economic Reports, source: 

https://bettertrader.co/ 

8cb377fe 0994 433b a3ea 2fa87e92542b


This is not a solicitation of any order to buy or sell, but a current market view provided by Cannon Trading Inc. Any statement of facts here in contained are derived from sources believed to be reliable, but are not guaranteed as to accuracy, nor they purport to be complete. No responsibility is assumed with respect to any such statement or with respect to any expression of opinion herein contained. Readers are urged to exercise their own judgement in trading.

Daily Chart Gold Market | Support and Resistance Levels

Jump to a section in this post:
1. Market Commentary
2. Support and Resistance Levels – S&P, Nasdaq, Dow Jones, Russell 2000
3. Support and Resistance Levels – Gold, Euro, Crude Oil, T-Bonds
4. Daily Gold Market Chart
5. Economic Reports for Thursday November 10, 2011

divider black 190

1. Market Commentary

First it was Greece, now Italy who helped send the market sharply lower.

Outlook for stock indices does not look good from technical standpoint but in today’s blog I actually wanted to share the daily chart for the gold market. (see below)

divider black 190

2. Support and Resistance Levels – S&P, Nasdaq, Dow Jones, Russell 2000

Contract (Dec. 2011) SP500
(big & Mini)
Nasdaq100
(big & Mini)
Dow Jones
(big & Mini)
Mini Russell
Resistance Level 3 1269.33 2394.67 12138 778.13
Resistance Level 2 1259.17 2373.33 12037 765.67
Resistance Level 1 1243.83 2344.67 11898 741.63
Pivot Point 1233.67 2323.33 11797 729.17
Support Level 1 1218.33 2294.67 11658 705.13
Support Level 2 1208.17 2273.33 11557 692.67
Support Level 3 1192.83 2244.67 11418 668.63

Continue reading “Daily Chart Gold Market | Support and Resistance Levels”