Bonds Futures and Crude Oil Futures Unique Patterns

Hello Traders,

For 2014 I would like to wish all of you discipline and patience in your trading!

Time sure does tick a bit different in the commodities and futures world….

Some traders know time has passed quickly when it is time to change to the Dec. contract versus the Sept. contract, others may notice it when they think “wow, monthly unemployment is this Friday, time sure flies…” and still other traders, perhaps professionals and money managers notice it when one month ends and another starts and it is time to share monthly results with their clients…..

Either way you look at it, hope October will be a great trading month!

Today I noticed a couple of market behaviors I have noticed in the past and wanted to share with you.

The first is us Bonds trading behavior on the last trading day of the month on the last 15 minutes of the old pit session, i.e. 13:45 to 14:00 central time.

While I did not spend any time trying to predict the direction of the move, I seen it many times, the bonds will make a 10-15 ticks ( 15 tick in bonds = $500 per contract) move during the last 15 minutes as large traders position themselves ahead of months close.

Below is a 15 minute chart of Bonds from today….notice the very tight range all day long until the last 15 minutes….if you go back to the last trading day of the month, you will notice this pattern more often than not. Of course, I leave the important work to you…and that is which way and how can one try to take advantage of it….PS: My trade system below missed entering the short by 1 tick )-:
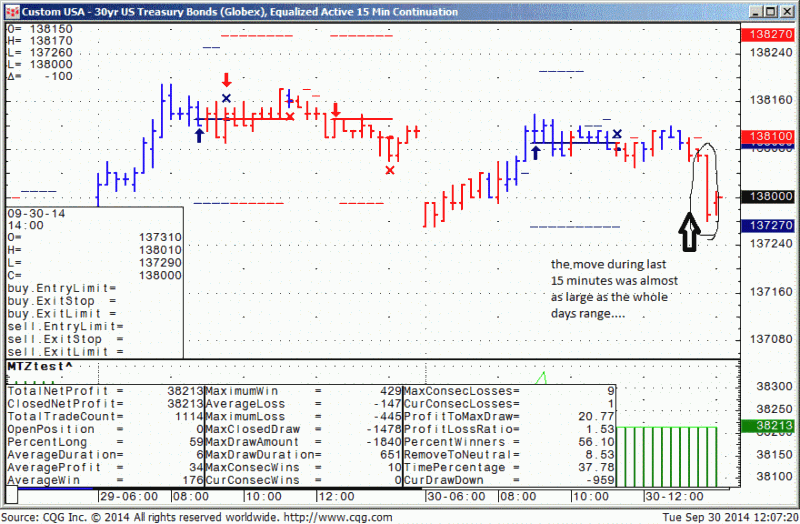
 

Custom USA - 30Yr US Treasury Bonds (Globex), Equalized Active 15Min Continuation
Custom USA – 30Yr US Treasury Bonds (Globex), Equalized Active 15Min Continuation


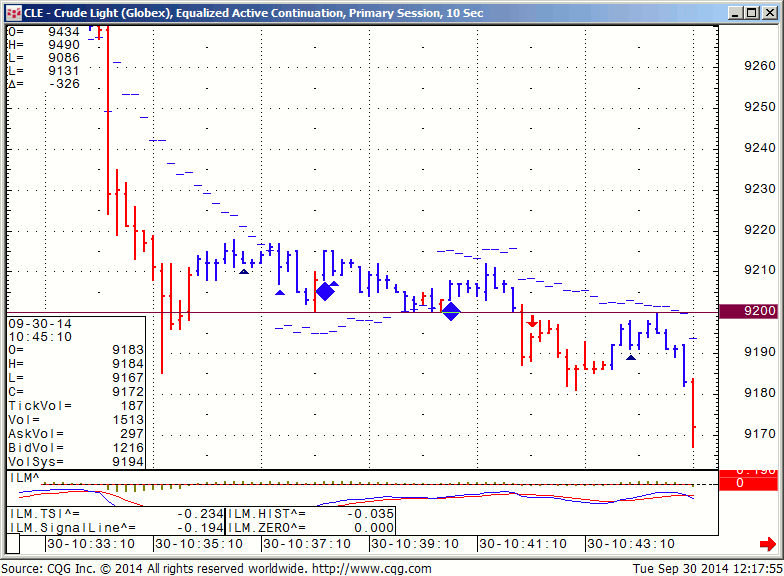
The second pattern for you to investigate if interested is the behavior of crude oil futures around “round numbers”. Today was obviously a HUGE move in crude ( down over $3 or $3000 per contract or 3.5%) but notice the 10 seconds chart I am sharing with ( yes, seconds, not minutes…) of what happened when crude broke below 93.00 and 92.00 today…..Once again, the million dollar question, how and can you take advantage of it? Obviously in this case it seems like there were MANY sell stops placed right below the round numbers which resulted in another accelerated move to the down side.

Crude breaking below $93.00
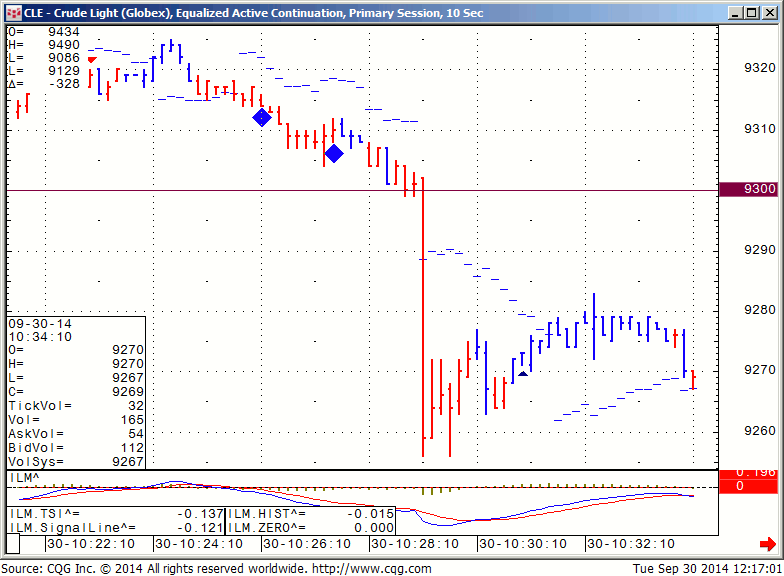
 

CLE - Crude Light (Globex), Equalized Active Continuation, Primary Session, 10Sec
CLE – Crude Light (Globex), Equalized Active Continuation, Primary Session, 10Sec


Crude breaking below $92.00

CLE - Crude Light (Globex), Equalized Active Continuation, Primary Session, 10Sec
CLE – Crude Light (Globex), Equalized Active Continuation, Primary Session, 10Sec


Continue reading “Bonds Futures and Crude Oil Futures Unique Patterns”

Futures Levels & Economic Reports 3.25.2014

Connect with Us! Use Our Futures Trading Levels and Economic Reports RSS Feed.

Like us on FacebookFollow us on TwitterView our profile on LinkedInFind us on Google+Cannon Trading Futures Trading Resistance & Support Levels and Economic ReportsFind us on Yelp

1. Market Commentary
2. Futures Support and Resistance Levels – S&P, Nasdaq, Dow Jones, Russell 2000, Dollar Index
3. Commodities Support and Resistance Levels – Gold, Euro, Crude Oil, T-Bonds
4. Commodities Support and Resistance Levels – Corn, Wheat, Beans, Silver
5. Futures Economic Reports for Tuesday March 25, 2014

Hello Traders,

For 2014 I would like to wish all of you discipline and patience in your trading!

Day-Trading Emini Index Futures – 9 Key Trading Concepts by TradingEmini.com

Tradingemini.com’s 9 Rules to help keep you in the 10% winning club Vs 90% of traders who lose money.

Trading is inherently risky but by following eight fundamental money management rules you can keep your capital safer while building your trading experience.

1. Look for high volume markets with a thin spread, so orders are filled quickly and it has high volatility, so there are opportunities for 2 to 4 good trades during the day. The Emini S&P500 Index Future is a good example of this type of market (Each point is worth $50, split into 4 ticks of $12.50 and there are 4 contracts a year, traded on the Chicago Mercantile Exchange).

2. Only risk 1% of your capital per trade, then your capital can absorb 100 consecutive bad trades. Even the best systems can expect 20% loosing trades, so the 1% rule gives you room to maneuver.

3. $10-$15k is the minimum recommended risk capital you should have per Emini S&P500 contract traded – then if you lose $1000-$1500 it only represents 10% of you capital, which is recoverable compared to a $3k account where the same loss equals 50% of your account, consequently you are more likely to lose the remainder of your capital rather than recover the loss.

4. Limit the hours you trade – we prefer the first 60-90 minutes, when typically there is a good trend before the lunch time chop – many professional traders trade this time period.

5. Limit the number of trades you make per day – 2-6 is good as the Emini usually has up to 3 trends per day and you should aim to catch 1-2 out of the 3. Overtrading racks up commission fees and increases the risk of revenge trading. A few ticks loss per trade quickly mounts up – 4 trades fired like a machine gun can easily become four losers, at 8 tick stops, that’s $400 loss, 4% of a $10k account. Patience is key, stalk trades.

6. On any one day stop trading when losses hit 5-10% of capital, which is recoverable, and indicates you are reading the market wrong, so stop, evaluate your errors and record them in your Trading Journal.

Continue reading “Futures Levels & Economic Reports 3.25.2014”

Futures Trading Levels and Economic Reports for May 17, 2013

Connect with Us! Use Our Futures Trading Levels and Economic Reports RSS Feed.

Like us on FacebookFollow us on TwitterView our profile on LinkedInFind us on Google+Cannon Trading Futures Trading Resistance & Support Levels and Economic ReportsFind us on Yelp

1. Market Commentary
2. Futures Support and Resistance Levels – S&P, Nasdaq, Dow Jones, Russell 2000, Dollar Index
3. Commodities Support and Resistance Levels – Gold, Euro, Crude Oil, T-Bonds
4. Commodities Support and Resistance Levels – Corn, Wheat, Beans, Silver
5. Futures Economic Reports for Friday May 17, 2013

Hello Traders,

For 2013 I would like to wish all of you discipline and patience in your trading! 


A few different ways to enter a trade…..A good client of mine told me that in the “out of trading world” he has always made his money by entering at the right price. Made me think about trading and the different ways one can enter a trade. Below is just a quick highlight/ food for thought and over the next few weeks I will expand and put up an article with chart examples:

Trading Levels and Economic Reports for May 9, 2013

Connect with Us! Use Our Futures Trading Levels and Economic Reports RSS Feed.

Like us on FacebookFollow us on TwitterView our profile on LinkedInFind us on Google+Cannon Trading Futures Trading Resistance & Support Levels and Economic ReportsFind us on Yelp

1. Market Commentary
2. Futures Support and Resistance Levels – S&P, Nasdaq, Dow Jones, Russell 2000, Dollar Index
3. Commodities Support and Resistance Levels – Gold, Euro, Crude Oil, T-Bonds
4. Commodities Support and Resistance Levels – Corn, Wheat, Beans, Silver
5. Futures Economic Reports for Thursday May 9, 2013

Hello Traders,

For 2013 I would like to wish all of you discipline and patience in your trading! 


Not sure what to make out of the recent “mini rally” in stock index. Low volume or not, the bottom line is that prices are edging higher.


What I PERSONALLY don’t like, is the lack of volatility intraday and the tight ranges along with the feeling that the market is being “manipulated”. That being said, we all need to learn to trade different types of markets at different times and be able to take what the market gives us and not what we wish it would….


In between I am sharing a screen shot from the ONLY stock index future I had a successful set up in today…the Mini Russell:


Trading Levels and Economic Reports for May 2, 2013

Connect with Us! Use Our Futures Trading Levels and Economic Reports RSS Feed.

Like us on FacebookFollow us on TwitterView our profile on LinkedInFind us on Google+Cannon Trading Futures Trading Resistance & Support Levels and Economic ReportsFind us on Yelp

1. Market Commentary
2. Futures Support and Resistance Levels – S&P, Nasdaq, Dow Jones, Russell 2000, Dollar Index
3. Commodities Support and Resistance Levels – Gold, Euro, Crude Oil, T-Bonds
4. Commodities Support and Resistance Levels – Corn, Wheat, Beans, Silver
5. Futures Economic Reports for Thursday May 2, 2013

Hello Traders,

For 2013 I would like to wish all of you discipline and patience in your trading! 


FOMC is now behind us and stock index futures look a little more vulnerable than before. My experience sugessts that many times, the bigger move and the direction of the move will take place the day followingn the FOMC, so I will close attention to market action tomorrow.

In between some good “trading , reading material ” to share with you:

Continue reading “Trading Levels and Economic Reports for May 2, 2013”