Get An Edge With the Trading Psychology Course, Gold Chart Review & Support and Resistance Levels 11.11.2021

Dear Futures Trader,

Get Real Time updates and more on our private FB group!

Get An Edge With the Trading Psychology Course

“You Must Understand That There Is More Than One Path To The Top Of The Mountain.”- Miyamoto Musashi, A Book Of Five Rings: The Classic Guide To Strategy
Many experienced traders say that the stiffest challenge you’ll face in becoming a futures trader is conquering your own psyche. Why? Because losing is part of trading, and people hate to lose.
In this “Trading Psychology” Course you will learn:
·    How to examine your patterns and behaviors and recognize when they are holding you back
·    Maintaining self-confidence as a trader even in the face of inexperience
·    The mathematical expectation model and how it can decrease your losses
·    Determining the trading plan that is right for your trading personality
·    Understanding and using Motivation – Risk – Reward to its full advantage
·    Creating effective trading technique strategies
·    Qualities of Successful Traders
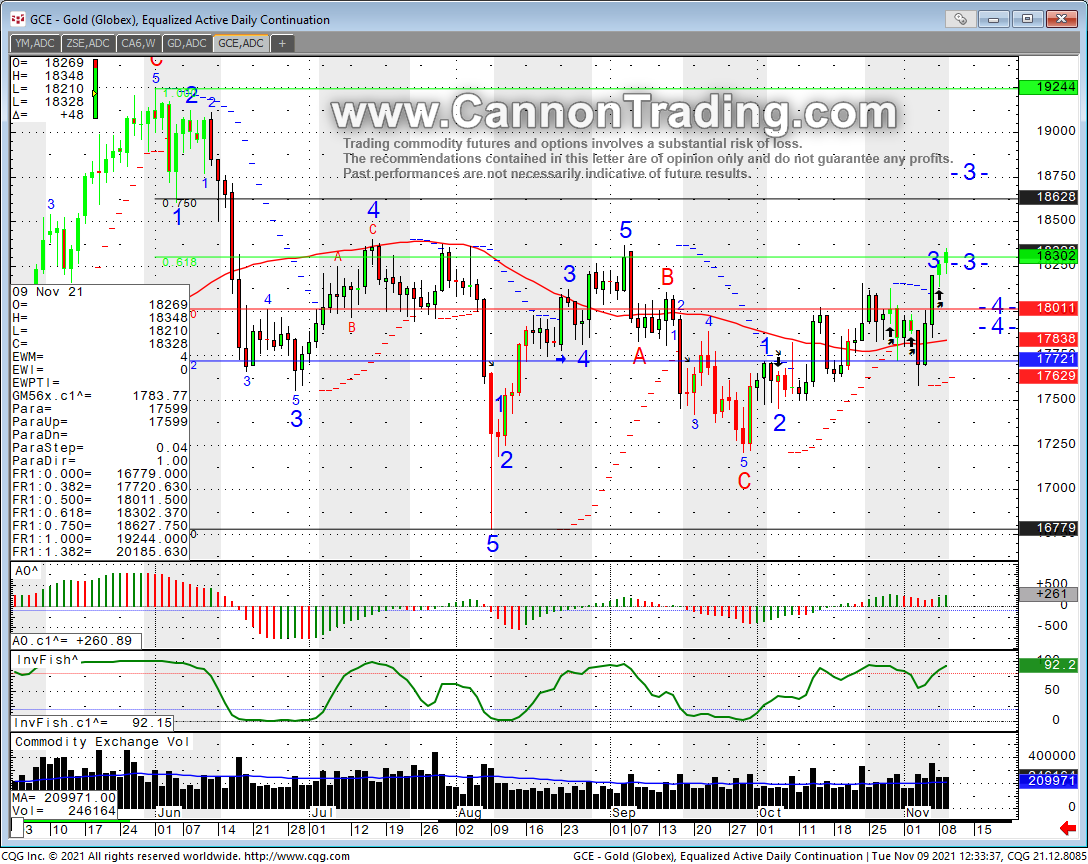
Futures Gold Daily Chart

Good Trading

Trading Futures, Options on Futures, and retail off-exchange foreign currency transactions involves substantial risk of loss and is not suitable for all investors.  You should carefully consider whether trading is suitable for you in light of your circumstances, knowledge, and financial resources. You may lose all or more of your initial investment. Opinions, market data, and recommendations are subject to change at any time when it comes to Futures Trading.


Futures Trading Levels

11-11-2021


Futures Trading Support and Resistance Levels 11.11.2021


Economic Reports, source: 

https://bettertrader.co/ 

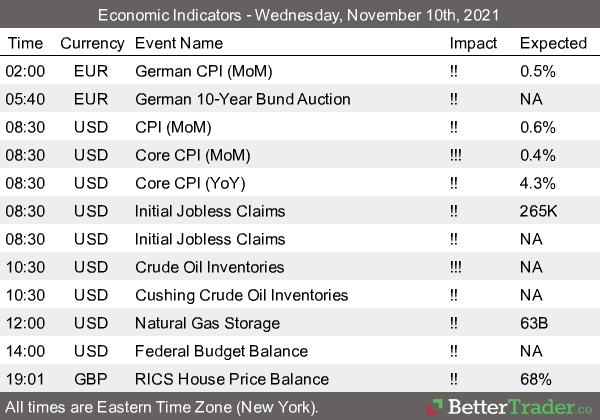
BetterTrader Economic Indicators 11.11.21


This is not a solicitation of any order to buy or sell, but a current market view provided by Cannon Trading Inc. Any statement of facts here in contained are derived from sources believed to be reliable, but are not guaranteed as to accuracy, nor they purport to be complete. No responsibility is assumed with respect to any such statement or with respect to any expression of opinion herein contained. Readers are urged to exercise their own judgement in trading.

Gold Futures Outlook/ Chart Review & Support and Resistance Levels 11.10.2021

Dear Futures Trader,

Get Real Time updates and more on our private FB group!

Daily chart of gold futures below for your review.

Notice a few recent TECHNICAL buy signals appeared on the daily chart.
Inflation fears are also a factor but Bitcoin seems to compete with gold for attention.
The gold market experienced good amount of selling between 1835 and 1841 during the last few months, a break above it can trigger another leg higher, failure will send this market to being the range bound it has these past few months.
If you are looking at longer term trades, MICRO gold is a good, smaller size alternative.
Some traders like to use combination of futures and options, example long the futures, selling a call on rallies and using the premium to buy puts in case of a pullback. Many ways to lose money in the trading world and very few to try and profit…..
Knowing your risk is the first step, managing your risk is the 2nd step. Evaluating the trade, positions and market dynamics is an ongoing process.
Gold Futures Chart 11.10.2021

Good Trading

Trading Futures, Options on Futures, and retail off-exchange foreign currency transactions involves substantial risk of loss and is not suitable for all investors.  You should carefully consider whether trading is suitable for you in light of your circumstances, knowledge, and financial resources. You may lose all or more of your initial investment. Opinions, market data, and recommendations are subject to change at any time when it comes to Futures Trading.


Futures Trading Levels

11-10-2021

Futures Support and Resistance Levels 11.10.2021


Economic Reports, source: 

https://bettertrader.co/ 

8cb377fe 0994 433b a3ea 2fa87e92542b


This is not a solicitation of any order to buy or sell, but a current market view provided by Cannon Trading Inc. Any statement of facts here in contained are derived from sources believed to be reliable, but are not guaranteed as to accuracy, nor they purport to be complete. No responsibility is assumed with respect to any such statement or with respect to any expression of opinion herein contained. Readers are urged to exercise their own judgement in trading.

Gold weekly chart +Support & Resistance Levels 6.21.2018

____________________________________________________________________

Voted #1 Blog and #1 Brokerage Services on TraderPlanet for 2016!!  

____________________________________________________________________

Dear Traders,

Follow us on Twitter and receive real time trade updates, market developments and breaking news!!
Gold WEEKLY chart for your review below.
This Sunday night I got the first weekly sell signal since the end of 2017. You can see the little red arrow along with the current bar marked in red. Just because a signal happened, does not mean we will see a sell off but for me personally it is a good probability that the pressure is stronger to the downside. I like some of the option plays one can do using vertical put spreads.
c2bdd324 236d 47a6 9507 0e70710e478b
The chart above includes some proprietary studies/ALGOS.
These ALGOS along with a 15 minutes one on one session is available for a free trial.

To sign up and more info visit: https://www.cannontrading.com/tools/intraday-futures-trading-signals 

Good Trading

Trading Futures, Options on Futures, and retail off-exchange foreign currency transactions involves substantial risk of loss and is not suitable for all investors.  You should carefully consider whether trading is suitable for you in light of your circumstances, knowledge, and financial resources. You may lose all or more of your initial investment. Opinions, market data, and recommendations are subject to change at any time.

Futures Trading Levels

06-21-2018

Contract September 2018  SP500 #ES_F Nasdaq100  #NQ_F Dow Jones  #YM_F Mini Russell #RTY_F BitCoin Index #XBT_F
Resistance 3 2801.25 7461.33 25029 1737.83 7109.66
Resistance 2 2789.75 7398.92 24944 1725.87 6961.28
Resistance 1 2780.25 7351.58 24803 1718.83 6857.81
Pivot 2768.75 7289.17 24718 1706.87 6709.43
Support 1 2759.25 7241.83 24577 1699.83 6605.96
Support 2 2747.75 7179.42 24492 1687.87 6457.58
Support 3 2738.25 7132.08 24351 1680.83 6354.11
Contract August Gold #GC_F July Silver #SI-F Aug. Crude Oil #CL-F Sept.  Bonds  #ZB_F Sept.  Euro #6E_F
Resistance 3 1284.9 16.48 67.89 144 27/32 1.1749
Resistance 2 1281.7 16.43 67.12 144 19/32 1.1713
Resistance 1 1276.7 16.36 66.33 143 31/32 1.1685
Pivot 1273.5 16.31 65.56 143 23/32 1.1649
Support 1 1268.5 16.24 64.77 143  3/32 1.1622
Support 2 1265.3 16.19 64.00 142 27/32 1.1586
Support 3 1260.3 16.12 63.21 142  7/32 1.1558
Contract July  Corn #ZC_F July Wheat #ZW_F July Beans #ZS_F July SoyMeal #ZM_F July Nat Gas #NG_F
Resistance 3 367.0 509.2 917.00 348.10 3.04
Resistance 2 361.8 499.6 906.50 343.00 3.01
Resistance 1 358.0 493.9 898.00 338.10 2.98
Pivot 352.8 484.3 887.50 333.00 2.95
Support 1 349.0 478.7 879.0 328.1 2.9
Support 2 343.8 469.1 868.50 323.00 2.89
Support 3 340.0 463.4 860.00 318.10 2.87

Economic Reports, source: 

http://app.bettertrader.co 


f9f245ad c1d4 435d 8460 6a55b5e3db2e

This is not a solicitation of any order to buy or sell, but a current market view provided by Cannon Trading Inc. Any statement of facts here in contained are derived from sources believed to be reliable, but are not guaranteed as to accuracy, nor they purport to be complete. No responsibility is assumed with respect to any such statement or with respect to any expression of opinion herein contained. Readers are urged to exercise their own judgement in trading.