E-Mini SP 500 – Support and Resistance Levels

Jump to a section in this post:
1. Market Commentary
2. Support and Resistance Levels – S&P, Nasdaq, Dow Jones, Russell 2000
3. Support and Resistance Levels – Gold, Euro, Crude Oil, T-Bonds
4. Support and Resistance Levels – March Corn, March Wheat, Jan Beans, March Silver
5.Economic Report for March 7, 2012

Hello Traders,

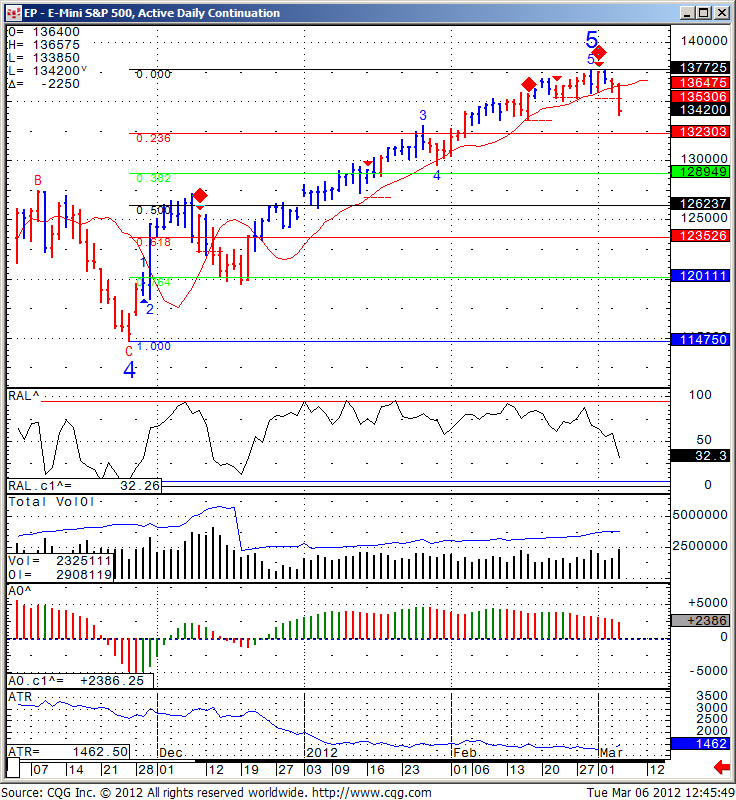
I mentioned last week I was looking for a confirmation to go short the mini SP500 on a swing trading basis. The confirmation came during last night session when the market broke below the red moving avg. ( my trigger) at 1363.

The hard question now is where does one place a stop, where does one look for profit target? etc.

The answer can vary quite a bit from trader to trader based on ones account size, time frame traded, market outlook and much more….

My initial target is still 1323 followed by 1289 but the hard part is where to place a stop now that the market has moved in my favor?

The proper stop is still around 1371, but like I said, you can attack this in many different ways and only the future will tell which route was the best to manage this trade…..
EP - E- mini S&P 500, Equalized Active Daily Continuation
EP – E- mini S&P 500, Equalized Active Daily Continuation

Continue reading “E-Mini SP 500 – Support and Resistance Levels”
Monthly, Weekly and Daily mini SP 500 | Support and Resistance Levels

Jump to a section in this post:
1. Market Commentary
2. Support and Resistance Levels – S&P, Nasdaq, Dow Jones, Russell 2000
3. Support and Resistance Levels – Gold, Euro, Crude Oil, T-Bonds
4. Support and Resistance Levels – March Corn, March Wheat, Jan Beans, March Silver
5.Economic Report for February 1, 2012

1. Market Commentary

New month is starting and I would like to wish everyone great trading in February.

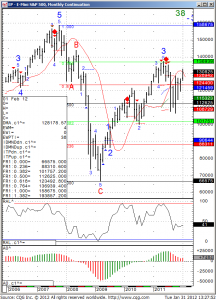
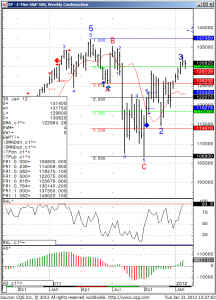
As the new month starting, I am sharing 3 different charts with you, Monthly, weekly and daily of the mini SP 500.

EP - E- mini S&P 500, Monthly Continuation
EP – E- mini S&P 500, Monthly Continuation


EP - E- mini S&P 500, Monthly Continuation
EP – E- mini S&P 500, Monthly Continuation

Regardless if you are day-trading or position trading, sometimes traders can get a better prospective by looking at larger time frames and going down.

EP - E- mini S&P 500, Equalized Active Daily Continuation
EP – E- mini S&P 500, Equalized Active Daily Continuation

Would you like to have access to my DIAMOND ALGO as shown above and be able to apply for any market and any time frame on your own PC ? You can now have a two weeks free trial where I enable the ALGO along with few studies for your own sierra/ ATcharts.

If so, please send me an email with the following information:

1. Are you currently trading futures?
2. Charting software you use?
3. If you use sierra or ATcharts, please let me know the user name so I can enable you
4. Markets you currently trading?

Continue reading “Monthly, Weekly and Daily mini SP 500 | Support and Resistance Levels”

E-Mini S&P 500 – Support and Resistance Levels

Jump to a section in this post:
1. Market Commentary
2. Support and Resistance Levels – S&P, Nasdaq, Dow Jones, Russell 2000
3. Support and Resistance Levels – Gold, Euro, Crude Oil, T-Bonds
4. Support and Resistance Levels – March Corn, March Wheat, Jan Beans, March Silver
5.Economic Report for January 26, 2012

1. Market Commentary

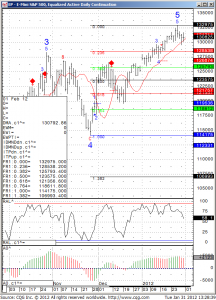
FOMC is behind us and below you will find some commentary from WSJ online as well as my daily chart of the Mini SP 500, which like always have at least two scenarios…upside possible targets as well as reversal zones if the market losses momentum..While I think this market may be overbought, I would not look to fight this momentum unless I see signs of buying exhaustion and reversal.
************************************************************
WSJ BLOG/MarketBeat: Today Looks a Lot Like a QE Trade
01/25/12 14:32

(This story has been posted on The Wall Street Journal Online’s Market Beat blog at http://blogs.wsj.com/marketbeat.)

By Min Zeng
US stocks and gold are bouncing, the ten-year Treasury yield is tumbling below 2% again (at least briefly) and the dollar is getting hit — sounds like the typical picture of a QE trade rippling through the financial markets.
Indeed, some market participants are taking today’s dovish FOMC statement as QE-lite.
The key boost for risky assets lies in the Fed’s further extension of its promise to keep its ultra-low target rate into late 2014. That means investors can be assured that the first rate hike won’t come until then or even later.
A bond trader says that the statement signals the Fed is more worried about deflation, which suggests more policy easing to co! me.
“They won’t use the D word but that is what they are thinking,” he says. “Expect QE3 to come.”
The dollar wilts on the dovish Fed, with the euro up 0.4% at $1.309.
Gold, another QE beneficiary, bounced from less than $1660 an ounce before the Fed’s statement to more than $1710 at last check.

EP - E- mini S&P 500, Equalized Active Daily Continuation
EP – E- mini S&P 500, Equalized Active Daily Continuation

Continue reading “E-Mini S&P 500 – Support and Resistance Levels”
15 Minutes mini SP Chart from Today’s Session

Jump to a section in this post:
1. Market Commentary
2. Support and Resistance Levels – S&P, Nasdaq, Dow Jones, Russell 2000
3. Support and Resistance Levels – Gold, Euro, Crude Oil, T-Bonds
4. Support and Resistance Levels – March Corn, March Wheat, Jan Beans, March Silver
5.Economic Report for January 19, 2012

1. Market Commentary

Volume is getting slightly better as the holiday season/ New year/ MLK is now behind us.

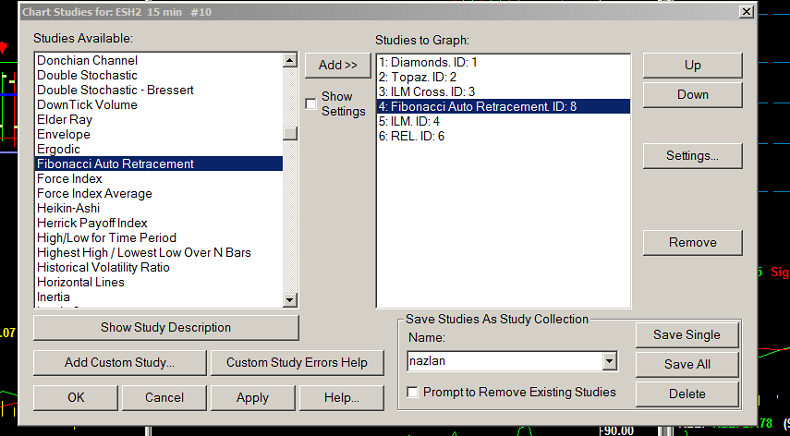
I wanted to touch base very briefly on a study many people know and use FIBONACCI levels and how the sierra charts ( ATcharts) has a study called Fibonacci Auto Retracement, which will draw the levels on your chart automatically as the market makes new highs/ lows etc.

I find this useful instead of having to go and manually draw levels.

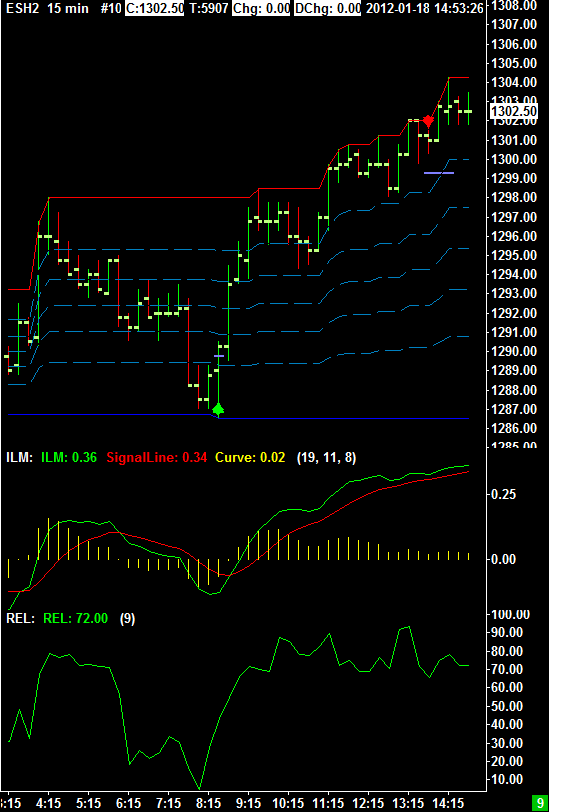
I also find these levels useful for profit targets and stops since by formula, these FIB levels as I call them take into account the range of the trading day, hence on days when ranges are wide, it will provide you possible stops and/ or targets that are wider and vice versa, when the trading day is narrow, the targets will get tighter.

Here are two screen shots on how I select the study and how it looks like on a 15 minutes mini SP chart from today’s session.

Chat Studies for ESH2 15 min


ESH2 15 min Chart
ESH2 15 min Chart

Notice how the FIB lines ( support / resistance levels) adjusted as market made new highs.

Continue reading “15 Minutes mini SP Chart from Today’s Session”